Abstract
The emergence of imaging flow cytometry (IFC) has brought novel applications exploiting its advantages over conventional flow cytometry and microscopy. One of the new applications is fluorescence in situ hybridization in suspension (FISH-IS). Conventional FISH is a slide-based approach in which the spot-like imagery resulting from hybridization with fluorescently tagged probes is evaluated by fluorescence microscopy. The FISH-IS approach evaluated by IFC enables the evaluation of tens to hundreds of thousands of cells in suspension and the analysis can be automated and standardized diminishing operator bias from the analysis. The high cell number throughput of FISH-IS improves the detection of rare events compared to conventional FISH. The applicability of FISH-IS is currently limited to detection of abnormal quantitative differences of hybridization targets such as occur in numerical chromosome abnormalities, deletions and amplifications.
Here, we describe a protocol for FISH-IS using chromosome enumeration probes as an example.
Keywords: FISH in suspension, ImageStream, cytogenetic abnormalities, acute myeloid leukemia
1. Introduction
Fluorescent in situ hybridization (FISH) is a slide-based assay used to identify a specific DNA or RNA sequence in a sample by hybridization with fluorescently-labeled probes complementary to the targeted sequences. By designing and combining the use of specific probes, FISH can be used to detect numerical as well as structural chromosome defects. For example, numerical changes such as monosomies and structural changes resulting from amplification or deletions can be detected by the loss or gain of hybridization spots while translocations can be detected by the colocalization of hybridization spots when probes of two different colors are used specific to the translocation partners.
Diagnostic DNA FISH was initially utilized for the detection chromosomal abnormalities in heritable disorders such as Trisomy 21 in Down syndrome and Disomy X in males with Klinefelter syndrome (1). Today, FISH is routinely used in the detection of chromosomal abnormalities important in the diagnosis, prognosis and response to therapy of patients suffering from a wide array of diseases including acute myeloid leukemia (AML). Approximately 55% AML patients have one or more chromosomal abnormalities that will contribute to disease (2, 3). The cytogenetic profile of an AML patient is important not only in the classification of the disease, and therefore the chemotherapy prescribed, but it is also important in the determination of minimal residual disease (MRD) at the time of clinical remission (4). Clinical remission is designated as normal white cell counts, absence of blasts in the bone marrow, and the absence of the chromosomal abnormality (5, 6). This third criterion, however, is not mandatory at remission and is not always utilized due to the lack of published studies showing its prognostic value. One of the main reasons for this is that the low numbers of abnormal cells present at remission are below the threshold for detection by the conventional FISH assay (7). The lower threshold of sensitivity of conventional FISH is probe specific but is commonly at the 5–10% level (8, 9). A patient with just 2% cells containing the abnormality would, therefore, be considered ‘negative’. With relapse rates varying from 30–70% depending on classification of the initial disease (10), indicates that approximately half of all patients are in fact false negatives.
The current protocol using imaging flow cytometry was developed in our lab to improve on the sensitivity of FISH. Its feasibility was previously described using Trisomy 8 in acute myeloblastic leukemia as a model (11). This protocol can routinely analyze orders of magnitude higher numbers of cells than conventional FISH, and the analysis can quickly identify chromosomal abnormalities. The lower threshold of sensitivity of FISH-IS is at least 1%, as previous described (11). This makes it ideal for the detection of abnormalities in rare cells, and therefore may improve the detection of MRD at clinical remission.
2. Materials
2.1 Buffers used
Chloroform-free Carnoy’s Fixative solution (3:1 methanol:acetic acid): 36 mL methanol and 12 mL glacial acetic acid carefully mixed in a fume hood in a 50mL tube by inverting (see note1). Prepare a fresh stock of this solution for each experiment.
Wash buffer: 1× phosphate buffered saline (PBS), 1% bovine serum albumin (BSA). Weigh 0.5 g BSA and add 40 mL ice cold 1× PBS (see note2). Mix until BSA has dissolved. Make up to 50 mL with ice cold 1× PBS. Store at 4 ºC (see note2).
SSC Buffer I: 2× saline-sodium citrate (SSC), 0.1% IGEPAL CA-630, pH 7.0. Add 4 mL 20× SSC to 26 mL 1× PBS. Add 40 μL IGEPAL CA-630 to solution and mix. Adjust pH to 7.0 with NaOH and make up to 40 mL with 1× PBS (see note3). This buffer should be freshly prepared each week (see note4).
SSC Buffer II: 0.4× SSC, 0.3% IGEPAL CA-630, pH 7.0. Add 800 μL 20× SSC to 26 mL 1× PBS. Add 120 μL IGEPAL CA-630 to solution and mix. Adjust pH to 7.0 with NaOH and make up to 40 mL with 1× PBS (see note3). This buffer should be freshly prepared each week (see note4).
2.2 Cell Preparation
2.3 DNA Hybridization Reagents
Vysus Chromosome Enumeration Probes (CEP) probes (Abbott Molecular, Des Plaines, IL, USA) (see note7). These commercial probes are designed to target highly repetitive regions around the centromere of the chromosome. They are available in a number of fluorochromes (Table 1). All these fluorochromes are available to study most chromosomal abnormalities. The fluorochrome used in this study is SpectrumGreen (Ex: 488 nm/Em: 520 nm). In this protocol we use chromosome 8 as proof-of-principle. Store probes at −20 °C.
CEP Hybridization Buffer (Abbott Molecular, Des Plaines, IL, USA). Buffer contains Dextran sulfate, formamide, and SSC (see note8). Store at −20 °C.
RNase/DNase treated water
Hemocytometer (see note9)
Tabletop centrifuge
Two dry heat blocks (see note10)
ImageStreamX (Amnis, part of EMD Millipore, Seattle, WA, USA) equipped with a 40× objective and Extended Depth of Field (EDF) function (see note11).
IDEAS® analysis software (Amnis, WA, USA)
Table 1.
Available fluorochromes for Vysis probes (Abbott Molecular)
| Fluorochome | Excitation | Emission |
|---|---|---|
| SpectrumAqua | 405nm | 430–520nm |
| SpectrumGreen | 488nm | 480–560nm |
| SpectrumGold | 488/561nm | 510–650nm |
| SpectrumOrange | 561nm | 550–650nm |
| SpectrumRed | 658nm | 580–690nm |
3. Methods
Carry out all procedures at room temperature unless otherwise specified.
3.1 Preparation of peripheral blood mononuclear cells (PBMCs)
3.1.1. Collect approximately 10 mL whole blood from a donor/patient in a Sodium Heparin tube (see note5).
3.1.2. Isolate PBMCs using Ficoll-Hypaque density centrifugation gradient according to manufacturer’s instructions (see note6).
3.1.3. Following isolation, wash cell pellet with 5 mL 1× PBS and centrifuge at 600 g for 4 minutes.
3.1.4. Decant superatant. Resuspend cell pellet in 3 mL 1× PBS.
3.1.5. In a fume hood, add 12 mL chloroform-free Carnoy’s Fixative solution slowly (adding approximately 1 ml/15 sec) with gentle vortexing to prevent clumping of cells (see note12).
3.1.6. Incubate cell suspension at room temperature for 10 minutes to ensure complete fixation.
3.1.7. Store cell suspension at −20 °C (see note13).
3.2 Hybidization of DNA to probe
3.2.1. Place 3 mL fixed cells into a 15 mL tube and wash with 5 mL ice cold 1× PBS/1% BSA (see note14).
3.2.2. Centrifuge at 600 g for 4 minutes, and then decant supernatant.
3.2.3. Resuspend cells in 5 mL ice cold 1× PBS/1% BSA again.
3.2.4. Centrifuge at 600 g for 4 minutes, and then decant supernatant.
3.2.5. Resuspend cells in 2 mL SSC Buffer I (see note15).
3.2.6. Count cells using a hemocytometer according to manufacturer’s instructions (see note9).
3.2.7. Place 1.5×10⁶ cells into a fresh 15mL tube and centrifuge at 600 g for 4 minutes (see note16).
3.2.8. Decant supernatant. Resuspend cell pellet in 500 μL SSC Buffer I and transfer cell suspension into a thin-walled 0.65 mL eppendorf tube (see note17).
3.2.9. Centrifuge at 600 g for 5 minutes at room temperature.
3.2.10. Carefully aspirate and discard supernatant (see note18).
3.2.11. Prepare hybridization Buffer mix: 28 μL CEP Hybridization Buffer and 10 μL RNase/DNase free water (see note19).
3.2.12. Add 38 μL Hybridization Buffer mix to cells
3.2.13. Add 2 μL CEP probe to each appropriate tube (see note20). If adding more than one probe to a particular tube the volume of water should be reduced to ensure final volume is always 40 μL (see note21).
3.2.14. Place samples in a pre-heated dry heat block at 80 °C for 5 minutes (see note10).
3.2.15. Transfer samples into a pre-heated dry heat block at 42 °C for 14 hours (see notes 10 and 22).
3.2.16. Warm 200 μL SSC Buffer II in a pre-heated dry heat block to 73 °C for 10 minutes (see note23).
3.2.17. Remove samples from 42 °C heat block and centrifuge cells at 6000 g for 5 minutes at room temperature (see note24).
3.2.18. Aspirate and discard supernatant. Resuspend cell pellet in pre-warmed 200 μL SSC Buffer II.
3.2.19. Incubate cell suspension in the pre-heated dry heat block at 73 °C for 2 minutes to facilitate the removal of excess probe and probe that may been have non-specifically bound to sequences partially homologous to the target sequence (see note25).
3.2.20. Add 200 μL ice cold FBS to suspension to quickly drop the temperature and prevent clumping of cells.
3.2.21. Centrifuge cells at 6000 g for 5 minutes at room temperature.
3.2.22. Aspirate and discard supernatant. Resuspend cell pellet in 100 μL ice cold FBS (see note26).
3.2.23. The single color compensation control for SpectrumGreen can be prepared in one of two ways. A separate sample can be hybridized or a small aliquot can be removed before DAPI (nuclear dye) staining in step 25. We perform the latter and remove 10 μL cells into a fresh 1.5 mL Eppendorf before DAPI stain. Add 90 μL FBS to this to make solution up to 100 μL.
3.2.24. For the single color control for DAPI, lyse red blood cells from a healthy donor whole blood sample. Fix the PBMCs with 4% formaldehyde for 10 minutes at room temperature. Centrifuge at 600 g for 4 minutes, and then decant supernatant. Wash cells with 5 mL 1× PBS and Centrifuge at 600 g for 4 minutes. Decant supernatant and resuspend cells in residual volume of 1× PBS, which should total approximately 100 μL.
3.2.25. Add 10 μL 5 μg/mL DAPI to test sample and DAPI compensation control.
3.3 Data Acquisition and Analysis
3.3.1. Set up experiment template on ASSIST calibrated ImageStreamX (see note11).
3.3.2. Set cell classifiers to eliminate debris and large aggregates: Area Lower Limit = 50; Area Upper Limit = 250 (Figure 1A, red box, and see note27).
3.3.3. Set cell classifiers to eliminate non-nucleated cells: Channel 7 Intensity Minimum = 1000 (Figure 1A, green box, and see note28).
3.3.4. Enable only those channels used in the experiment to minimize the electronic file size. In this protocol channels 1 (brightfield, camera 1), 2 (CEP-SpectrumGreen), 6 (scatter), 7 (DAPI-nucleus), and 9 (brightfield, camera 2) are enabled (see Figure 1A, yellow box).
3.3.5. Turn on 405nm laser at 10mW and 488nm laser at 50mW and 785nm laser for scatter at the ASSIST-defined optimal intensity (usually between 1–5mW) (Figure 1B, green oval, and see note29).
3.3.6. Ensure that the objective is 40× and the EDF function box is checked (Figure 1B, blue oval, and see note11).
3.3.7. Collect 20,000 events that are ‘single cells’ and nucleated (Figure 1B, red oval, and see note30). Events are collected as a raw image file (rif) file.
3.3.8. To acquire compensation controls enable all channels and turn off the brightfield illumination and scatter laser. The 405nm and 488nm lasers should remain on at the power used to acquire the test sample (Figure 1B, green oval). A minimum intensity cell classifier is set at 1000 for the channel of interest (for SpectrumGreen it would be channel 2, and for DAPI, channel 7) (Figure 2). Collect 500 positive events (see notes 31 and 32).
3.3.9. Perform compensation post-acquisition in IDEAS® software according to standard procedure by making a compensation matrix (.ctm) file based on the single color controls.
3.3.10. When opening the rif file for the test sample you will be prompted to apply the compensation (ctm) file to the analysis. Apply the ctm file prepared in step 9.
3.3.11. The IDEAS® software will automatically create a compensated image file (cif) and a data analysis file (daf). Open the daf file to begin analysis.
3.3.12. First perform a hierarchical gating strategy to select focused, single events, to which the CEP probe has successfully hybridized (Figure 3 and see note33).
3.3.13. Design a spot mask for the SpectrumGreen signal (Figure 4). Optimize the radius and spot-to-background ratio of the mask on one cell but always check the efficiency of the mask on a selection of other cells to ensure the mask performs well for them all (11).
3.3.14. Apply the generated spot mask to the ‘Spot Count’ feature for channel 2 (SpectrumGreen) and graph the spot count of the hybridized cells using a histogram (Figure 5A).
3.3.15. The control sample (a healthy donor probed for CEP Chr8 should theoretically result in two spots in each cell but spot counts and ploidy are not necessarily directly correlated. Since the ISx captures a 2D image of a 3D cell in flow one spot may be the result of two spots in such close proximity that the software cannot distinguish them (see note34). Three or even four spots may be the result of a segregated hybridization signal and is a common occurrence also seen in conventional FISH (Figure 6). The next steps will apply a fluorescence intensity parameter to correct spot counting deviations from ploidy.
3.3.16. Draw a gate on each spot population (Figure 5A).
3.3.17. Draw an Intensity histogram of the SpectrumGreen signal for each population. True disomies whether counted as one, two, or three spots should have a similar fluorescence distribution (Figure 5B and see note35).
Figure 1. Setting up the Inspire software.
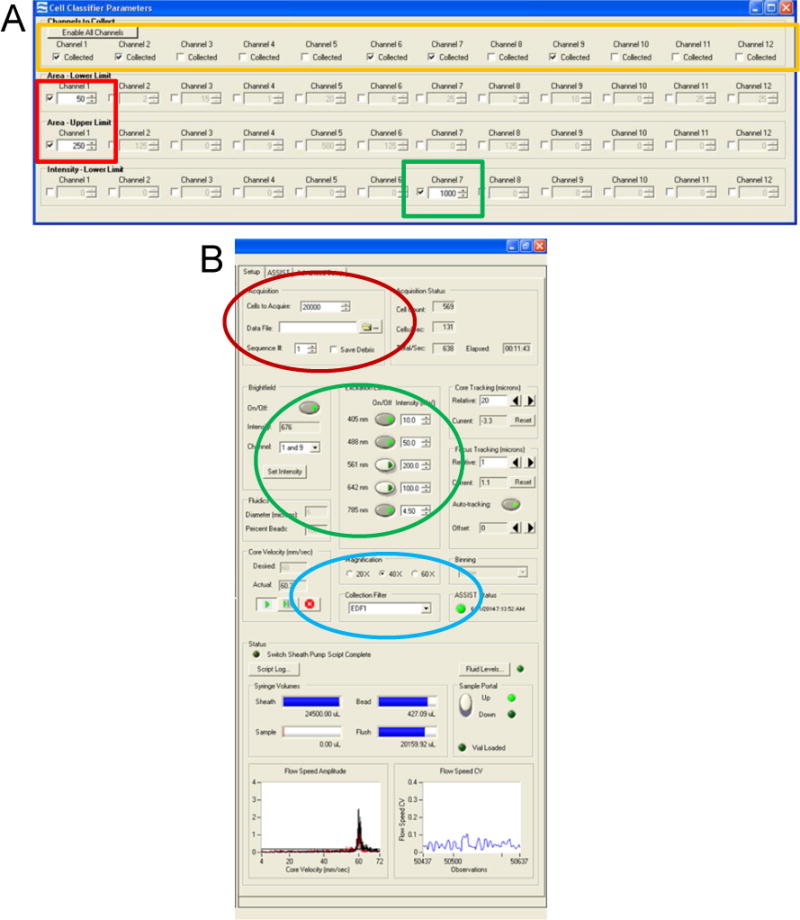
(A) Cell Classifiers panel with the Area Lower Limit and Area Upper Limit for channel 1 brightfield selected (red box). Intensity Lower Limit of channel 7 is selected to collect events with a positive nuclear signal (green box), and the desired channels selected (yellow box). (B) Experimental set-up panel on the left of the user interface is highlighted. Acquisition parameters (red oval), illumination (green oval), and magnification with EDF filter (blue) are shown.
Figure 2. Setting classifiers for compensation controls.
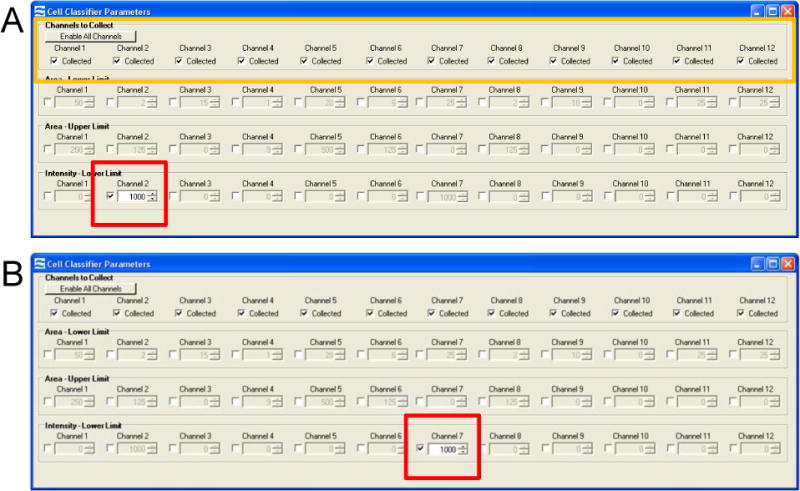
(A) Compensation classifiers for the SpectrumGreen probe that is detected in channel 2. All channels are enabled (yellow box) and an Intensity Lower Limit of channel 2 is selected to collect events with a positive signal (red box). (B) Compensation classifiers for the DAPI nuclear dye that is detected in channel 7. All channels are again enabled and an Intensity Lower Limit of channel 7 is selected to collect events with a positive signal (red box).
Figure 3. Hierarchical gating strategy to select cells of interest.
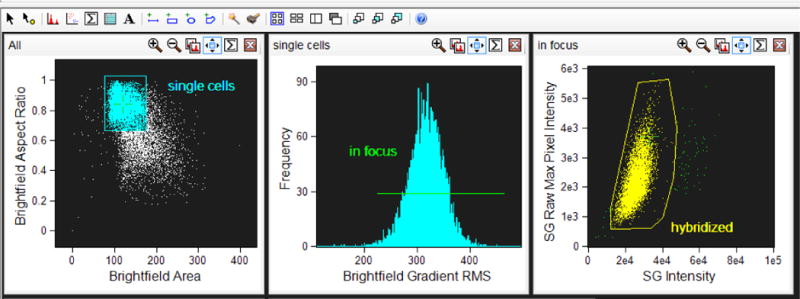
Single events are gated using Area of the Brightfield image (either in channel 1 or channel 9) versus Aspect Ratio of the brightfield image (aspect ratio close to 1 represents a single cell). Cells in focus are gated using Gradient Root Mean Squared of the Brightfield image. Positively hybridized cells are gated using Intensity of the SpectrumGreen signal verus Raw Max Pixel of the SpectrumGreen signal (Raw Max Pixel is a measure of the brightest pixel in the event). Very bright event to the right of the scatterplot are not included since, upon visual inspection, they represent doublet events that were insufficiently eliminated by the initial single cell gate.
Figure 4. Setting the Spot Mask.
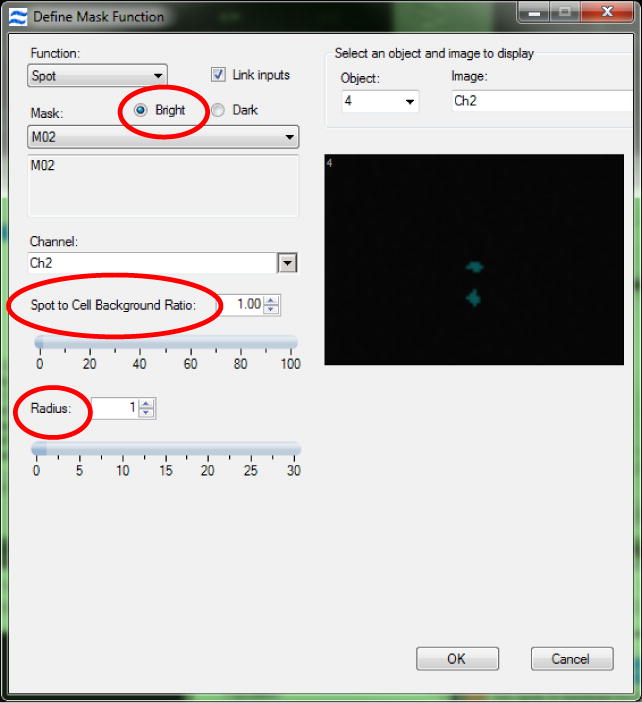
To accurately design a spot mask first the ‘bright’ option must be checked. This ensures the mask obtains the bright regions from an image regardless of any intensity differences from one spot to another. Next, alter the spot-to background ratio and the radius of the spot mask to ensure the mask covers the spots but does not include any background.
Figure 5. Correlation between spot count and, ploidy and fluorescence intensity.
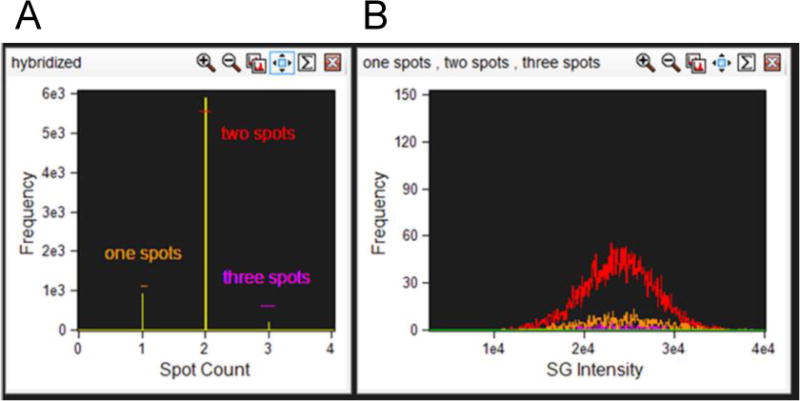
(A) Cells that are positively hybridized are plotted on a histogram with the Spot Count feature with the appropriate spot mask applied. Each spot population is gated as shown. (B) Each spot population overlaid on a histogram of Intensity of the SpectrumGreen signal.
Figure 6. Segregated hybridization signal.
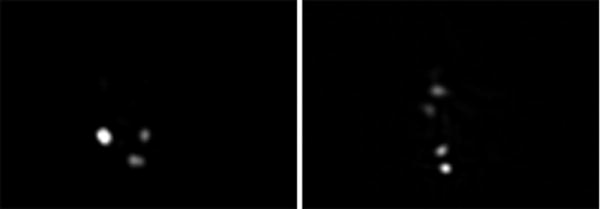
The images show CEP8 SpectrumGreen probe from a healthy donor where all events should contain two spots. Three spots (left image) or four spots (right image) can be observed but the intensity and proximity of the spots indicate that segregated hybridization has occurred. These examples would be classified as a disomy by conventional FISH.
Figure 7. Extended depth of field resolves spot imagery.
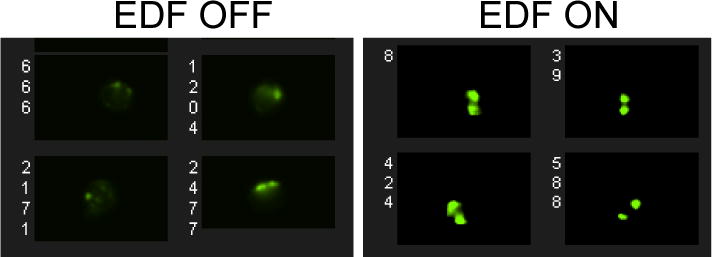
Examples of images acquired with the EDF OFF are shown on the left, and with the EDF ON on the right.
Figure 8.
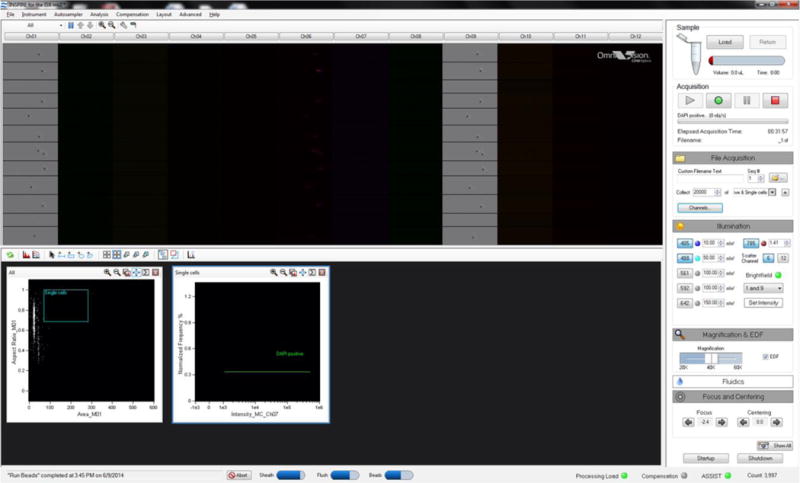
The user interface in the Inspire software of an ImageStreamX Mark-II.
Figure 9. Live gating on the ImageStreamX Mark-II.
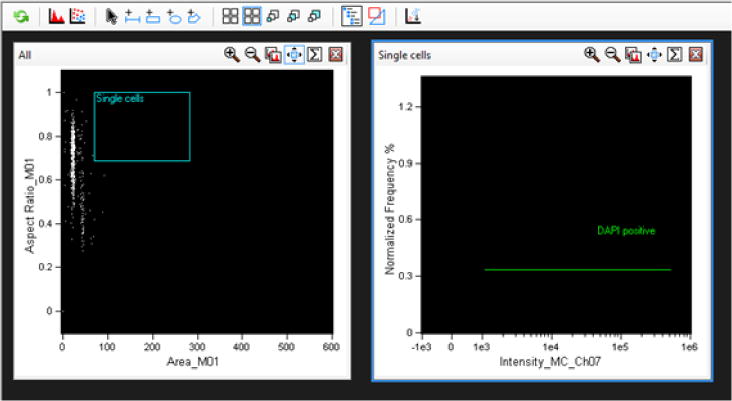
A gate is drawn on an Are versus Aspect ratio of the brightfield image (channel 1) to select single cells, eliminating aggregates, debris, and speed beads (left graph). A histogram of the nuclear dye fluorescence intensity is drawn (channel 7) and a line gate for positive events, i.e., those with a fluorescence intensity of 1000 or higher is selected.
Footnotes
This step should always be performed in a fume hood due to the vapors released and since methanol is flammable and acetic acid is corrosive to skin. Wear appropriate safety equipment including gloves, lab coat, and safety goggles.
Solutions containing BSA should be kept and stored at 4 °C due to the potential for bacterial growth in the protein-containing solution. This is also why the wash buffer should be used within 1 week. To aid prevention of bacterial growth solutions can be sterile filtered to remove contaminants.
Concentrated NaOH (10 N) can be used first to narrow the gap from the starting pH to the required pH. From then on a lower ionic strength should be used (5 N) to avoid a sharp increase in pH above 7.0.
We have found that using SSC buffer more than one week old has negatively affected fluorescent staining of the CEP probes. Buffers can be prepared fresh for each individual experiment if desired.
Sodium heparin tubes are used without bias. It is not expected that the protocol would be affected by the use of other anti-coagulants such as EDTA.
Ficoll-hypaque can be purchased from local suppliers. A protocol for density-gradient centrifugation protocol should be performed according to manufacturer’s instructions. For reference, we use Histopaque®-1077 (Sigma-Aldrich, St. Louis, MO, USA).
We have also used FISH probes supplied by Cytocell, an Oxford Gene Technology company (Tarrytown, NY, USA). These probes are available in FITC or TexasRed.
In this protocol we use the commercially available CEP hybridization buffer (Abbott Molecular). There is no reason to believe efficient hybridization could not be achieved using a home-made buffer. However, it would be essential to optimize the buffer formulation with the hybridization temperature. Changes in formamide concentration will affect hybridization efficiency and melt temperature will need to be altered.
Cell counts in this study were performed using a manual hemocytometer. It is not expected that cell concentrations would differ beyond the normal range using an automated method.
A thermocycler can also be used for incubation steps. However, rigorous testing that the desired hybridization temperature is achieved quickly (within 1 minute) should be performed. Sub-optimal function will negatively affect hybridization efficiency.
ImageStream-100 and ImageStreamX MkII are suitable alternatives. The EDF function is required to accurately distinguish spots (Figure 7). The 40× magnification is standard on the ISX with optional 60× and 20× magnification. Samples can be run at 60× but we have not observed an added advantage of this. We would not recommend using the 20× magnification. The MkII has a slightly different user interface with live gating (Figure 8).
We have found that a fast addition of Fixative solution has had a negative effect on hybridization and acquisition efficiency. Care should be taken at this early stage to ensure a single cell suspension is achieved.
Fixed cells can be stored at least up to 3 months without effecting cellular integrity. Although we have not tested hybridization after 3 months, a loss of hybridization is expected due to DNA degradation over time. Storage at −80 °C may extend the shelf-life of samples further.
One tube PBL contains approximately 2–4 ×10⁷ PBMCs. This protocol is designed to perform 1 test sample. 3 mL fixed cells contains approximately 5×10⁶ cells. Since each hybridization should be performed on 1.5×10⁶ cells, and cells will be lost during processing, the volume washed at this step should be altered as appropriate for your experiment. It is recommended to over-estimate the volume of fixed cells needed if it is possible.
Cells cannot be accurately counted in fixative since it will evaporate so it must be washed out and cells suspended in SSC buffer I before placing on a hemocytometer.
1.5×10⁶ cells are needed for each individual hybridization. The total number of cells placed in a fresh 15mL tube at this step should be altered as appropriate for your experiment.
A small Eppendorf tube is required to ensure small surface area over which hybridization takes place. Any thin-walled 0.5–0.65 mL tube is sufficient, and if a thermocycler is used, cells should be placed in tubes that will fit exactly into each position. Thin-walled tubes are necessary to ensure correct heat distribution during hybridization. 1.5 mL tubes are not recommended for use. 0.2 mL tubes have not been tested.
Removal of supernatant in small tubes should always be performed by aspiration to ensure minimal loss of yield.
Prepare enough hybridization mix for all samples being used in the experiment.
2 μL is the volume of CEP probe recommended by Abbott Molecular, and the optimal volume for CEP 8 from our own titration experiments. Each probe will need to be titrated and the optimal volume used.
40 μL has reproducibly given efficient hybridization. Altering the volume up or down has decreased hybridization efficiency in our hands.
Incubation at 42 °C for between 9–14 hours yields similar results. Above 14 hours and below 9 hours begins to negatively affect hybridization, either by incomplete hybridization, or increase of non-specific background signal.
200 μL SSC Buffer II is needed for each test sample so a sufficient volume of buffer will need to be warmed to 73 °C for all samples in your experiment.
Take note of the change in centrifugation speed at this step. This is to ensure maximum possible yield.
If background signal from non-specific binding of the probe remains after this incubation, alternatively a formamide wash solution (50 % formamide, 2× SSC Buffer) recommended by Abbott Molecular can be used but we have not come across the need to test this.
Resuspension of cells in FBS greatly reduces cell aggregates and results in easier acquisition on the ImageStream. It is not recommended to resuspend cells in 1× PBS.
When using the ISX MkII, live gating is performed. A scatter plot of Area versus Aspect Ratio, with a gate set from 50–250 for Area and 0.7–1 in Aspect ratio will yield a majority of single cells (Figure 9).
With the ISX MkII a histogram of Channel 7 Intensity is made and a gate set to collect all events above 1000 (Figure 9).
Laser intensities should be optimized for your own machine.
20,000 events are usually sufficient but the number of events collected should be increased according to the expected incidence of the target cells when analyzing rare populations.
500 events are probably the minimum required according to our own experience. More events can be collected if desired but it is not necessary.
When using the ISX MkII live gating for compensation is performed.
Single events are required since two cells will lead to over-estimation of spot count. Focused cells are required to accurately detect spots but since cells are acquired with the EDF function most cells will be focused.
As mentioned in the introduction, FISH is used not only for numerical aberrations but also structural aberrations such as translocation abnormalities. FISH determines translocations by dual color co-localization i.e., when BCR is labeled green and ABL labeled red, the BCR/ABL fusion would appear yellow. Since FISH-IS cannot currently distinguish between true fusion events and events captured that are simply in close proximity, it cannot be used for detection of structural aberrations at this time.
It is important to have a control healthy donor sample for each experiment when assessing chromosomal abnormalities to determine the ‘normal’ fluorescence distribution of the signal. Spiking a disomy sample with a monosomy should result in a measurable different distribution with a 2 fold difference in mean fluorescence E.g., taking male and female healthy donor samples and preparing each sample with CEP X will result in controlled monosomies and disomies of X (11).
References
- 1.Garcia-Sagredo JM. Fifty years of cytogenetics: a parallel view of the evolution of cytogenetics and genotoxicology. Biochim Biophys Acta. 2008;1779:363–75. doi: 10.1016/j.bbagrm.2008.05.003. [DOI] [PubMed] [Google Scholar]
- 2.Mrozek K, Heerema NA, Bloomfield CD. Cytogenetics in acute leukemia. Blood Rev. 2004;18:115–36. doi: 10.1016/S0268-960X(03)00040-7. [DOI] [PubMed] [Google Scholar]
- 3.Grimwade D. The clinical significance of cytogenetic abnormalities in acute myeloid leukaemia. Best Pract Res Clin Haematol. 2001;14:497–529. doi: 10.1053/beha.2001.0152. [DOI] [PubMed] [Google Scholar]
- 4.Marcucci G, Mrozek K, Ruppert AS, Archer KJ, Pettenati MJ, Heerema NA, Carroll AJ, Koduru PR, Kolitz JE, Sterling LJ, Edwards CG, Anastasi J, Larson RA, Bloomfield CD. Abnormal cytogenetics at date of morphologic complete remission predicts short overall and disease-free survival, and higher relapse rate in adult acute myeloid leukemia: results from cancer and leukemia group B study 8461. J Clin Oncol. 2004;22:2410–2418. doi: 10.1200/JCO.2004.03.023. [DOI] [PubMed] [Google Scholar]
- 5.Dohner H, Estey EH, Amadori S, Appelbaum FR, Bůchner T, Burnett AK, et al. Diagnosis and management of acute myeloid leukemia in adults: recommendations from an international expert panel, on behalf of the European LeukemiaNet. Blood. 2010;115:453–74. doi: 10.1182/blood-2009-07-235358. [DOI] [PubMed] [Google Scholar]
- 6.Cheson BD, Bennett JM, Kopecky KJ, Büchner T, Willman CL, Estey EH, et al. Revised recommendations of the International Working Group for Diagnosis, Standardization of Response Criteria, Treatment Outcomes, and Reporting Standards for Therapeutic Trials in Acute Myeloid Leukemia. J Clin Oncol. 2003;21:4642–9. doi: 10.1200/JCO.2003.04.036. [DOI] [PubMed] [Google Scholar]
- 7.Balleisen S, Kuendgen A, Hildebrandt B, Haas R, Germing U. Prognostic relevance of achieving cytogenetic remission in patients with acute myelogenous leukemia or high-risk myelodysplastic syndrome following induction chemotherapy. Leuk Res. 2009;33:1189–93. doi: 10.1016/j.leukres.2009.03.004. [DOI] [PubMed] [Google Scholar]
- 8.Sinclair PB, Green AR, Grace C, Nacheva EP. Improved sensitivity of BCR-ABL detection: a triple-probe three-color fluorescence in situ hybridization system. Blood. 1997;90:1395–402. [PubMed] [Google Scholar]
- 9.Campbell LJ, Oei P, Brookwell R, Shortt J, Eaddy N, Ng A, Chew E, Browett P. FISH detection of PML-RARA fusion in ins(15;17) acute promyelocytic leukaemia depends on probe size. Biomed Res Int. 2013;2013:164501. doi: 10.1155/2013/164501. [DOI] [PMC free article] [PubMed] [Google Scholar]
- 10.Buccisano F, Maurillo L, Del Principe MI, Del Poeta G, Sconocchia G, Lo-Coco F, Arcese W, Amadori S, Venditti A. Prognostic and therapeutic implications of minimal residual disease detection in acute myeloid leukemia. Blood. 2012;119:332–41. doi: 10.1182/blood-2011-08-363291. [DOI] [PubMed] [Google Scholar]
- 11.Minderman H, Humphrey K, Arcadi JK, Wierbicki A, Maguire O, Wang ES, Block AW, Sait SN, George TC, Wallace PK. Image cytometry-based detection of aneuploidy by fluorescence in situ hybridization in suspension. Cytometry A. 2012;81:776–84. doi: 10.1002/cyto.a.22101. [DOI] [PMC free article] [PubMed] [Google Scholar]


