Abstract
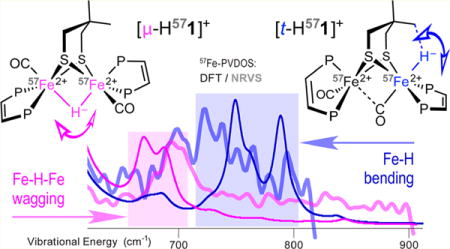
The kinetically robust hydride [t-HFe2(Me2pdt)(CO)2(dppv)2]+ ([t-H1]+) (Me2pdt2− = Me2C-(CH2S−)2; dppv = cis-1,2-C2H2(PPh2)2) and related derivatives were prepared with 57Fe enrichment for characterization by NMR, FT-IR, and NRVS. The experimental results were rationalized using DFT molecular modeling and spectral simulations. The spectroscopic analysis was aimed at supporting assignments of Fe–H vibrational spectra as they relate to recent measurements on [FeFe]-hydrogenase enzymes. The combination of bulky Me2pdt2− and dppv ligands stabilizes the terminal hydride with respect to its isomerization to the 5–16 kcal/mol more stable bridging hydride ([μ-H1]+) with t1/2(313.3 K) = 19.3 min. In agreement with the nOe experiments, the calculations predict that one methyl group in [t-H1]+ interacts with the hydride with a computed CH⋯HFe distance of 1.7 Å. Although [t-H571]+ exhibits multiple NRVS features in the 720–800 cm−1 region containing the bending Fe–H modes, the deuterated [t-D571]+ sample exhibits a unique Fe-D/CO band at ∼600 cm−1. In contrast, the NRVS spectra for [μ-H571]+ exhibit weaker bands near 670–700 cm−1 produced by the Fe–H–Fe wagging modes coupled to Me2pdt2− and dppv motions.
Graphical abstract
INTRODUCTION
Currently the hydrogenases (H2ases) are receiving much interest because these enzymes exhibit unusual and highly efficient pathways for activating and producing H2.1–3 It has been long assumed that all hydrogenases operate via the intermediacy of metal hydrides,4 which are otherwise elusive in nature.5–8 Such intermediates have long been directly detected for the [NiFe]-H2ases.9 For the [FeFe]-H2ases, hydrides were initially spectroscopically implicated by the effect of H/D exchange on νCO bands in the FT-IR spectra.10,11 The terminal hydrides have only recently been detected directly, first in mutant proteins12–14 and more recently in two native proteins (Scheme 1).15
Scheme 1. Proposed Catalytic Cycle of [FeFe]-H2ase Enzymes Including All States That Have Been Identified in Wild-Type Enzymes and the Proposed H2 Adducta,16.
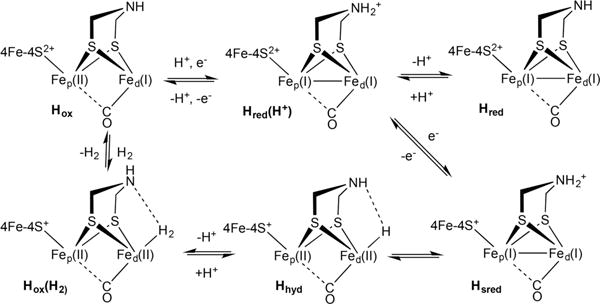
aTerminal CO/CN ligands are omitted for clarity.
For the investigation of iron hydrides, nuclear resonance vibrational spectroscopy (NRVS) is the premier technique14,17 and, in combination with density functional theory (DFT), was central in our recent direct detection of Fe–H-containing intermediates in the [FeFe]-H2ases.14,15
Biomimetic terminal hydrides participate in two reactions that complicate their analysis. When the dithiolate is the azadithiolate (adt) cofactor (or its N-substituted derivatives), the hydride can be reversibly deprotonated by amine. This effect is illustrated by the case of [term-HFe2(adt)-(CO)2(dppv)2]+ (adt = azadithiolate), where the tautomerization is affected by the nature and concentration of the counteranion.18 Regardless of the nature of the dithiolate bridge, terminal Fe–H hydrides tend to isomerize irreversibly to bridging Fe–H–Fe hydrides.1 We sought to suppress this reaction, since these bridging hydrides are not relevant to the biological function of [FeFe]-H2ases.19
Many studies have been reported on diiron dithiolates with “rotated structures”. The rotated motif is readily achieved with mixed-valence Fe(II)Fe(I) complexes, but Fe(I)Fe(I) compounds almost invariably adopt the C2v (idealized) structure (Scheme 2). Fe(I)Fe(I) derivatives can also be stabilized in a rotated geometry using bulky dithiolates such as R2C(CH2S−)2 (R ≠ H).20–23 In this work, we extend that concept, showing that Me2C(CH2S−)2 also stabilizes terminal hydride species, greatly slowing their isomerization to bridging hydrides. This approach worked so well that we proceeded to collect NRVS data on both the terminal and bridging hydrides. These results are relevant to benchmarking recent NRVS results on the enzyme.15
Scheme 2. Compounds of the Type Fe2[(SCH2)2X]L6 Normally Existing as Symmetrical Isomers, with Idealized C2v Structuresa.

aThey distort to rotated structures upon oxidation or, in some cases, with large ligands and bulky dithiolates even in the absence of redox.
A few comments on “flippamers” are required, since this kind of isomerism occurs in compounds discussed in this paper. Flippamers are conformers of the triatomic backbone of 1,3-propanedithiolate and related X(CH2S−)2 bridging ligands in complexes of the type μ-(μ-X(CH2S)2)[FeL3]2. The population of the two flippamers depends on the steric similarity of two FeL3 modules. The flipping rate is fast on the NMR time scale but slow on the EPR and IR time scales.24
RESULTS AND DISCUSSION
Characterization of Fe2(Me2pdt)(CO)2(dppv)2 Using FT-IR and NMR Spectroscopy
UV irradiation of a solution of Fe2(Me2pdt)(CO)4(dppv)20 and dppv efficiently gave Fe2(Me2pdt)(CO)2(dppv)2 ([1]0). This compound was obtained as a dark green solid that is mildly sensitive to air and exhibits good solubility in several organic solvents. The FT-IR spectrum revealed intense νCO bands at 1898 and 1865 cm−1 that match well with those (1888, 1868 cm−1) for Fe2(pdt)-(CO)2(dppv)2 (Figure S2).25
The 1H NMR spectrum of [1]0 shows a methylene signal at δ 1.23, which also matches that for Fe2(pdt)(CO)2(dppv)2. The methyl resonance, a broad singlet, is found at δ −0.15 (Figure S3). In contrast, the two Me resonances from the apical/basal and basal/basal isomers of Fe2(Me2pdt)(CO)4(dppv) absorb at δ 0.98 and 1.08, and the Me resonances of Fe2(Me2pdt)(CO)6 absorb at δ 0.98.20 The upfield shift for the methyl 1H NMR signal [1]0 is attributed to ring current effects resulting from interactions between the methyl groups and the phenyl groups of the ligand.
The room-temperature 31P NMR spectrum of [1]0 consists of a singlet at δ 87.0 (Figure S4). At lower temperatures, this signal splits into two singlets, and below −90 °C these singlets broaden further (Figure S6). However, the signal for the methyl groups remains coalesced even at −90 °C (Figure S5). The chemical shift difference for the 31P NMR signals in the slow exchange limit is δ 13.4, corresponding to 2707 Hz (202 MHz observing frequency). The estimated 1H chemical shift difference between unique methyl signals is 2 ppm, corresponding to 1000 Hz (500 MHz). Therefore, the turnstile rotation of the two Fe(CO)(dppv) centers is slower than the flipping of the [Me2pdt]2− ligand.
Structure of Fe2(Me2pdt)(CO)2(dppv)2
The structure of [1]0, which crystallizes with a disordered molecule of CH2Cl2, was confirmed by X-ray crystallography. The overall structure was similar to that of many Fe2(SR)2L6 compounds with an Fe–Fe bond distance of 2.594(1) Å (Figure 1).1 The crystallographic analysis reveals that the coordination sphere of one Fe is highly distorted. In most compounds of the type Fe2(SR)2L6, terminal ligands on the two Fe centers are eclipsed (i.e., torsion angle of 0°), whereas in [1]0 the Papical–Fe–Fe–Papical torsion angle is 66.43°.26 In the related diiron complex Fe2(Me2pdt)(CO)4(PMe3)2, the Papical–Fe–Fe–Papical torsion angle is 28.9°,21 the smaller angle reflecting the diminished bulk of PMe3. Since the νCO values for [1]0 and Fe2(pdt)-(CO)2(dppv)2 match well,25 the distortion observed in the solid state appears not to predominate in solution.
Figure 1.
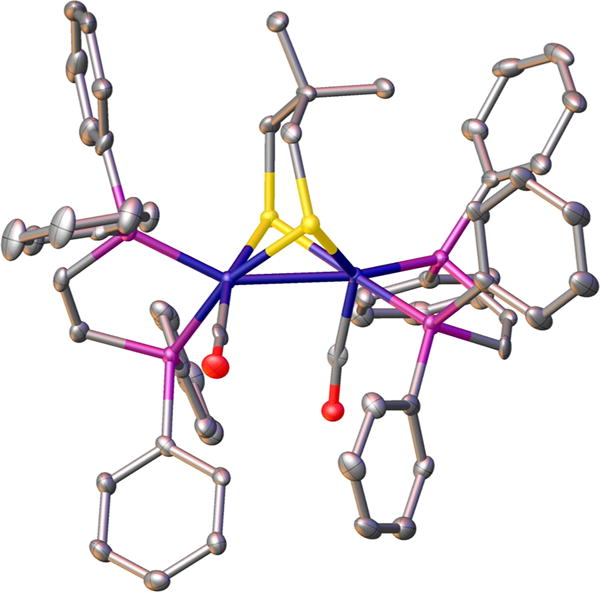
Solid-state structure of Fe2(Me2pdt)(CO)2(dppv)2 ([1]0). Disorder in the phenyl rings and solvent is removed for clarity.
Synthesis of Labeled 57FeFe(Me2pdt)(CO)2(dppv)2
Also prepared in this work were 57Fe-labeled complexes, which are suitable for characterization by 57Fe-NRVS (see below). To conserve on 57Fe, we targeted derivatives of the [H1]+ hydride species where half of the iron was 57Fe (Scheme 3). To prepare such “half-labeled” complexes, a 57Fe(II) dithiolate precursor was condensed with an unlabeled Fe(0) reagent. The ferrous building block 57Fe(Me2pdt)(CO)2(dppv) was prepared in good yield by the reaction of 57FeCl2, dppv, and Li2Me2pdt under an atmosphere of CO. Although Fe(Me2pdt)(CO)2(dppv) has not been reported, the closely related Ph2PC2H4PPh2-containing analogue is known.27 The 31P NMR spectrum indicates a pair of isomers in a ratio of 17:1. The most abundant isomer has trans carbonyls, while the other isomer carbonyls are cis and the diphosphine exhibits two 31P NMR signals (Figure S33). The trans:cis ratio for the related but less bulky species Fe(pdt)(CO)2(dppv) is 4:1.27 The trans isomer is apparently favored by the bulkiness of the Me2pdt2− ligand. IR spectra for 57Fe(Me2pdt)(CO)2(dppv) and Fe(pdt)-(CO)2(dppv) are indistinguishable (Table S1).
Scheme 3. Synthesis of 57FeFe(Me2pdt)(CO)2(dppv)2 ([571]0) and Its Derivativesa.
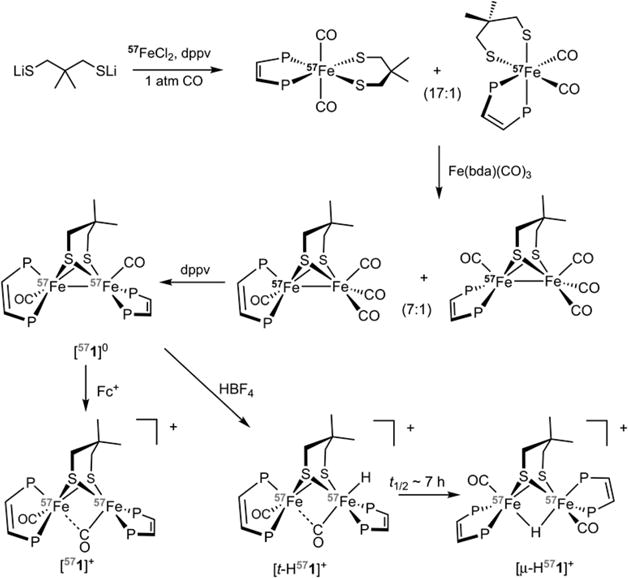
aPh groups on phosphorus are omitted for clarity. The number 57 shown in gray implies 50% 57Fe.
Treatment of 57Fe(Me2pdt)(CO)2(dppv) with Fe(bda)-(CO)328 gave (CO)3Fe(Me2pdt)57Fe(CO)(dppv) (bda = benzylideneacetone). In this diiron compound, dppv remains exclusively coordinated to 57Fe, as revealed by the observation of the doublet J(31P,57Fe) = 50.9 Hz in the 31P NMR spectrum (Figure S36). This result indicates the absence of scrambling of the diphosphine. UV irradiation of a solution of this tetracarbonyl with dppv gave 57FeFe(Me2pdt)(CO)2(dppv)2 ([571]0). The 31P NMR spectrum of [571]0 is characterized by a broad singlet at δ 87.2, which is similar in line shape to that of unlabeled [1]0 (Figure S38).
Electrochemistry of [1]0
Cyclic voltammetry studies on CH2Cl2 solutions of [1]0 show a reversible oxidation at −1.04 V (all potentials are referenced vs Fc+/0, Figure S8). With a redox couple at −0.83 V, Fe2(pdt)(CO)2(dppv)2 is a poorer reductant than [1]0 by ∼210 mV. This trend is consistent with steric stabilization of the oxidized product (see below), whose rotated geometry accommodates one of the methyl groups of the Me2pdt2− ligand. In the case of [Fe2(R2pdt)-(CO)4(PMe3)2]0/+, the effect of pdt2− vs Me2pdt2− is very similar: 240 mV.29
Characterization of [Fe2(Me2pdt)(CO)2(dppv)2]+
Oxidation of [1]0 with FcBF4 (Fc = [Fe(C5H5)2]+) gave the mixed-valence salt [1]BF4 (Figure 2). As for previously reported Fe(II)Fe(I) species, [1]+ is structurally related to the Hox state of [FeFe]-H2ase.12,30–36 [1]BF4 is analogous to [Fe2(pdt)-(CO)2(dppv)2]+.37. Crystallographic characterization of [1]BF4 confirmed that [1]+ adopts the rotated structure characteristic of these mixed-valence species. One CO ligand is semi-bridging, with Fep–C and Fed–C distances of 2.461(2) and 1.790(6) Å, respectively. The dppv bound to the rotated iron occupies dibasal positions, whereas the dppv ligand on the second iron (Fep) occupies an apical-basal configuration, reminiscent of the location of the two donor ligands on the proximal Fe (Fep) in the enzyme. The Fe–P bonds are similar for Fep vs Fed (2.213(2)/2.243(2) Å vs 2.236(2)/2.254(1) Å, respectfully). The crystal structure also reveals an interaction between one of the protons from a methyl group and the Fed (dC–Fe = 2.409 Å), consistent with an anagostic interaction.38
Figure 2.
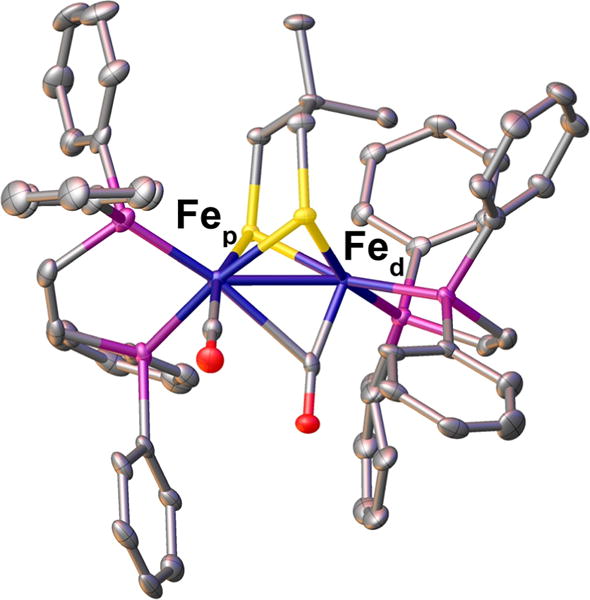
Crystal structure of [Fe2(Me2pdt)(CO)2(dppv)2]BF4 ([1]BF4) with thermal ellipsoids drawn at the 50% probability level. Hydrogen atoms and the counteranion are omitted.
EPR spectra of [1]BF4 as a solution in toluene-THF were recorded at −150 and 30 °C (Figure 3). The low-temperature spectrum is characteristic of an axial symmetry with g = 2.105 and 2.013. For both D. desulfuricans (Dd) H2ase and C. pasteurianum (Cp) H2ase I, g1 = 2.10 was reported, which is very similar to the g1 value for [1]BF4 of 2.105. However, the g3 value of 2.013 for [1]BF4 deviates from the g3 values for Dd H2ase and Cp H2ase I: 1.999 and 2.00, respectively.39 In comparison to other synthetic Hox models, [1]BF4 g values match well with those of [Fe2(pdt)(CO)3(dppv)(Pi-Pr3)]-BF4.30 Hyperfine coupling, assigned to A(31P), is well resolved. In the isotropic spectrum, a triplet is observed at giso = 2.045 with A(31P) = 70 MHz. The hyperfine splitting is consistent with the spin residing on a single Fe(dppv) center. No hyperfine coupling to the dppv on the nonrotated Fe was resolved, consistent with little delocalization.
Figure 3.
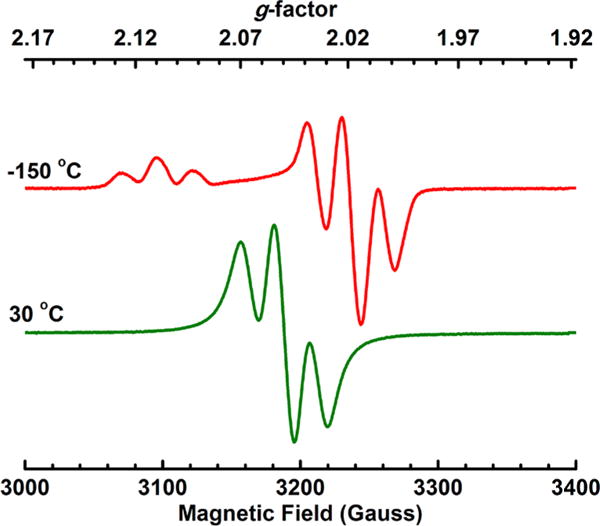
X-band EPR spectrum of [1]BF4 in 1/1 toluene/THF. The top spectrum was recorded at −150 °C and the bottom spectrum at 30 °C.
Characterization of [t-HFe2(Me2pdt)(CO)2(dppv)2]+
Like related diiron(I) complexes,18 [1]0 is protonated by HBF4 to give a hydride complex (Scheme 3). The salt [t-HFe2(Me2pdt)(CO)2(dppv)2]BF4 ([t-H1]BF4) was isolated as a brown-green powder and characterized spectroscopically. Its room-temperature 31P NMR spectrum shows four resonances (Figure S15). Consistent with the low symmetry of the complex, the four resonances indicate apical-basal dppv on the proximal iron and a dibasal dppv on the FeH (Fed) center. The locations of the four phosphine ligands are similar for [1]BF4 and [t-H1]BF4, consistent with a biomimetic relationship between oxidized and protonated states. Solutions of [t-H1]BF4 isomerize, albeit slowly, at room temperature (see the isomerization section). The slowness of this isomerization reflects the effect of steric congestion.40 The nature of the steric congestion was probed by 1D nuclear Overhauser effect (nOe) NMR spectroscopy (Figure 4). Irradiation of the t-H signal at δ−2.23 revealed interactions between the hydride and methyl protons (δ 0.6) and between the hydride and one aryl proton (δ 7.8). Only the axial methyl interacts with the hydride. The DFT-optimized CHMe⋯HtFed distance is ∼1.7 Å. Additionally, the hydride is also close to a pair of aryl protons on the distal dppv; the closest DFT-optimized CHA⋯HtFed distance is ∼2.3 Å (see Figure 6a and further details on the DFT modeling below).
Figure 4.
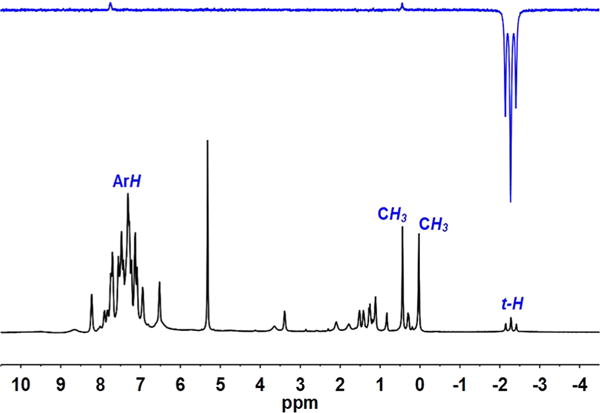
1H NMR spectrum and nOe spectrum of [t-H1]BF4.
Figure 6.
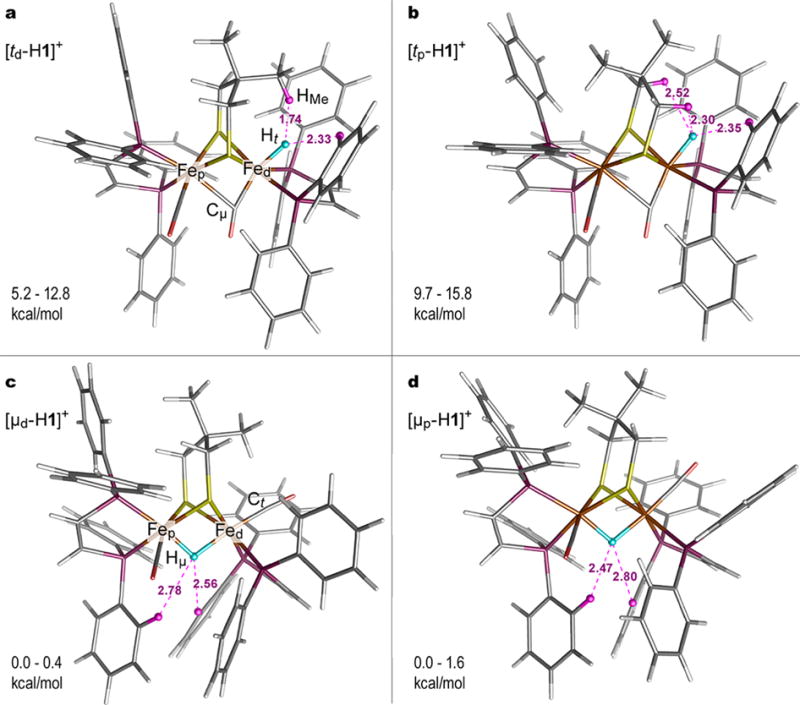
DFT-optimized structures of the terminal (a, b) and bridging (c, d) hydride isomeric species including their d- (a and c) and p- (b and d) flippamer alternatives on the Me2pdt2− bridge conformation. Notations of the species are provided ([td-H1]+, [tp-H1]+, [μd-H1]+, [μp-H1]+). Important atomic labels are provided in (a and c). The Ht/μ hydride site is highlighted as a blue sphere. The CHX⋯Ht/μFed dihydrogen contacts within 3 Å are shown, with HX highlighted as purple spheres. The relative energy ranges provided are based on the values given in Table S3.
Isomerization of [t-HFe2(Me2pdt)(CO)2(dppv)2]BF4
As for all other examples of [t-HFe2(SR)2(CO)6−xLx]+, [t-H1]+ isomerizes irreversibly to a bridging hydride.41 The decay rate follows first-order kinetics (k = 6.0 × 10⁻⁴ s−1) with a half-life of 19.3 min at 40.3 °C (Figure 5). In contrast, the isomerization of the unmethylated analogue [t-HFe2(pdt)(CO)2(dppv)2]+ proceeds with a half-life of minutes at room temperature (k =0.001 s−1).40 These disparate rates correspond to a difference in free energy of activation of about 1 kcal/mol.
Figure 5.
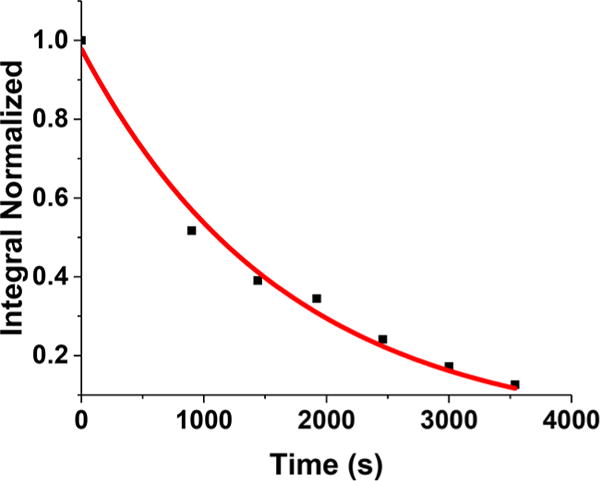
Kinetic trace of [t-H1]+ isomerization to [μ-H1]+ as followed by 31P NMR spectroscopy at 40.3 °C.
The final product of the isomerization of [t-H1]+ is the bridging hydride [μ-H1]+. Throughout the conversion a third hydride was observed, an intermediate in the isomerization. Its chemical shift at δ −3.63 indicates that this intermediate is a terminal hydride.40,42 It is Cs-symmetric, as indicated by two 31P NMR signals (δ 79.9 and 72.7; see Figures S20 and 21). These chemical shifts are consistent with dibasal dppv ligands; in contrast, when dppv spans apical-basal sites, the apical phosphines typically absorb near δ 9040,42). The intermediate is only observed during isomerization but does not accumulate. It thus appears that [t-H1]+ converts to a second terminal hydride ([t-H1′]+), which then converts to the μ-hydride (Scheme 4).
Scheme 4. Proposed Pathway for the Isomerization of [t-HFe2(Me2pdt)(CO)2(dppv)2]BF4 to [μ-HFe2(Me2pdt)(CO)2(dppv)2]BF4a.

aPh groups are omitted for clarity.
Previous DFT analysis indicated that only the Fe with the hydride twists via a Ray–Dutt mechanism to form the μ-hydride.43 Analysis of the isomerization of [t-HFe2(pdt)-(CO)2(dppv)2]+ revealed that the symmetric terminal hydride is approximately 3 kcal/mol higher in energy than the asymmetric analogue.42 Thus, it is proposed that the isomerization starts with a twist at the Fep center to give a Cs-symmetric terminal hydride species. Subsequently, the Fed center rotates to give the μ-hydride. These measurements provide evidence for involvement of the proximal (non-hydride-containing) iron in the isomerization of the hydride. The rotation of the Fed(CO)(dppv)H center shifts the hydride ligand to the bridging site and the dppvd to apical-basal positions.43 By first forming [t-H1′]+, the cation is preorganized to generate the correct isomer of [μ-H1]+, wherein the hydride is trans to a CO ligand, a favored geometry.43 This result implies that the flexibility of Fep influences the isomerization of terminal to bridging hydrides. A similar sequence of events was also seen in [t-HFe2(adt)(CO)2(PMe3)4]+, where the kinetically favored isomer akin to [t-H1]+ converts partially to an all-basal isomer structurally analogous to [t-H1′]+.44
For the purpose of evaluating their vibrational spectra, [t-H571]BF4, [t-D571]O2CCF3, [μ-H571]O2CCF3, and [μ-D571]-O2CCF3 were analyzed. CF3CO2D was selected as a convenient source of D+. Deuteration was incomplete but sufficient for unambiguous assignments.
DFT Modeling of the Structures and Energies of [t-H1]+ and [μ-H1]+
Density functional theory (DFT) was applied to elucidate structures and relative energies of the terminal and bridging hydride species. In the absence of their structural determinations, X-ray data on the similar complex [t-HFe2(adtNH2)(CO)2(dppv)2](BF4)218 has been used to generate starting structures for the models, replacing the NH2 bridgehead to Me2pdt2−. The analysis included the two flippamers30 for the Me2pdt2− bridgehead, denoted respectively as “d/p” depending on its orientation toward either Fed/p. The optimized structures of the 2 × 2 = 4 isomers are shown in Figure 6 and Figure S50 along with their notations used below in the text. Tables S2 and S3 provide the structural parameters of the diiron cores and relative energies.
Several computational schemes predict that the bridging hydride models [μd/p-H1]+ are 5–16 kcal/mol more stable in comparison to the terminal hydride models [td/p-H1]+, regardless of the flippamer (Figure 6 and Table S3). Earlier calculations on [FeFe]-H2ase indicated 8–16 kcal/mol stabilization for the μ-H vs t-H species.15,45,46 Notably, the [td/p-H1]+ models yield metal–ligand distances Fed–Cμ= 1.8 Å and Fep–Cμ = 2.4–2.6 Å, which reproduce the markedly asymmetric character of the semi-bridging CO binding observed in model complexes and [FeFe]-H2ase active site.1 Moderate Fed/p–Hμ distance asymmetries within ∼0.1 Å were obtained for the bridging hydride [μd/p-H1]+ models. For every isomer, the optimization produced two or three CHX⋯Ht/μ < 3 Å interactions involving a hydride, where X implies alternatively alkyl protons of either −CH3 (for [td-H1]+) or −CH2− (for [tp-H1]+) at Me2pdt2− and aryl protons (for all the hydride alternatives [t/μd/p-H1]+) at Ph as shown in Figure 6.
Computational analysis further revealed that the [td-H1]+ flippamer is stabilized by 3–5 kcal/mol in comparison to [tp-H1]+. This stabilization may arise in part from the CHMe·⋯ HtFed ≈ 1.7 Å interaction (Figure 6a). Comparable interactions are invoked in isoelectronic [FeFe]-H2ase models which feature NH⋯HFe distances of 1.4–2.0 Å.1,15 The optimized Fep–Cμ distance is 0.2 Å shorter in [td-H1]+ vs in [tp-H1]+ (Table S2). These calculations highlight the sensitivity of the Fep–Cμ interactions to subtle changes elsewhere in the molecule, as well as to the DFT methodology.14 In contrast to [td/p-H1]+, the flippamers [μd/p-H1]+ of the bridging hydride isomer are predicted to be essentially equal in energy with the calculated energy gaps within 1.6 kcal/mol.
NRVS and DFT Vibrational Characterization of [t-H1]+, [t-D1]+, [μ-H1]+, and [μ-D1]+
With thermally stable 57Fe-labeled terminal diiron hydride and its bridging hydride isomer in hand in the forms of [t-H/D571]+ and [μ-H/D571]+, their 57Fe–H/D vibrational signatures were characterized by 57Fe NRVS.47,48 NRVS, which is sensitive only to the motion of 57Fe nuclei, is presented as 57Fe partial vibrational density of states (PVDOS) spectra. NRVS data collected for the four samples [t-H571]BF4, [t-D571]O2CCF3, [μ-H571]O2CCF3, and [μ-D571]-O2CCF3 (Figure 7a,d and Figure S51a–d) were interpreted using DFT-calculated 57Fe-PVDOS spectra (Figure 7b,e and Figure S51a–d). The analysis is facilitated by plotting the contributions of hydride vs deuteride to the normal mode energies, provided in Figures 7c,f and Figure S52b as DFT-based Ht/μ/Dt/μ-PVDOS. Normal modes having significant H/D-PVDOS are marked in Figure 7c,f and shown in Figure 8 in arrow-style representations.
Figure 7.
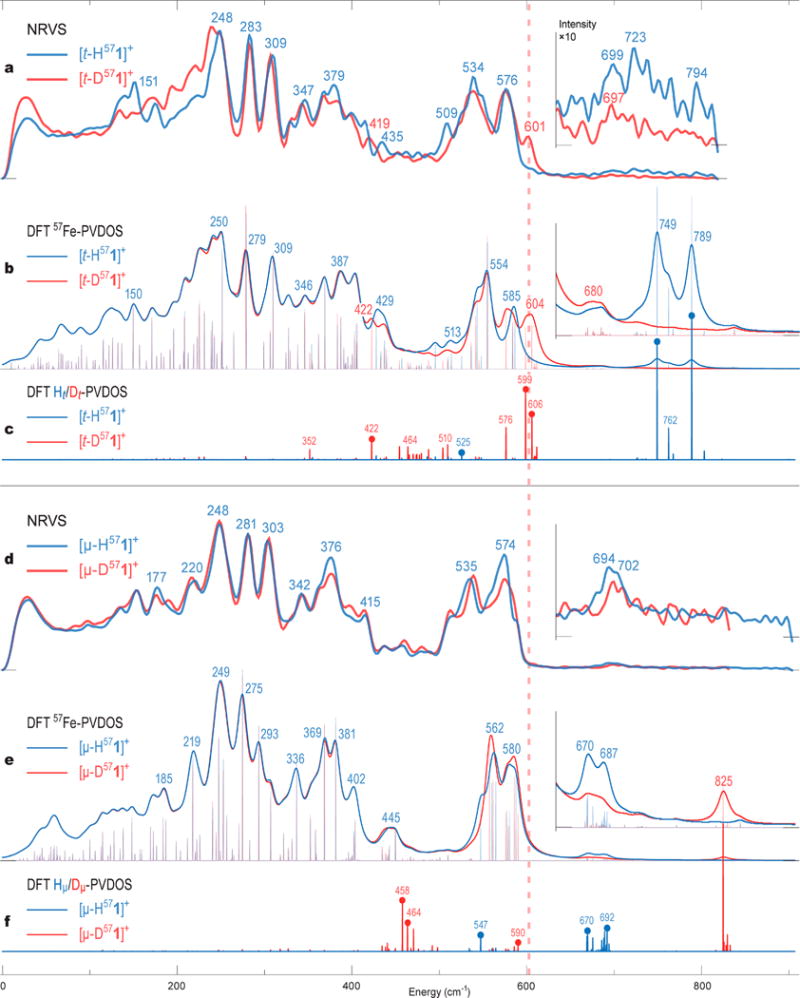
57Fe-PVDOS vibrational spectra for the H/D variants (correspondingly in blue/red) of the terminal [t-H/D571]+ (upper panel, a, b) and bridging [μ-H/D571]+ (lower panel, d, e) hydride species characterized by NRVS experiments (a, d) and DFT calculations (b, e). The ×10 intensity insets display the spectra >620 cm−1. DFT-based stick-style spectra show PVDOS for the terminal Ht/Dt (c) and bridging Hμ/Dμ (f) hydrides and 2 × 57Fed/p (d, e) iron nuclei. The dashed vertical line at ∼600 cm−1 indicates the key difference between the [t-D571]+ and [μ-D571]+ spectra as explained in the text. The labels (cm−1) indicate band positions (a, b, d, e) or individual normal-mode frequencies (c, f). Mode positions marked with thick dots (c, f) correspond to significant H−/D− hydride motions; arrow-style molecular representation of these modes is available in Figure 8. See Figure S51 for alternative spectra arrangement and also DFT 57Fe-PVDOS for the d/p-conformers of the Me2pdt2− bridge.
Figure 8.
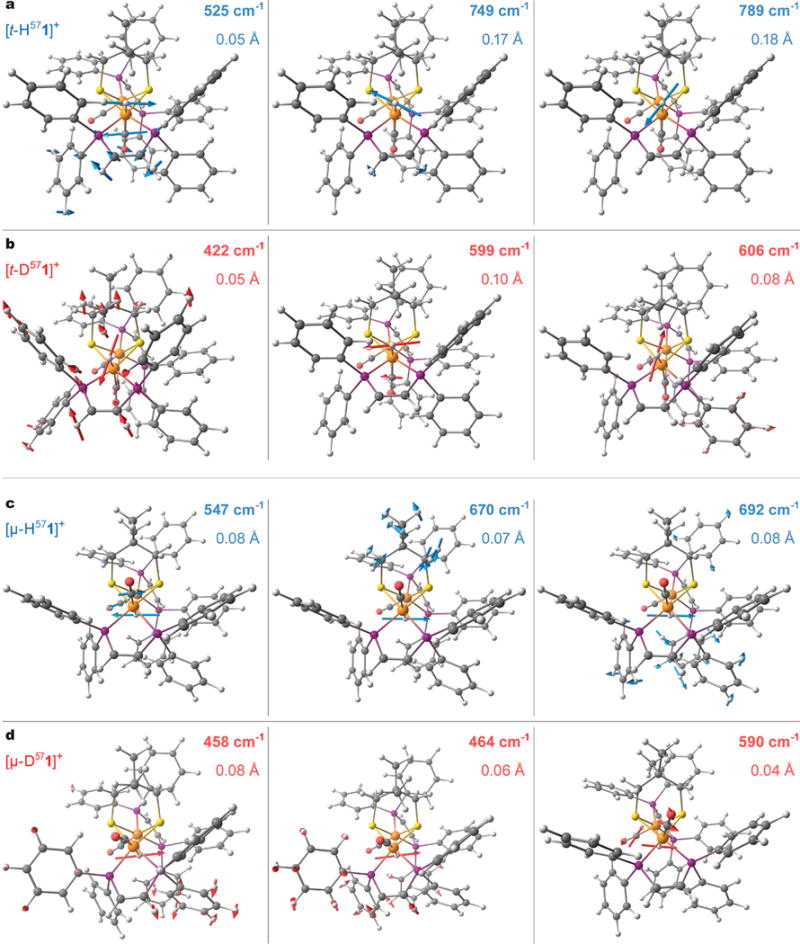
Arrow-style molecular representation of selected normal modes having significant hydride motion character in the best-fit DFT models for the H/D variants of the terminal [t-H/D571]+ (a, b) and bridging [μ-H/D571]+ (c, d) hydride species. Red/blue coloring of labels and arrows corresponds to the H−/D− hydride isotope alternatives. The computed mode frequencies (cm−1) and the H/Dt/μ hydride nuclei displacement amplitudes (Å) are given. The same modes are marked in the H/D-PVDOS spectra in Figure 7c,f. For these and other vibrational modes animated, see the Supporting Information.
Weak 57Fe motion and higher frequencies make Fe–H vibrational modes particularly difficult to observe. Additional challenging factors for NRVS presently included (i) only 50% enrichment with 57Fe which effects in higher noise level and (ii) incomplete deuteration (see above). The DFT analysis considered the two Me2pdt2− d/p-flippamer alternatives for both [t-H571]+ and [μ-H571]+. Here, we restricted our attention to the ∼600–800 cm−1 “active window”, mostly exclusive to the low-intensity NRVS bands based in the δ(57Fe–H/D) bending (δ) vibrations.
As seen in NRVS studies of related complexes,12,14,15,17,49–54 the spectra exhibit intense bands associated with mixed 57Fed/p-S/P/C modes <470 cm−1 and ν/δ(Fed/p-CO) stretching (ν) and bending (δ) modes in the ∼500–600 cm−1 region. These higher intensity NRVS bands <600 cm−1, dominated by motions of the 57Fe ligands heavier than hydrides, are discussed in the Supporting Information.
NRVS spectra for [t-H571]+ exhibit multiple features in the 700–800 cm−1 region (Figure 7a), where our DFT calculations on [td-H571]+ predict two well-defined δ(Fed-Ht) modes at 749 and 789 cm−1 (Figures 7b,c and 8a) and Ht moves in two perpendicular directions; these modes bear both similarity to and difference from the 57Fed–H bends characterized recently in [FeFe]-H2ases (see Figure S53 and supplementary discussions in the Supporting Information).14,15,55 However, the relative [t-H571]+ vs [t-D571]+ intensity levels observed in this region are indicative of the isotope sensitivity, and regional maxima at 723 (NRVS) vs 749 cm−1 (DFT) match their intensities relatively well. The situation is quite different for [t-D571]+, producing a band at 601 cm−1 which is missing in the spectrum of [t-H571]+ (Figure 7a). The DFT-calculated 57Fe-PVDOS for [td-D571]+ predicts a matching band at 604 cm−1 produced by modes at 599 and 606 cm−1, resulting from the coupled δ(Fed–Dt)/δ(Fe–CO) bending motions (Figures 7b,c and 8b). The δ(Fe–D)/δ(Fe–CO) coupling is responsible for significant amplification of otherwise pure δ(Fe–D) mode intensities and is well-known to enhance the diagnostic power of NRVS on iron hydrides.14,15,54 In contrast with the 604 cm−1 band produced by [td-D571]+, DFT modeling for another [tp-D571]+ flippamer produces an additional band at 621 cm−1 which does not fit the experiment (Figure S51b). Among the two flippamer alternatives, the [td-D571]+ modeling clearly provides a better fit to the observed NRVS data and therefore the d-flippamer spectra were used as representative in Figure 7b; importantly, this preference is consistent with the computed [td/p-H571]+ relative energies favoring [td-H571]+ and the nOe experimental results on [t-H571]+ (see the previous sections and Table S3). Interestingly, in spite of the tight CHMe⋯HtFed ≈ 1.7 Å dihydrogen contact achieved in [td-H571]+ (Figure 6a), this interaction does not yield any significant vibrational coupling between the HMe and Ht nuclei (see Figures S52b,c and S53 and supplementary discussions in the Supporting Information).
For the bridging hydride complex, a doublet feature is observed at 694/702 cm−1 in the spectrum of [μ-H571]+ (Figure 7d). A similar doublet feature is calculated at 670/687 cm−1 for [μp-H571]+ (Figure 7e). Mixed ω(Fed–Hμ–Fet) out-of-plane bending, or wagging (ω), modes absorb at these energies: see e.g. the calculated modes at 670 and 692 cm−1 indicated in Figure 7f and shown in Figure 8c. In contrast, [μd-H571]+ modeling produces a relatively pure ω(Fed–Hμ–Fet) wag at 724 cm−1 (Figure S51c), which is not consistent with the observed spectra. The DFT spectra for the bridging hydride species in Figure 7e therefore assumed the presence of the p-flippamer absorbing in the ∼600–800 cm−1 “active window” (see the Supporting Information for an extended discussion).
The [μp-D571]+ model produces a red-shifted ω(Fed–Dμ–Fep) wag at 590 cm−1 (Figures 7f and 8d), having vibrational energy similar to that of the δ(Fed–Dt) bends from the [td-D571]+ model as discussed above. The ω(Fed–Hμ/Dμ–Fep) wags, however, contain much less H−/D− vibrational energy (Figure 7c,f) and show smaller H−/D− displacements (Figure 8) in comparison to the δ(Fed–Ht/Dt) bends, and therefore Hμ− to Dμ− exchange introduces only a minor perturbation of the δ(Fe–CO) bands for the bridging hydride isomer (Figure 7d,e). DFT rationalizes this behavior as respectively stronger vs weaker involvement of the 57Fe nuclei in the δ(Fed–Ht/Dt) bending vs ω(Fed–Hμ/Dμ–Fep) wagging motion, consistent with ∼0.2 Å shorter Fe–H distances in [t-H1]+ vs [μ-H1]+ (Table S2). Calculations therefore rationalize the well-defined NRVS modification between the terminal and bridging species as exposed by the H− to D− isotope exchange, which is marked by a dashed red line at ∼600 cm−1 in Figure 7.
Figure 7d reveals overlapping [μ-H571]+ and [μ-D571]+ NRVS features at 694/702 cm−1, consistent with the [μ-D571]O2CCF3 sample contamination by [μ-H571]O2CCF3 as quantified by 1H NMR (see above). The corresponding 670–690 cm−1 doublet features from the DFT modeling of the pure species are however not completely eliminated by the H/D isotope exchanges regardless of the flippamers: see Figure 7b,e and Figure S51a–d. The calculations indicate that these bands, protruding into the δ(57Fe–H) “active window”, are produced by many mixed modes of Me2pdt2−, dppv, and aryl molecular fragments. These modes overlap with the hydride motion only in [μp-H571]+ (see the 670 and 692 cm−1 modes indicated in Figure 7f and shown in Figure 8c and also the discussion on ω(Fed–Hμ–Fep) above).
CONCLUSIONS
In this work, a sterically congested diiron hydride complex was prepared as a model for a diferrous hydride state of the [FeFe]-hydrogenases. The steric effects were introduced by combining a pair of dppv ligands and 2,2-dimethylpropane-1,3-dithiolate. The preparative methods were adapted to allow introduction of 57Fe for NRVS analysis. The considerable steric effects are manifested at many stages in the chemistry: ring current effects are seen in the 1H NMR spectrum of [1]0, the 210 mV greater reducing power for [1]0, the enhanced stability of [1]+, the nOe interaction between the hydride, dithiolate, and diphosphine in [t-H1]+, the slow isomerization of [t-H1]+, and the detection of its second isomer [t-H1′]+. The last species served as a precursor to the bridging hydride [μ-H1]+ isomer, predicted by DFT to be 5–16 kcal/mol more stable than [t-H1]+.
Owing to their thermal stability, the salts of respectively [t-H571]+ and [μ-H571]+ are well suited for their comparative assessment by NRVS spectroscopy. The Fe–H/D NRVS bands in the ∼600–800 cm−1 “active window”, in spite of their inherently low intensities, reveal important chemical information when they are rationalized by DFT modeling. The combined application of NRVS and DFT clearly discriminated between the terminal vs bridging hydride isomeric species that differ by the first-shell ligand arrangement in the diiron core. The 720–800 cm−1 bands produced by two perpendicular bending δ(Fe–H) motions in [t-H571]+ are twice as intense as the 670–700 cm−1 bands produced by wagging ω(Fe–H–Fe) motion in [μ-H571]+. For the deuteride samples, the higher NRVS intensity δ(Fe–CO) bands at ∼600 cm−1 are noticeably perturbed in [t-D571]+ but not in [μ-D571]+. Analogous NRVS fingerprints supported our assignment of the catalytic Hhyd state in [FeFe]-H2ase to the terminal Fed(II)–H hydride species (see ref 15; specifically, Figure S15). The δ(Fe–H) NRVS bands around 750 cm−1 have been indicated in Hhyd as well by an independent DFT modeling.55 Using techniques different from NRVS, others proposed bridging hydrides (Fep–H–Fed) for the Hsred and Hred states.7,19
Analysis of the δ(Fe–H/D) and ω(Fe–H/D–Fe) bands for [t-H/D571]+ and [μ-H/D571]+ gave insights into the orientation of the Me2pdt2− bridge. The 57Fe-PVDOS spectral signatures for the terminal vs bridging hydride isomers are distinctive because of the presence or absence of HX⋯Ht/μ interactions. From the NRVS data, one can infer a considerable level of structural insight. Consistent with the NRVS and nOe experiments rationalized by the DFT calculations, a closed CHMe⋯HtFed ≈ 1.7 Å contact is stabilized in the best-fit conformer of [t-H1]+. The CHMe⋯HtFed interaction is reminiscent of the NH⋯HFed ≈ 2.0 Å dihydrogen interaction characterized recently for the Hhyd hydride state of [FeFe]-H2ase.15 In contrast to [t-H1]+, the dihydrogen interaction in the catalytic Hhyd state additionally exhibits vibrational coupling between the two H nuclei.
EXPERIMENTAL SECTION
Reactions and manipulations were performed using standard Schlenk techniques or in a nitrogen atmosphere glovebox. HPLC-grade solvents were dried by filtration through activated alumina or distilled under nitrogen over an appropriate drying agent and then used. ESI-MS data for compounds were acquired using a Waters Micromass Quattro II spectrometer. 1H NMR (500 MHz) and 2H NMR (600 MHz) spectra were referenced to residual solvent relative to TMS. 31P{1H} NMR (202 and 242 MHz) spectra were referenced to external 85% H3PO4. Chemical shifts are reported for room temperature in the δ scale. FT-IR spectra were recorded on a PerkinElmer 100 FT-IR spectrometer. Crystallographic data for compounds [1]0 and [1]BF4 were collected using a Siemens SMART diffractometer equipped with a Mo Kα source (λ = 0.71073 Å). cis-1,2-Bis(diphenylphosphino)ethylene (dppv) and HBF4·Et2O solution were purchased from Aldrich. The compounds Me2pdtH2,56 Fe2(Me2pdt)(CO)6, and Fe2(Me2pdt)(CO)4(dppv) were prepared according to literature procedures.20,29
Fe2(Me2pdt)(CO)2(dppv)2 ([1]0)
Method 1
A mixture of Fe2(Me2pdt)(CO)4(dppv) (113 mg, 0.15 mmol) and dppv (60 mg, 0.15 mmol) was dissolved in 100 mL of toluene in a Pyrex Schlenk tube. The reaction mixture was irradiated with a 100 W UV immersion lamp (λ = 356 nm, Spectroline) until the reaction was complete (∼25 h) as indicated by FT-IR spectroscopy. After the solvent was removed under vacuum, the residue was extracted into 5 mL of CH2Cl2. The filtered extract was layered with 50 mL of pentane, and this mixture was stored at −35 °C overnight. The product was precipitated as a greenish black solid. Yield: 103 mg (63%). 1H NMR (500 MHz, CD2Cl2): δ 7.71–7.27 (m, 44H, C6H5 and =CH), 1.33–1.25 (m, 4H, SCH2), −0.19 (br s, 6H, CH3). 31P{1H} NMR (CD2Cl2): δ 87.2. FT-IR (CH2Cl2): νCO 1898 (vs), 1865 (vs) cm−1. ESI-MS: m/z 1094.1 [M]+ (calcd 1094.1). Anal. Calcd for C59H54Fe2O2P4S2·2CH2Cl2 (found): C, 57.93 (58.08); H, 4.62 (4.64).
Method 2
A solution of Fe2(Me2pdt)(CO)6 (83 mg, 0.20 mmol) and dppv (158 mg, 0.40 mmol) in 100 mL of dry toluene was irradiated with an LED lamp (λ = 356 nm). The reaction was complete in ∼7 h, as indicated by FT-IR spectroscopy. Solvent was removed under vacuum, and the residue was extracted into 5 mL of CH2Cl2. The filtered extract was layered with 100 mL of hexane, and the mixture was allowed to stand at −35 °C overnight. The product precipitated as a greenish black solid. Yield: 170 mg (78%).
[Fe2(Me2pdt)(CO)2(dppv)2]BF4 ([1]BF4)
A dark green solution of Fe2(Me2pdt)(CO)2(dppv)2 (33 mg, 0.030 mmol) in 2 mL of CH2Cl2 was treated at −40 °C with FcBF4 (9 mg, 0.033 mmol) in 3 mL of CH2Cl2. The reaction mixture was stirred at −40 °C until the reaction was complete (5 min) as indicated by FT-IR spectroscopy. The resulting solution was then layered with 25 mL of hexane, which was allowed to stand at −35 °C overnight. The product precipitated as blue-black needlelike crystals. Yield: 27 mg (77%). FT-IR (CH2Cl2): νCO 1952 (vs), 1854 (s) cm−1. 1H NMR (500 MHz, CD2Cl2): δ 9.40–6.80 (m, 55H, C6H5, Ph2PCH=CHPPh2), 1.26 (m, 4H, 2 × SCH2), −2.07 (br s, 6H, 2 × CH3). Anal. Calcd for C59H54BF4Fe2O2P4S2·CH2Cl2 (found): C, 56.9 (57.22); H, 4.46 (4.43).
[(t-H)Fe2(Me2pdt)(CO)2(dppv)2]BF4 ([t-H1]BF4)
A dark green solution of Fe2(Me2pdt)(CO)2(dppv)2 (33 mg, 0.030 mmol) in 5 mL of CH2Cl2 was treated at 0 °C with HBF4·Et2O (6.3 μL, 0.045 mmol). This species was not formed when THF was used as the solvent. The reaction mixture was stirred at 0 °C until the reaction was complete (10 min) as indicated by FT-IR spectroscopy. The resulting solution was then layered with 50 mL of hexane, which was allowed to stand at −35 °C overnight. The product, a greenish black solid, was stored at −35 °C in the glovebox. Yield: 15 mg (42%). 1H NMR (500 MHz, CD2Cl2): δ 8.22–6.73 (m, 44H, C6H5 and =CH), 1.59–1.27 (m, 4H, SCH2), 0.50, 0.03 (s, s, 6H, CH3), −2.23 (t, JPH = 81 Hz, 1H, (t-H)Fe). 31P{1H} NMR (CD2Cl2, 20): δ 95.3 (s), 87.2 (s), 80.4 (s), 68.7 (s). FT-IR (CH2Cl2): νCO 1964 (vs), 1889 (s) cm−1. ESI-MS: m/z 1095.1 [M − BF4]+ (calcd 1095.1). Anal. Calcd for C59H55BF4Fe2O2P4S2·2.5CH2Cl2 (found): C, 52.95 (53.01); H, 4.34 (4.38).
[(μ-H)Fe2(Me2pdt)(CO)2(dppv)2]BF4 ([μ-H1]BF4)
A dark green solution of Fe2(Me2pdt)(CO)2(dppv)2 (44 mg, 0.040 mmol) in 5 mL of CH2Cl2 was treated at room temperature with HBF4·Et2O (8.4 μL, 0.060 mmol). The reaction mixture was stirred at room temperature until the reaction was complete (∼41 h) as indicated by FT-IR spectroscopy. After the solvent was removed, the residue was washed with 2 × 10 mL of Et2O and dried under vacuum. The product was obtained as a brown-red solid. Yield: 35 mg (72%). 1H NMR (500 MHz, CD2Cl2): δ 8.08–6.67 (m, 44H, C6H5 and =CH), 2.57–1.37 (m, 4H, SCH2), 1.15, 0.20 (s, s, 6H, CH3), −14.70 (m, 1H, Fe(μ-H)Fe). 31P{1H} NMR (CD2Cl2, 20 °C): δ 86.8 (s), 81.3 (s), 78.5 (s), 72.5 (s). FT-IR (CH2Cl2): νCO 1974 (broad), 1952 (vs) cm−1. ESI-MS: m/z 1095.3 [M − BF4]+ (calcd 1095.1). Anal. Calcd for C59H55BF4Fe2O2P4S2·1.5CH2Cl2 (found): C, 55.47 (55.73); H, 4.46 (4.85). The isomerization of [t-H1]+ to [μ-H1]+ was followed at 40.3 °C using 31P NMR spectroscopy. Tri-p-tolylphosphine was used as an integration standard.
[(t-D)Fe2(Me2pdt)(CO)2(dppv)2]BF4 ([t-D1]BF4)
A dark green solution of Fe2(Me2pdt)(CO)2(dppv)2 (55 mg, 0.050 mmol) in 5 mL of CH2Cl2 was treated at 0 °C with D2O (9.0 μL, 0.050 mmol) followed by HBF4·Et2O (11.0 μL, 0.075 mmol). The reaction mixture was stirred at 0 °C until the reaction was complete (10 min) as indicated by FT-IR spectroscopy. The resulting solution was then layered with 50 mL of Et2O, which was allowed to stand at −35 °C overnight. The product precipitated as a greenish black solid and was stored at −35 °C in the glovebox. Yield: 35 mg (59%). The deuteration was incomplete, as indicated by a small t-H signal at δ −2.23. 1H NMR (500 MHz, CD2Cl2): δ 8.22–6.73 (m, 44H, C6H5 and =CH), 1.57–1.27 (m, 4H, SCH2), 0.49, 0.02 (s, s, 6H, CH3), −2.23 (t, JPH = 80 Hz, 0.3H, (t-H)Fe). 2D NMR (600 MHz, CH2Cl2): δ −2.14 (t, JPD = 12.4 Hz, (t-D)Fe). 31P{1H} NMR (CD2Cl2): δ 95.2 (s), 87.3 (2 × br d), 80.6 (2 × br d), 68.7 (s). FT-IR (CH2Cl2): νCO 1964 (vs), 1890 (s) cm−1. ESI-MS: m/z 1096.2 [M − BF4]+ (calcd 1096.2).
[(μ-D)Fe2(Me2pdt)(CO)2(dppv)2]BF4 ([μ-D1]BF4)
A dark green solution of Fe2(Me2pdt)(CO)2(dppv)2 (33 mg, 0.030 mmol) in 5 mL of CH2Cl2 was treated at room temperature with D2O (5.4 μL, 0.300 mmol) followed by HBF4·Et2O (12.6 μL, 0.090 mmol). The mixture was stirred at room temperature until the reaction was complete (∼52 h) as indicated by FT-IR spectroscopy. The resulting solution was then layered with 25 mL of hexane, which was allowed to stand at −35 °C overnight. The product was obtained as a brown-red solid. Yield: 20 mg (56%). The deuteration was not fully complete, as indicated by a small μ-H signal at δ −14.8. 1H NMR (500 MHz, CD2Cl2): δ 8.08–6.68 (m, 44H, C6H5 and =CH), 260–1.37 (m, 4H, SCH2), 1.15, 0.21 (s, s, 6H, CH3), −14.74 (m, 0.3H, Fe(μ-H)Fe). 2D NMR (600 MHz, CH2Cl2): δ −14.8 (s, Fe(μ-D)Fe). 31P{1H} NMR (CD2Cl2): δ 86.8 (s), 81.2 (s), 78.4 (2 × br s), 72.5 (s). FT-IR (CH2Cl2): νCO 1974 (broad), 1952 (vs) cm−1. ESI-MS: m/z 1096.1 [M − -BF4]+ (calcd 1096.1).
57FeCl2
To a solution of 57Fe powder (250 mg, 4.39 × 10⁻³ mol) in MeOH (1.6 mL) was added concentrated HCl (12 M, 1.6 mL, 1.92 × 10⁻² mol). The reaction mixture was stirred under nitrogen at room temperature for 2 h. The solvent was then removed under vacuum. The residual white powder was dried further by heating under vacuum overnight. The product was used without purification. Yield: 544 mg (97%).
57Fe(Me2pdt)(dppv)(CO)2
A 100 mL Schlenk flask, equipped with a magnetic stir bar, was charged with 57FeCl2 (544 mg, 4.25 × 10⁻³), dppv (1.69 g, 4.25 × 10⁻³), and THF (30 mL). The reaction mixture was placed under an atmosphere of CO, and the reaction mixture was stirred at room temperature for 2 h. A solution of Me2C(CH2SLi)2 (4.25 × 10⁻³ mol) in THF (10 mL) was generated by treating Me2C(CH2SH)2 (576 mg, 4.25 × 10⁻³ mol) with 4.25 mL of a 1 M solution of BuLi in hexane. This mixture was diluted with MeOH (10 mL) before cannula-transferring to the 57FeCl2/dppv mixture. The mixture was stirred at room temperature for 12 h. A dark red, heterogeneous solution formed. The solvents were removed under vacuum, and the residual solid was purified by column chromatography. Elution with CH2Cl2 gave a yellow band that was discarded. Subsequent elution with a 5/1 mixture of CH2Cl2 and Et2O gave a red band containing the product. Yield: 719 mg (26%). IR (CH2Cl2): νCO 2014, 1975 cm−1. 31P{1H} NMR (CD2Cl2): δ 86.1 (dd, J = 35.8, 21.6 Hz), 79.7 (d, J(57Fe) = 38.5 Hz) 59.8, (dd, J = 35.4, 21.6 Hz); ratio 1:17:1. 1H NMR (500 MHz, CD2Cl2): δ 7.96 (d, J = 11.3 Hz, 1H), 7.87 (d, J = 10.7 Hz, 1H), 7.72–7.63 (m, 6H), 7.44 (q, J = 7.7 Hz, 10H), 2.19 (m, 4H), 0.98 (m, 6H).
(dppv)(CO)57Fe(μ-Me2pdt)Fe(CO)3
A toluene (25 mL) solution of 57Fe(Me2pdt)(dppv)(CO)2 (719 mg, 1.12 × 10⁻³ mol) was treated with a toluene solution of Fe(bda)(CO)328 (322 mg, 1.12 × 10⁻³ mol). The reaction mixture was stirred at room temperature for 16 h, at which point IR spectroscopy indicated that the reaction was complete. The solution was filtered through Celite, and the solvent was removed under vacuum. The residual solid was rinsed with pentane (3 × 10 mL) and dried under vacuum. Yield: 706 mg (87%). IR spectrum (CH2Cl2): νCO 2022, 1953, 1913 cm−1. 31P{1H} NMR (CD2Cl2): δ 92.83 (d, J(57Fe) = 50.9 Hz), 79.92 (m); ratio 1:0.6. 1H NMR (500 MHz, CD2Cl2): δ 8.16–7.88 (overlapping signals, 4H), 7.78 (m, 1H), 7.67 (m, 1H), 7.57–7.10 (overlapping signals, 16H), 1.72 (m, 2H), 1.29 (m, 2H), 1.08 (s, 3H), 0.09 (s, 3H).
(dppv)(CO)57Fe(μ-Me2pdt)Fe(CO)(dppv) ([571]0)
A mixture of (dppv)(CO)57Fe(μ-Me2pdt)Fe(CO)3 (120 mg, 1.65 × 10⁻⁴ mol) and dppv (66 mg, 1.65 × 10⁻⁴ mol) in toluene (100 mL) was irradiated with 356 nm light (LED, 350 mA/m2). Reaction progress was monitored by IR spectroscopy. After 6 h, irradiation was stopped, and the solvent was removed under vacuum. The crude product was dissolved in a minimum amount of CH2Cl2. This extract was layered with pentane, and the mixture was stored at −35 °C overnight. Dark green crystals formed. Yield: 146 mg (83%). FT-IR (CH2Cl2): νCO 1974, 1952, 1897, 1865 cm−1. 31P{1H} NMR (CD2Cl2): δ 87.21 (br s). 1H NMR (500 MHz, CD2Cl2): δ 8.13–7.56 (br s, 10H), 7.56–6.72 (broad, overlapping signals, 34H), 1.29 (m, 4H), −0.15 (br s, 6H).
57Fe-Labeled [(t-H)Fe2(Me2pdt)(CO)2(dppv)2]BF4 ([t-H571]BF4)
A CH2Cl2 solution of (dppv)(CO)57Fe(μ-Me2pdt)Fe-(CO)(dppv) (63.4 mg, 5.78 × 10⁻⁵ mol) was treated with HBF4·Et2O (7.9 μL, 9.4 mg, 5.78 × 10⁻⁵ mol) at room temperature. A color change from green to green-brown was observed. Solvent was removed under vacuum, and the residual solid was rinsed with THF and Et2O. Yield: 30 mg (44%). 31P{1H} NMR (CD2Cl2): δ 95.3 (br s, 1P), 87.3 (br s, 1P), 80.5 (br s), 68.8 (br s, 1P). 1H NMR (500 MHz, CD2Cl2): δ 8.68–6.37 (overlapping signals, 44H), 1.59 (m, 2H), 1.30 (m, 2H), 0.53 (s, 3H), 0.05 (s, 3H), −2.20 (t, J = 81 Hz, 1H). 1H NMR analysis of the sample for NRVS revealed a small signal at δ −14.7 corresponding to the presence of ∼13% of [μ-H571]BF4 in this sample (Figure S43).
57Fe-Labeled [(t-D)Fe2(Me2pdt)(CO)2(dppv)2]O2CCF3 ([t-D571]O2CCF3)
A CH2Cl2 solution of (dppv)(CO)57Fe(μ-Me2pdt)-Fe(CO)(dppv) (63.4 mg, 5.78 × 10⁻⁵ mol) was treated with CF3CO2D (4.7 μL, 6.6 mg, 5.78 × 10⁻⁵ mol). A color change from green to green-brown was observed. Solvent was removed under vacuum, and the residual solid was washed with THF and Et2O. Yield: 40 mg (58%). 31P{1H} NMR (CD2Cl2): δ 95.3 (br s, 1P), 87.3 (br s, 1P), 80.5 (br s), 68.8 (br s, 1P). 1H NMR (500 MHz, CD2Cl2): δ 8.68–6.37 (overlapping signals, 44H), 1.59 (m, 2H), 1.30 (m, 2H), 0.53 (s, 3H), 0.05 (s, 3H).
57Fe-Labeled [(μ-H)Fe2(Me2pdt)(CO)2(dppv)2]BF4/O2CCF3 ([μ-H571]O2CCF3) and [(μ-D)Fe2(Me2pdt)(CO)2(dppv)2]O2CCF3 ([μ-H571]O2CCF3)
Solutions of [t-H571]O2CCF3 and [t-D571]O2CCF3 in 2–4 mL of CH2Cl2 were stirred until the IR spectrum showed complete conversion to [μ-H571]+ and [μ-D571]+, respectively. The appearance of an IR band at 1855 cm−1 in the spectra of [μ-H571]O2CCF3 and [μ-D571]O2CCF3 indicates the presence of a small amount of [571]+ in these samples (Figures S44 and S47). Finally, the appearance of a signal at δ −14.7 in the 1H NMR spectrum of [μ-D571]O2CCF3 (Figure S49) indicates only 65% deuteration, the remainder being [μ-H571]O2CCF3. 1H NMR (500 MHz, CD2Cl2): δ 8.08–6.67 (m, 44H, C6H5 and =CH), 2.57–1.37 (m, 4H, SCH2), 1.17, 0.23 (s, s, 6H, CH3), −14.72 (m, 1H, Fe(μ-H)Fe). 31P{1H} NMR (CD2Cl2): δ 87.1 (t), 81.5 (t), 78.8 (t), 72.8 (t). FT-IR (CH2Cl2): νCO 1974 (broad), 1952 (vs) cm−1. [μ-D571]O2CCF3. 1H NMR (500 MHz, CD2Cl2): δ 8.08–6.67 (m, 44H, C6H5 and =CH), 2.57–1.37 (m, 4H, SCH2), 1.17, 0.23 (s, s, 6H, CH3). 31P{1H} NMR (CD2Cl2): δ 87.34 (t), 81.8 (t), 78.9 (t), 72.9 (t). FT-IR (CH2Cl2): νCO 1974 (broad), 1952 (vs) cm−1.
Cyclic Voltammetry
Electrochemical experiments were carried out in a nitrogen-filled glovebox fitted with adapters to connect to a CH Instruments Model 600D series electrochemical analyzer. These experiments were conducted in a 3 mL glass cell fitted with a Teflon top. A glassy-carbon electrode (d = 3 mm) was used as the working electrode. A silver wire was used as a pseudoreference electrode, and ferrocene was added to the cell so the collected data could be referenced to the Fc0/+ couple (0.00 V). The counter electrode for these experiments was a platinum wire. Due to these experiments being collected in a glovebox, sparging was not necessary. iR compensation was applied to each voltammogram. These experiments were conducted at room temperature with 1 mM of the complex and 0.125 M of supporting electrolyte in dried and deoxygenated solvents.
NRVS
Nuclear resonance vibrational spectroscopy (NRVS) data of [(μ-H/D)571]BF4/O2CCF3 were collected at the Advanced Photon Source (APS) sector 3-ID, Argonne National Laboratory, with the storage ring operating in the standard operating mode (24 electron bunches spaced by 153 ns). A water-cooled high heat-load monochromator (HHLM) consisting of two diamond single crystals with (1,1,1) as the reflection plane and a four-bounce 2Si(4,0,0) × 2Si(10,6,4) high-resolution monochromator (HRM) provided the 14.4 keV X-rays with 1 meV energy resolution. The flux was about 2.5 × 10⁹ photons/s positioned on our sample at the 3ID-D station. The operation temperature was set to 10 K, while the real sample temperature was ∼58 K for [(μ-H)571]BF4 and 62 K for [(μ-D)571]O2CCF3. The nuclear scattering induced 57Fe nuclear fluorescence at 14.4 keV, and the converted Fe Kα fluorescence at 6.4 keV was recorded with an Avalanche Photo Diode (APD) detector, with an active area of 10 mm by 10 mm in size and 0.1 mm in thickness.
The NRVS spectra of [(t-H/D)571]BF4/O2CCF3 were collected at SPring-8 BL09XU and BL19LXU in the “C” bunch mode (29 electron bunches spaced by 145.5 ns).57 The samples were placed in a helium cold finger maintained at 10 K, and the true temperature ranged from 65 to 75 K. Using a double Si(1,1,1) HHLM and a [Ge(4,2,2),2×Si-(9,7,5)] HRM, the nuclear resonance energy at 14.4 keV with a 0.8 meV resolution was achieved (flux = 6 × 10⁹ cps at BL19XU and 2.0 × 10⁹ cps at BL09XU).17 An APD array was used to detect the 57Fe nuclear fluorescence and Fe Kα fluorescence. [t-D571]O2CCF3 was measured using sectional scans: −100 to 550 cm−1 at 1 s/pt, 550–800 cm−1 at 3 s/pt, 800–1250 cm−1 at 1 s/pt, and 1250–1500 cm−1 at 20 s/pt with respect to 57Fe nuclear resonance. All NRVS spectra were processed with PHOENIX executed through the web application spectra.tools to yield 57Fe partial vibrational density of states (PVDOS).58
DFT Calculations
Structural optimization and normal-mode analysis was done using GAUSSIAN 09,59 on the basis of the densities exported from single-point calculations using JAGUAR 9.4.60 The BP8661,62 (for most of the results) and B3LYP61 (for single-point energy calculations only) functionals together with the LACV3P** basis set were employed. For the first- and second-row elements, LACV3P** implies 6-311G** triple-ζ basis sets including polarization functions. For the Fe atoms, LACV3P** consists of a triple-ζ quality basis set for the outermost core and valence orbitals and the quasi-relativistic Los Alamos effective core potential (ECP) for the innermost electrons.63,64 The model environment was considered using a self-consistent reaction field (SCRF) polarizable continuum model and integral equation formalism (IEF-PCM) as implemented in GAUSSIAN 09, with the static dielectric constant set to ε = 4.0 and the remaining IEF-PCM parameters at their default values for water. The calculations (i) including the two-body D3 dispersion corrections by Grimme et al.65,66 as implemented in GAUSSIAN 09 and (ii) excluding the D3 correction have been done to generate the normal modes in the (i) <470 cm−1 and (ii) >470 cm−1 areas, respectively; this combined approach ultimately produced DFT-based 57Fe-PVDOS spectra in better agreement with the experiment. The optimized structures shown in the figures are based on scheme ii, if not otherwise mentioned. On the basis of the normal mode outputs, an in-house Q-SPECTOR program successfully applied previously15,51–54 was utilized to generate the 57Fe-PVDOS from the normal mode composition factors. An empirical scaling of calculated frequencies has not been applied. The resolution of the observed NRVS spectra was accounted for by convolution of the computed PVDOS intensities with a full width at half-maximum (fwhm) equal to 14 cm−1 Lorentzian.
Supplementary Material
Acknowledgments
Work at Illinois and California was supported by NIH GM-061153 and GM-65440, respectively. Work at Berlin was supported by the Cluster of Excellence “Unifying Concepts in Catalysis” initiative of the DFG. The NRVS were measured at APS (via proposals GUP 49765, 44733, 43032, 39192) and at SPring-8 (via JASRI proposals 2015B1134, 2016B1347, 2016A1154, 2017A1115, 2015A0103-2016A0103 and via RIKEN proposals 20150048, 20160063). We thank Michael Hu, Jiyong Zhao, and Ercan E. Alp, Yoshitaka Yoda, and Kenji Tamasaku for assistance with NRVS measurements.
Footnotes
Supporting Information
The Supporting Information is available free of charge on the ACS Publications website at DOI: 10.1021/acs.inorgchem.7b02903.
ESI-MS, FT-IR, NMR, CV, NRVS, and DFT figures and tables; supplementary discussions on the NRVS and DFT results (PDF)
Animated vibrational normal modes (ZIP)
Coordinates of the DFT models (ZIP)
Accession Codes
CCDC 1583878–1583879 contain the supplementary crystallographic data for this paper. These data can be obtained free of charge via www.ccdc.cam.ac.uk/data_request/cif, or by emailing data_request@ccdc.cam.ac.uk, or by contacting The Cambridge Crystallographic Data Centre, 12 Union Road, Cambridge CB2 1EZ, UK; fax: +44 1223 336033.
ORCID
Danielle L. Gray: 0000-0003-0059-2096
Wenguang Wang: 0000-0002-4108-7865
Pei-Hua Zhao: 0000-0002-5480-6128
Thomas B. Rauchfuss: 0000-0003-2547-5128
Vladimir Pelmenschikov: 0000-0002-0523-4418
Author Contributions
T.B.R. and S.P.C. planned the research and designed experiments. M.R.C., C.P.R., W.W., and P.-H.Z. carried out synthetic operations and preliminary characterizations. D.L.G. conducted the X-ray crystallography. C.C.P., L.B.G., and H.W. collected the NRVS data. V.P. carried out the DFT calculations and interpreted their results. T.B.R., V.P., M.R.C., and C.C.P. wrote the manuscript.
Notes
The authors declare no competing financial interest.
Contributor Information
Michaela R. Carlson, School of Chemical Sciences, University of Illinois, Urbana, Illinois 61801, United States
Danielle L. Gray, School of Chemical Sciences, University of Illinois, Urbana, Illinois 61801, United States
Casseday P. Richers, School of Chemical Sciences, University of Illinois, Urbana, Illinois 61801, United States
Wenguang Wang, School of Chemical Sciences, University of Illinois, Urbana, Illinois 61801, United States.
Pei-Hua Zhao, School of Chemical Sciences, University of Illinois, Urbana, Illinois 61801, United States.
Thomas B. Rauchfuss, School of Chemical Sciences, University of Illinois, Urbana, Illinois 61801, United States.
Vladimir Pelmenschikov, Institut für Chemie, Technische Universität Berlin, 10623 Berlin, Germany.
Cindy C. Pham, Department of Chemistry, University of California, Davis, California 95616, United States
Leland B. Gee, Department of Chemistry, University of California, Davis, California 95616, United States
Hongxin Wang, Department of Chemistry, University of California, Davis, California 95616, United States.
Stephen P. Cramer, Department of Chemistry, University of California, Davis, California 95616, United States.
References
- 1.Schilter D, Camara JM, Huynh MT, Hammes-Schiffer S, Rauchfuss TB. Hydrogenase Enzymes and Their Synthetic Models: The Role of Metal Hydrides. Chem Rev. 2016;116:8693–8749. doi: 10.1021/acs.chemrev.6b00180. [DOI] [PMC free article] [PubMed] [Google Scholar]
- 2.Mellor SB, Vavitsas K, Nielsen AZ, Jensen PE. Photosynthetic Fuel for Heterologous Enzymes: The Role of Electron Carrier Proteins. Photosynth Res. 2017;134:329–342. doi: 10.1007/s11120-017-0364-0. [DOI] [PubMed] [Google Scholar]
- 3.Ash PA, Hidalgo R, Vincent KA. Proton Transfer in the Catalytic Cycle of [NiFe] Hydrogenases: Insight from Vibrational Spectroscopy. ACS Catal. 2017;7:2471–2485. doi: 10.1021/acscatal.6b03182. [DOI] [PMC free article] [PubMed] [Google Scholar]
- 4.Tard C, Pickett CJ. Structural and Functional Analogues of the Active Sites of the [Fe]-, [NiFe]-, and [FeFe]-Hydrogenases. Chem Rev. 2009;109:2245–2274. doi: 10.1021/cr800542q. [DOI] [PubMed] [Google Scholar]
- 5.Gloaguen F, Rauchfuss TB. Small Molecule Mimics of Hydrogenases: Hydrides and Redox. Chem Soc Rev. 2009;38:100–108. doi: 10.1039/b801796b. [DOI] [PMC free article] [PubMed] [Google Scholar]
- 6.McGrady GS, Guilera G. The Multifarious World of Transition Metal Hydrides. Chem Soc Rev. 2003;32:383–392. doi: 10.1039/b207999m. [DOI] [PubMed] [Google Scholar]
- 7.Chernev P, Lambertz C, Brünje A, Leidel N, Sigfridsson KGV, Kositzki R, Hsieh C, Yao S, Schiwon R, Driess M, Limberg C, Happe T, Haumann M. Hydride Binding to the Active Site of [FeFe]-Hydrogenase. Inorg Chem. 2014;53:12164–12177. doi: 10.1021/ic502047q. [DOI] [PubMed] [Google Scholar]
- 8.Amara P, Mouesca J-M, Volbeda A, Fontecilla-Camps JC. Carbon Monoxide Dehydrogenase Reaction Mechanism: A Likely Case of Abnormal CO2 Insertion to a Ni–H− Bond. Inorg Chem. 2011;50:1868–1878. doi: 10.1021/ic102304m. [DOI] [PubMed] [Google Scholar]
- 9.Lubitz W, Ogata H, Rüdiger O, Reijerse E. Hydrogenases. Chem Rev. 2014;114:4081–4148. doi: 10.1021/cr4005814. [DOI] [PubMed] [Google Scholar]
- 10.Mulder DW, Ratzloff MW, Bruschi M, Greco C, Koonce E, Peters JW, King PW. Investigations on the Role of Proton-Coupled Electron Transfer in Hydrogen Activation by [FeFe]-Hydrogenase. J Am Chem Soc. 2014;136:15394–15402. doi: 10.1021/ja508629m. [DOI] [PubMed] [Google Scholar]
- 11.Winkler M, Senger M, Duan J, Esselborn J, Wittkamp F, Hofmann E, Apfel U, Stripp ST, Happe T. Accumulating the Hydride State in the Catalytic Cycle of [FeFe]-Hydrogenases. Nat Commun. 2017;8:16115. doi: 10.1038/ncomms16115. [DOI] [PMC free article] [PubMed] [Google Scholar]
- 12.Gilbert-Wilson R, Siebel JF, Adamska-Venkatesh A, Pham CC, Reijerse E, Wang H, Cramer SP, Lubitz W, Rauchfuss TB. Spectroscopic Investigations of [FeFe] Hydrogenase Maturated with [57Fe2(adt)(CN)2(CO)4]2−. J Am Chem Soc. 2015;137:8998–9005. doi: 10.1021/jacs.5b03270. [DOI] [PMC free article] [PubMed] [Google Scholar]
- 13.Mulder DW, Guo Y, Ratzloff MW, King PW. Identification of a Catalytic Iron-Hydride at the H-cluster of [FeFe]-Hydrogenase. J Am Chem Soc. 2017;139:83–86. doi: 10.1021/jacs.6b11409. [DOI] [PubMed] [Google Scholar]
- 14.Reijerse EJ, Pham CC, Pelmenschikov V, Gilbert-Wilson R, Adamska-Vekatesh A, Siebel JF, Gee LB, Yoda Y, Tamasaku K, Lubitz W, Rauchfuss TB, Cramer SP. Direct Observation of an Iron-Bound Terminal Hydride in [FeFe]-Hydrogenase by Nuclear Resonance Vibrational Spectroscopy. J Am Chem Soc. 2017;139:4306–4309. doi: 10.1021/jacs.7b00686. [DOI] [PMC free article] [PubMed] [Google Scholar]
- 15.Pelmenschikov V, Birrell JA, C PC, Mishra N, Wang H, Sommer C, Reijerse E, Richers CP, Tamasaku K, Y Y, Rauchfuss TB, Lubitz W, Cramer SP. Reaction Coordinate Leading to H2 Production in [FeFe]-Hydrogenase Identified by Nuclear Resonance Vibrational Spectroscopy and Density Functional Theory. J Am Chem Soc. 2017;139:16894–16902. doi: 10.1021/jacs.7b09751. [DOI] [PMC free article] [PubMed] [Google Scholar]
- 16.Adamska A, S A, Lambertz C, Rüdiger O, Happe T, Reijerse E, Lubitz W. Identification and Characterization of the “Super-Reduced” State of the H-Cluster in [FeFe]-Hydrogenase: A New Building Block for the Catalytic Cycle? Angew Chem, Int Ed. 2012;51:11458–11462. doi: 10.1002/anie.201204800. [DOI] [PubMed] [Google Scholar]
- 17.Ogata H, Kramer T, Wang H, Schilter D, Pelmenschikov V, van Gastel M, Neese F, Rauchfuss TB, Gee LB, Scott AD, Yoda Y, Tanaka Y, Lubitz W, Cramer SP. Hydride Bridge in [NiFe]-Hydrogenase Observed by Nuclear Resonance Vibrational Spectroscopy. Nat Commun. 2015;6:7890–7898. doi: 10.1038/ncomms8890. [DOI] [PMC free article] [PubMed] [Google Scholar]
- 18.Carroll ME, Barton BE, Rauchfuss TB, Carroll PJ. Synthetic Models for the Active Site of the [FeFe]-Hydrogenase: Catalytic Proton Reduction and the Structure of the Doubly Protonated Intermediate. J Am Chem Soc. 2012;134:18843–18852. doi: 10.1021/ja309216v. [DOI] [PMC free article] [PubMed] [Google Scholar]
- 19.Mebs S, Senger M, Duan J, Wittkamp F, Apfel U, Happe T, Winkler M, Stripp ST, Haumann M. Bridging Hydride at Reduced H-Cluster Species in [FeFe]-Hydrogenases Revealed by Infrared Spectroscopy, Isotope Editing, and Quantum Chemistry. J Am Chem Soc. 2017;139:12157–12160. doi: 10.1021/jacs.7b07548. [DOI] [PubMed] [Google Scholar]
- 20.Wang W, Rauchfuss TB, Moore CE, Rheingold AL, De Gioia L, Zampella G. Crystallographic Characterization of a Fully Rotated, Basic Diiron Dithiolate: Model for the Hred State. Chem Eur J. 2013;19:15476–15479. doi: 10.1002/chem.201303351. [DOI] [PubMed] [Google Scholar]
- 21.Hsieh C, Erdem Ö, Harman S, Singleton M, Reijerse E, Lubitz W, Popescu CV, Reibenspies JH, Brothers SM, Hall MB, Darensbourg MY. Structural and Spectroscopic Features of Mixed Valent FeIIFeI Complexes and Factors Related to the Rotated Configuration of Diiron Hydrogenase. J Am Chem Soc. 2012;134:13089–13102. doi: 10.1021/ja304866r. [DOI] [PubMed] [Google Scholar]
- 22.Capon J, Ezzaher S, Gloaguen F, Pétillon FY, Schollhammer P, Talarmin J, Davin TJ, McGrady JE, Muir KW. Electrochemical and Theoretical Investigations of the Reduction of [Fe2(CO)5L{μ-SCH2XCH2S}] Complexes Related to [FeFe] Hydrogenase. New J Chem. 2007;31:2052–2064. [Google Scholar]
- 23.Goy R, Bertini L, Elleouet C, Gorls H, Zampella G, Talarmin J, De Gioia L, Schollhammer P, Apfel U, Weigand W. A Sterically Stabilized FeI-FeI Semi-Rotated Conformation of [FeFe] Hydrogenase Subsite Model. Dalton Trans. 2015;44:1690–1699. doi: 10.1039/c4dt03223c. [DOI] [PubMed] [Google Scholar]
- 24.Schilter D, Nilges MJ, Chakrabarti M, Lindahl PA, Rauchfuss TB, Stein M. Mixed-Valence Nickel-Iron Dithiolate Models of the [NiFe]-Hydrogenase Active Site. Inorg Chem. 2012;51:2338–2348. doi: 10.1021/ic202329y. [DOI] [PMC free article] [PubMed] [Google Scholar]
- 25.Justice AK, Zampella G, De Gioia L, Rauchfuss TB. Lewis vs. Brønsted-Basicities of Diiron Dithiolates: Spectroscopic Detection of the ″Rotated Structure″ and Remarkable Effects of Ethane- vs. Propanedithiolate. Chem Commun. 2007:2019–2021. doi: 10.1039/b700754j. [DOI] [PubMed] [Google Scholar]
- 26.Li Y, Rauchfuss TB. Synthesis of Diiron(I) Dithiolato Carbonyl Complexes. Chem Rev. 2016;116:7043–7077. doi: 10.1021/acs.chemrev.5b00669. [DOI] [PMC free article] [PubMed] [Google Scholar]
- 27.Carroll ME, Chen J, Gray DE, Lansing JC, Rauchfuss TB. Ferrous Carbonyl Dithiolates as Precursors to FeFe, FeCo, and FeMn Carbonyl Dithiolates. Organometallics. 2014;33:858–867. doi: 10.1021/om400752a. [DOI] [PMC free article] [PubMed] [Google Scholar]
- 28.Domingos AJP, Howell JAS, Johnson BFG, Lewis J. Inorg Synth. 1990;28:52. [Google Scholar]
- 29.Singleton ML, Jenkins RM, Klemashevich CL, Darensbourg MY. The Effect of Bridgehead Steric Bulk on the Ground State and Intramolecular Exchange Processes of (μ-SCH2CR2CH2S)[Fe(CO)3][Fe(CO)2L] complexes. C R Chim. 2008;11:861–874. [Google Scholar]
- 30.Justice AK, De Gioia L, Nilges MJ, Rauchfuss TB, Wilson SR, Zampella G. Redox and Structural Properties of Mixed-Valence Models for the Active Site of the [FeFe]-Hydrogenase: Progress and Challenges. Inorg Chem. 2008;47:7405–7414. doi: 10.1021/ic8007552. [DOI] [PMC free article] [PubMed] [Google Scholar]
- 31.Justice AK, Rauchfuss TB, Wilson SR. Unsaturated, Mixed-Valence Diiron Dithiolate Model for the Hox State of the [FeFe] Hydrogenase. Angew Chem, Int Ed. 2007;46:6152–6154. doi: 10.1002/anie.200702224. [DOI] [PMC free article] [PubMed] [Google Scholar]
- 32.Rauchfuss TB. Diiron Azadithiolates as Models for the [FeFe]-Hydrogenase Active Site and Paradigm for the Role of the Second Coordination Sphere. Acc Chem Res. 2015;48:2107–2116. doi: 10.1021/acs.accounts.5b00177. [DOI] [PMC free article] [PubMed] [Google Scholar]
- 33.Silakov A, Olsen MT, Sproules S, Reijerse EJ, Rauchfuss TB, Lubitz W. EPR/ENDOR, Mössbauer, and Quantum-Chemical Investigations of Diiron Complexes Mimicking the Active Oxidized State of [FeFe]-Hydrogenase. Inorg Chem. 2012;51:8617–8628. doi: 10.1021/ic3013766. [DOI] [PMC free article] [PubMed] [Google Scholar]
- 34.Liu T, Darensbourg MY. A Mixed-Valent, Fe(II)Fe(I), Diiron Complex Reproduces the Unique Rotated State of the [FeFe]Hydrogenase Active Site. J Am Chem Soc. 2007;129:7008–7009. doi: 10.1021/ja071851a. [DOI] [PubMed] [Google Scholar]
- 35.Thomas CM, Liu T, Hall MB, Darensbourg MY. Series of Mixed Valent Fe(II)Fe(I) Complexes that Model the Hox State of [FeFe]Hydrogenase: Redox Properties, Density-Functional Theory Investigation, and Reactivities with Extrinsic CO. Inorg Chem. 2008;47:7009–7024. doi: 10.1021/ic800654a. [DOI] [PubMed] [Google Scholar]
- 36.Tye JW, Darensbourg MY, Hall MB. Refining the Active Site Structure of Iron-Iron Hydrogenase Using Computational Infrared Spectroscopy. Inorg Chem. 2008;47:2380–2388. doi: 10.1021/ic7013732. [DOI] [PubMed] [Google Scholar]
- 37.Wang W, Rauchfuss TB, Zhu L, Zampella G. New Reactions of Terminal Hydrides on a Diiron Dithiolate. J Am Chem Soc. 2014;136:5773–5782. doi: 10.1021/ja501366j. [DOI] [PubMed] [Google Scholar]
- 38.Brookhart M, Green MLH, Parkin G. Agostic Interactions in Transition Metal Compounds. Proc Natl Acad Sci U S A. 2007;104:6908–6914. doi: 10.1073/pnas.0610747104. [DOI] [PMC free article] [PubMed] [Google Scholar]
- 39.Silakov A, Reijerse EJ, Albracht SPJ, Hatchikian EC, Lubitz W. The Electronic Structure of the H-Cluster in the [FeFe]-Hydrogenase from Desulfovibrio desulfuricans: A Q-band 57Fe-ENDOR and HYSCORE Study. J Am Chem Soc. 2007;129:11447–11458. doi: 10.1021/ja072592s. [DOI] [PubMed] [Google Scholar]
- 40.Barton BE, Rauchfuss TB. Terminal Hydride in [FeFe]-Hydrogenase Model Has Lower Potential for H2 Production Than the Isomeric Bridging Hydride. Inorg Chem. 2008;47:2261–2263. doi: 10.1021/ic800030y. [DOI] [PMC free article] [PubMed] [Google Scholar]
- 41.Filippi G, Arrigoni F, Bertini L, De Gioia L, Zampella G. DFT Dissection of the Reduction Step in H2 Catalytic Production by [FeFe]-Hydrogenase-Inspired Models: Can the Bridging Hydride Become More Reactive than the Terminal Isomer. Inorg Chem. 2015;54:9529–9542. doi: 10.1021/acs.inorgchem.5b01495. [DOI] [PubMed] [Google Scholar]
- 42.Barton BE, Zampella G, Justice AK, De Gioia L, Rauchfuss TB, Wilson SR. Isomerization of the Hydride Complexes [HFe2(SR)2(PR3)x(CO)6−x]+ (x = 2, 3, 4) Relevant to the Active Site Models for the [FeFe]-Hydrogenases. Dalton Trans. 2010;39:3011–3019. doi: 10.1039/b910147k. [DOI] [PMC free article] [PubMed] [Google Scholar]
- 43.Zampella G, Fantucci P, De Gioia L. DFT Characterization of the Reaction Pathways for Terminal- to μ-hydride Isomerisation in Synthetic Models of the [FeFe]-Hydrogenase Active Site. Chem Commun. 2010;46:8824–8826. doi: 10.1039/c0cc02821e. [DOI] [PubMed] [Google Scholar]
- 44.Zaffaroni R, Rauchfuss TB, Gray DL, De Gioia L, Zampella G. Terminal vs Bridging Hydrides of Diiron Dithiolates: Protonation of Fe2(dithiolate)(CO)2(PMe3)4. J Am Chem Soc. 2012;134:19260–19269. doi: 10.1021/ja3094394. [DOI] [PMC free article] [PubMed] [Google Scholar]
- 45.Bruschi M, Greco C, Kaukonen M, Fantucci P, Ryde U, De Gioia L. Influence of the [2Fe]H Subcluster Environment on the Properties of Key Intermediates in the Catalytic Cycle of [FeFe] Hydrogenases: Hints for the Rational Design of Synthetic Catalysts. Angew Chem, Int Ed. 2009;48:3503–3506. doi: 10.1002/anie.200900494. [DOI] [PubMed] [Google Scholar]
- 46.Finkelmann AR, Stiebritz MT, Reiher M. Inaccessibility of the μ-Hydride Species in [FeFe] Hydrogenases. Chem Sci. 2014;5:215–221. [Google Scholar]
- 47.Sturhahn W, Toellner T, Alp E, Zhang X, Ando M, Yoda Y, Kikuta S, Seto M, Kimball C, Dabrowski B. Phonon Density of States Measured by Inelastic Nuclear Resonant Scattering. Phys Rev Lett. 1995;74:3832–3835. doi: 10.1103/PhysRevLett.74.3832. [DOI] [PubMed] [Google Scholar]
- 48.Seto M, Yoda Y, Kikuta S, Zhang X, Ando M. Observation of Nuclear Resonant Scattering Accompanied by Phonon Excitation Using Synchrotron Radiation. Phys Rev Lett. 1995;74:3828–3831. doi: 10.1103/PhysRevLett.74.3828. [DOI] [PubMed] [Google Scholar]
- 49.Kamali S, Wang H, Mitra D, Ogata H, Lubitz W, Manor BC, Rauchfuss TB, Byrne D, Bonnefoy V, Jenney FE, Jr, Adams MWW, Yoda Y, Alp E, Zhao J, Cramer SP. Observation of the Fe-CN and Fe-CO Vibrations in the Active Site of [NiFe] Hydrogenase by Nuclear Resonance Vibrational Spectroscopy. Angew Chem, Int Ed. 2013;52:724–728. doi: 10.1002/anie.201204616. [DOI] [PMC free article] [PubMed] [Google Scholar]
- 50.Guo Y, Wang H, Xiao Y, Vogt S, Thauer RK, Shima S, Volkers PI, Rauchfuss TB, Pelmenschikov V, Case DA, Alp E, Sturhahn W, Yoda Y, Cramer SP. Characterization of the Fe Site in Iron–Sulfur Cluster-Free Hydrogenase (Hmd) and of a Model Compound via Nuclear Resonant Vibrational Spectroscopy (NRVS) Inorg Chem. 2008;47:3969–3977. doi: 10.1021/ic701251j. [DOI] [PMC free article] [PubMed] [Google Scholar]
- 51.Mitra D, George SJ, Guo YS, Kamali S, Keable S, Peters JW, Pelmenschikov V, Case DA, Cramer SP. Characterization of [4Fe-4S] Cluster Vibrations and Structure in Nitrogenase Fe Protein at Three Oxidation Levels via Combined NRVS, EXAFS, and DFT Analyses. J Am Chem Soc. 2013;135:2530–2543. doi: 10.1021/ja307027n. [DOI] [PMC free article] [PubMed] [Google Scholar]
- 52.Mitra D, Pelmenschikov V, Guo YS, Case DA, Wang HX, Dong WB, Tan ML, Ichiye T, Jenney FE, Adams MWW, Yoda Y, Zhao JY, Cramer SP. Dynamics of the [4Fe-4S] Cluster in Pyrococcus furiosus D14C Ferredoxin via Nuclear Resonance Vibrational and Resonance Raman Spectroscopies, Force Field Simulations, and Density Functional Theory Calculations. Biochemistry. 2011;50:5220–5235. doi: 10.1021/bi200046p. [DOI] [PMC free article] [PubMed] [Google Scholar]
- 53.Yan LF, Pelmenschikov V, Dapper CH, Scott AD, Newton WE, Cramer SP. IR-Monitored Photolysis of CO-Inhibited Nitrogenase: A Major EPR-Silent Species with Coupled Terminal CO Ligands. Chem Eur J. 2012;18:16349–16357. doi: 10.1002/chem.201202072. [DOI] [PMC free article] [PubMed] [Google Scholar]
- 54.Pelmenschikov V, Guo YS, Wang HX, Cramer SP, Case DA. Fe-H/D Stretching and Bending Modes in Nuclear Resonant Vibrational, Raman and Infrared Spectroscopies: Comparisons of Density Functional Theory and Experiment. Faraday Discuss. 2011;148:409–420. doi: 10.1039/c004367m. [DOI] [PMC free article] [PubMed] [Google Scholar]
- 55.Mebs S, Kositzki R, Duan J, Kertess L, Senger M, Wittkamp F, Apfel U, Happe T, Stripp ST, Winkler M, Haumann M. Hydrogen and Oxygen Trapping at the H-cluster of [FeFe]-Hydrogenase Revealed by Site-Selective Spectroscopy and QM/MM Calculations. Biochim Biophys Acta, Bioenerg. 2018;1859:28–41. doi: 10.1016/j.bbabio.2017.09.003. [DOI] [PubMed] [Google Scholar]
- 56.Aggarwal VK, Davies IW, Franklin R, Maddock J, Mahon MF, Molloy KC. Studies on the Oxidation of 1, 3-Dithiane and 5, 5-Disubstituted Analogues Including X-ray Crystal Structure, Equilibration Studies and pKa Measurements on Selected Oxides. J Chem Soc, Perkin Trans. 1(1994):2363–2368. [Google Scholar]
- 57.Yoda Y, Yabashi M, Izumi K, Zhang XW, Kishimoto S, Kitao S, Seto M, Mitsui T, Harami T, Imai Y, Kikuta S. Nuclear Resonant Scattering Beamline at SPring-8. Nucl Instrum Methods Phys Res, Sect A. 2001;467-468:715–718. [Google Scholar]
- 58.Sturhahn W. CONUSS and PHOENIX: Evaluation of nuclear resonant scattering data. Hyperfine Interact. 2000;125:149–172. [Google Scholar]
- 59.Frisch MJ, Trucks GW, Schlegel HB, Scuseria GE, Robb MA, Cheeseman JR, Scalmani G, Barone V, Mennucci B, Petersson GA, Nakatsuji H, Caricato M, Li X, Hratchian HP, Izmaylov AF, Bloino J, Zheng G, Sonnenberg JL, Hada M, Ehara M, Toyota K, Fukuda R, Hasegawa J, Ishida M, Nakajima T, Honda Y, Kitao O, Nakai H, Vreven T, Montgomery JA, Jr, Peralta JE, Ogliaro F, Bearpark M, Heyd JJ, Brothers E, Kudin KN, Staroverov VN, Kobayashi R, Normand J, Raghavachari K, Rendell A, Burant JC, Iyengar SS, Tomasi J, Cossi M, Rega N, Millam JM, Klene M, Knox JE, Cross JB, Bakken V, Adamo C, Jaramillo J, Gomperts R, Stratmann RE, Yazyev O, Austin AJ, Cammi R, Pomelli C, Ochterski JW, Martin RL, Morokuma K, Zakrzewski VG, Voth GA, Salvador P, Dannenberg JJ, Dapprich S, Daniels AD, Farkas Ö, Foresman JB, Ortiz JV, Cioslowski J, Fox DJ. Gaussian 09, Revision D 01. Gaussian Inc; Wallingford, CT: 2009. [Google Scholar]
- 60.Jaguar, version 9.4. Schrodinger, Inc.; New York: 2016. [Google Scholar]
- 61.Becke AD. Density-Functional Exchange-Energy Approximation with Correct Asymptotic-Behavior. Phys Rev A: At, Mol, Opt Phys. 1988;38:3098–3100. doi: 10.1103/physreva.38.3098. [DOI] [PubMed] [Google Scholar]
- 62.Perdew JP. Density-Functional Approximation for the Correlation-Energy of the Inhomogeneous Electron-Gas. Phys Rev B: Condens Matter Mater Phys. 1986;33:8822–8824. doi: 10.1103/physrevb.33.8822. [DOI] [PubMed] [Google Scholar]
- 63.McLean AD, Chandler GS. Contracted Gaussian Basis Sets for Molecular Calculations. I. Second Row Atoms, Z = 11–18. J Chem Phys. 1980;72:5639–5648. [Google Scholar]
- 64.Krishnan R, Binkley JS, Seeger R, Pople JA. Self-consistent molecular orbital methods. XX. A Basis Set for Correlated Wave Functions. J Chem Phys. 1980;72:650–654. [Google Scholar]
- 65.Grimme S, Antony J, Ehrlich S, Krieg H. A Consistent and Accurate Ab Initio Parametrization of Density Functional Dispersion Correction (DFT-D) for the 94 elements H-Pu. J Chem Phys. 2010;132:154104. doi: 10.1063/1.3382344. [DOI] [PubMed] [Google Scholar]
- 66.Goerigk L, Grimme S. A Thorough Benchmark of Density Functional Methods for General Main Group Thermochemistry, Kinetics, and Noncovalent Interactions. Phys Chem Chem Phys. 2011;13:6670–6688. doi: 10.1039/c0cp02984j. [DOI] [PubMed] [Google Scholar]
Associated Data
This section collects any data citations, data availability statements, or supplementary materials included in this article.


