

Abstract
MHC-multimers are reagents used for the detection and enumeration of antigen-specific T cells (ASTs). These reagents exploit the mechanism by which T cell receptors (TCR) on cytotoxic CD8 T cells recognize specific antigens in the context of a major histocompatibility complex (MHC) molecule during antigen presentation. MHC-multimers are fluorescently-labeled dextran polymers that carry MHC Class I molecules and peptide sequences that can be modified to represent specific cognate sequences of the antigen of interest with dextramers having a 10-fold multiplicity of the MHC/peptide combination within a single multimer. Since the binding of antigen-specific dextramers mimics antigen presentation to the TCR, the present study sought to determine whether this TCR engagement on the AST was sufficient to elicit a functional T cell response. The effect of binding of CMV specific dextramers on the activation of the NFAT signal transduction cascade was assessed in peripheral blood from bone marrow transplant recipients previously determined to be positive for CMV-ASTs (CASTs). NFAT activation was quantified by measuring nuclear translocation of NFAT1 in CD8+ CASTs and CD8+ non-CASTs by imaging flow cytometry.
Our results demonstrate that an increase in the nuclear localization of NFAT1 was detectable in the CASTs following the CMV-dextramer binding and could be observed as early as 10 minutes post-exposure. The NFAT1 activation correlated with a downstream functional response in the form of interferon gamma production. Sample preparation, temperature, and duration of dextramer exposure were important parameters affecting the dextramer-induced NFAT activation with 2h exposure in whole blood at room temperature being the optimal of the conditions tested. Intra- and inter-individual heterogeneity was observed with regards to the NFAT activation in the CASTs.
Importantly, no effect of the dextramers was observed in the CD8+ non-CASTs, and therefore dextramer negative cell populations. Exposure to PMA/ionomycin following dextramer exposure resulted in a homogeneous NFAT activation in both the dextramer-positive but NFAT1 nonresponsive CAST and non-CAST cells.
Thus, the data demonstrate that binding of antigen-specific dextramers to ASTs specifically results in activation of NFAT, that the NFAT activation correlates with a downstream functional response and that the response can be heterogeneous. This functional parameter may provide insight to the issue whether enumeration alone of ASTs is a sufficient parameter to assess an individual’s immune status against a specific antigen.
Keywords: Antigen specificity, dextramers, imaging flow cytometry, NFAT
INTRODUCTION
The adaptive immune response is the primary responsibility of T and B lymphocytes. Once a pathogen is encountered by the immune system, a response is initiated with the aim to destruct the pathogen and forming memory cells that can quickly trigger the body’s immune response should re-infection occur [1].
Pathogens are processed by dendritic cells which are so-called antigen-presenting cells (APC). Within the APC, the pathogens are broken down and converted into MHC-peptide complexes that are presented on the cell surface to lymphocytes. The T cell receptor (TCR) on T cells binds to the antigen specific MHC-peptide complex and initiates T cell activation that can lead to direct cell killing, antibody production and activation of phagocytic cells. Once infection is cleared some effector cells remain as ‘memory’ cells and should the same antigen be encountered, these cells will differentiate quickly into effector cells and shorten the time to needed for the immune response [1].
The TCR-MHC complex initiates a signaling cascade within the T cell that includes activation of the NFAT transcription factor pathway. The NFAT transcription factor regulates the transcription of many proteins (e.g., cytokines) essential to the immune response [2]. NFAT is held in an inactive phosphorylated state in the cytoplasm. The activated TCR induces the influx of calcium ions that activate calcineurin. Calcineurin rapidly dephosphorylates NFAT proteins resulting in a conformational change that targets NFAT for nuclear localization. Once nuclear, NFAT proteins can bind to their partner molecules such as AP-1 and initiate the transcription and translation of downstream target proteins including the cytokines which are important messengers in coordinating the immune response. The key roles of calcineurin and NFAT in regulating the immune response is at the basis of calcineurin-inhibitors (eg cyclosporine and tacrolimus) being one of the most widely applied drugs in immune suppression regimen [3-5]. The NFAT transcription factor family consists of five members, NFAT1-5. NFAT1-4 are calcium regulated and NFAT1 is the most widely studied in regards to immune regulation [6, 7]. The number of antigen specific T (AST) cells is considered an important parameter for the determination of an individual’s immunity against a specific pathogen and antigen specific MHC multimers are increasingly utilized to identify and enumerate ASTs by conventional flow cytometry (FCM) [8]. These multimers consist of a dextran polymer backbone carrying antigen-specific peptides together with MHC Class I and fluorochrome molecules. Dextramers contain at least 10-fold replicates of the MHC-peptide combinations and their binding to ASTs results in a more sensitive and stable detection of ASTs than previously possible especially for low affinity cells [9]. There exists some controversy as to whether enumeration of ASTs is sufficient to make a determination of an individual’s immunity [10-14]. The frequency of ASTs towards a single antigen peptide is very low, particularly in the absence of an acute infection. Therefore, measurement by FCM demands a highly specific labeling dextramer and the acquisition of a large number of cells to enable detection of ASTs [15]. This makes it difficult to establish functionally relevant threshold levels for antigen specific immune responses. A functional assay would provide an important additional insight into the relevance of enumeration of ASTs and whether the functional potential of these cells is a contributing factor to the current controversies regarding enumeration.
In the present study NFAT1 activation is measured by imaging flow cytometry (IFC) by accumulation of NFAT1 in the nucleus of CD8+ ASTs and CD8+ non-ASTs. Since AST enumeration by dextramers is designed for application in FCM, the study first included a comparison of this enumeration by FCM and IFC. Then, the MHC dextramers were used to simultaneously enumerate and elicit an antigen specific response in T cells measured by IFC only. The variables studied include the duration and temperature of dextramer exposure, the functional response (cytokine production) that was generated, the antigen specificity of the functional response and the inter-individual heterogeneity of the response.
This study indicates that even in the absence of an ex vivo co-stimulatory signal, MHC dextramer engagement with the TCR is sufficient to generate a functional response in the form of NFAT1 activation resulting in cytokine production in the targeted AST.
MATERIALS AND METHODS
All methods are described according to MIFlowCyt 1.0 guidelines [16]. All analysis files mentioned are available upon request.
Study Population
MHC multimer reagents are haplotype specific. In order to perform this study we required peripheral blood from individuals that had been previously haplotyped and tested positive for a specific AST population. The recipients of hematopoietic cell transplants (HCT) as a curative treatment for leukemia are haplotyped and tested for the presence of CMV ASTs by dextramers as standard-of-care (SOC) at Roswell Park Cancer Institute. Peripheral blood samples for this study were collected in accordance with a protocol approved by the Institutional Review Board at Roswell Park Cancer Institute. HLA-typing of blood samples was performed by Immco Diagnostics (Buffalo, NY).
Reagents
Phycoerythrin (PE)-conjugated MHC Dextramer reagents and PE-conjugated MHC Tetramer reagents were obtained from Immudex (Denmark). The MHC multimer reagents used in this study are shown in Supplementary Table 1. CD3 (clone UCHT1) - FITC, CD8 (clone RPA-T8) - BV510, and CD4 (clone RPA-T4) - PECF594 (BD Biosciences, San Diego, CA). Unconjugated NFAT1 (Cell Signaling, Danvers, MA), and donkey anti-rabbit AF647 (Jackson ImmunoResearch Laboratories Inc., West Grove, PA). DAPI (Life Technologies, Carlsbad, CA).
MHC Dextramer and Antibody Staining
500 μL of HLA-typed whole blood was incubated in 15 mL tubes with 10μL each of either TCR-specific dextramers or the negative control dextramer at 4°C for 10 minutes according to the manufacturer’s recommended protocol. For NFAT1 activation cells were incubated for 10minutes – 6 hours at room temperature unless stated otherwise. Cells were then labeled with the recommended amounts of fluorochrome-conjugated antibodies for T cell immunophenotyping for 30 minutes at 4°C. Following incubation, cells were fixed for 10 minutes in 2% methanol-free formaldehyde (FA) (Polysciences Inc, Warrington, PA) at room temperature. Following fixation, cells were pelleted by centrifugation at 600 × g for 4 minutes. Supernatants were removed by decanting, and cell pellets were loosened by briefly vortexing. RBCs were then lysed with 1× BD FACS Lyse solution (BD Biosciences). Following lysis, cells were pelleted by centrifugation at 600 × g for 4 minutes. Supernatants were removed by decanting, and cell pellets were washed with 5 mL of FCM Buffer (1× PBS + 0.5%BSA). Washed cells were centrifuged as above and cell pellets resuspended in residual volume FCM buffer.
Total NFAT1 was detected by indirect labeling. Antibodies were diluted in permeabilization wash buffer (PWB) consisting of 0.1% Triton-X-100 (Sigma-Aldrich Corp, St Louis, MO) in FCM Buffer. The primary Rabbit polyclonal NFAT1 antibody was diluted 1:50 in PWB. Samples were incubated for 20 minutes in the dark at room temperature. Primary antibodies were removed, cells washed with PWB, and 1:200 dilution of secondary AF647 conjugated F(ab’)2 fragment donkey anti rabbit IgG antibody (Jackson ImmunoResearch Laboratories Inc., West Grove, PA) was added and incubated at room temperature in the dark for 20 minutes. Secondary antibody was removed, cells washed with 5 mL FCM Buffer, and resuspended in 100 μL FCM Buffer.
Just prior to data acquisition on the ImageStream, DAPI was added to all samples (0.5 μg/mL final concentration), to stain the nucleus.
ImageStreamX Acquisition
Imaging flow cytometry acquisition and analysis is described as fully as possible according to published recommendations [17]. Data acquisition was performed on an imaging flow cytometer (ImagestreamX Mk-II; Amnis, part of EMD Millipore, Seattle, WA) between years 2013-2015. Images acquired include a brightfield image (Channel 1 and 9; 430-480 nm), CD3-FITC (Channel 2; 480-560 nm), Dextramer-PE (Channel 3; 560-595 nm), CD4-PECF594 (Channel 4; 595-642 nm), DAPI (Channel 7; 430-505 nm), CD8-BV510 (Channel 8; 505-570 nm) and NFAT1-AF647 (Channel 11; 660-740 nm) using a 40× objective. FITC, PE, and PECF594 were excited by a 488 nm laser at 100 mW output, DAPI and BV510 were excited by a 405 nm laser at 20mW output, and AF647 was excited by a 642 nm laser at 20 mW output. The selected laser outputs prevented saturation of pixels in the relevant detection channels as monitored by the corresponding Raw Max Pixel features during acquisition. For each sample, brightfield, CD3-FITC, CD4-PECF594, CD8-BV510 with NFAT1-AF647 and DAPI (nuclear stain) images were simultaneously collected for 50,000 events. Cell classifiers were set for the lower limit of size of the brightfield image to eliminate debris, the upper limit of size of the brightfield image to eliminate aggregates, and a minimum intensity classifier on the DAPI channel to exclude non-cellular (DAPI negative) images.
Compensation
In each experiment single color controls were stained for each fluorochrome. Five hundred events were collected for each individual single color control with all relevant lasers on at the outputs used for the experimental conditions, and with the brightfield illumination and scatter laser off to accurately quantify spectral overlap in all channels. Only events exhibiting a positive signal in the channel of interest were collected (e.g., the CD3-FITC control was positive in channel 2). Each single color control file was then merged to generate a compensation matrix (an example of which is shown in Supplementary Figure 1), and all sample files were processed with this matrix applied.
ImageStreamX Data Analysis
Following compensation for spectral overlap based on single color controls, image analysis was performed with IDEAS® software (Amnis, part of EMD Millipore). Cell populations were hierarchically gated as shown in Figure 1. Events in focus (A) that represent single cells (B) and were CD3 positive T cells (C) were selected as described previously [18, 19]. CD3 positive T cells that were positive for both DAPI and NFAT1 were then selected (D).From this population a CD4 negative, CD8 positive population was selected (E). The spatial relationship between the transcription factors and nuclear images was measured using the ‘Similarity’ feature in the IDEAS® software, as described previously [18, 19]. Briefly, a ‘Morphology’ mask is created to conform to the shape of the nuclear DAPI image (Figure 1 F), and a ‘Similarity Score’ (SS) feature is defined. The SS is a log-transformed Pearson’s correlation coefficient between the pixel values of two image pairs, and provides a measure of the degree of nuclear localization of a factor by measuring the pixel intensity correlation between the NFAT1 images and the DAPI images within the masked region. Cells with a low SS exhibit poor correlation between the images (corresponding with a predominant cytoplasmic distribution of NFAT1), whereas cells with a high SS exhibit positive correlation between the images (corresponding with a predominant nuclear distribution of NFAT1). Determination of the similarity score in a dextramer-positive population was selected from the population from Figure 1E (G). Expression levels of each parameter in the entire cell are represented as ‘Intensity’. Intensity in the IDEAS® software is calculated as the sum of the pixel values in the software-generated ‘combined mask’ minus the background pixel values (i.e., those not in the combined mask).
Figure 1. Hierarchical gating and analysis strategy used to determine transcription factor expression and nuclear translocation.
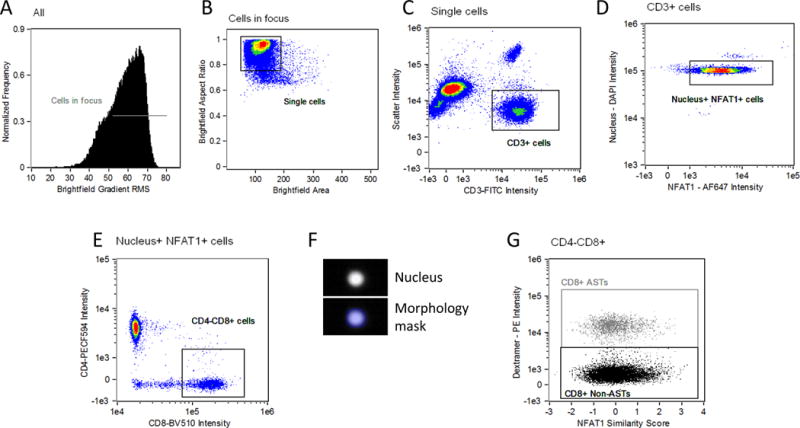
Events which are in focus are selected on the basis of a high value of a contrast parameter (gradient RMS of the brightfield image) (A). Of those cells, single cells are discriminated from debris and cell aggregates based on area and aspect ratio of the brightfield image (B). Single, in focus cells that positive for CD3 are then selected (C). Gating for CD3 positive T cells that contained both a nuclear and NFAT1 signal was then performed (D). Cytotoxic T cells were selected as CD8 positive and CD4 negative (E). A software-generated ‘morphology mask’ based on the nuclear image (F) is then applied to the ‘Similarity’ feature comparing the NFAT1 transcription factor and nuclear images. A distribution of cells with varying ‘similarity scores’ in the CD8+ T cells is then graphed against dextramer - PE events (G), where regions are placed to distinguish dextramer positive and negative events.
Flow Cytometry Acquisition and Analysis
Flow cytometry results shown in Figure 2 were acquired and analyzed as previously described [20]. Briefly, samples were acquired using a FACSCanto II (BD Biosciences) flow cytometer. A stopping gate was set for 20,000 CD3+ CD8+ events, with all events being collected. A medium flow rate (60 μL min-1 for FACSCanto II) was used. ListMode data were analyzed using WinList v6 software (Verity Software House).
Figure 2. MHC dextramer enumeration is comparable between conventional flow cytometry and imaging flow cytometry.
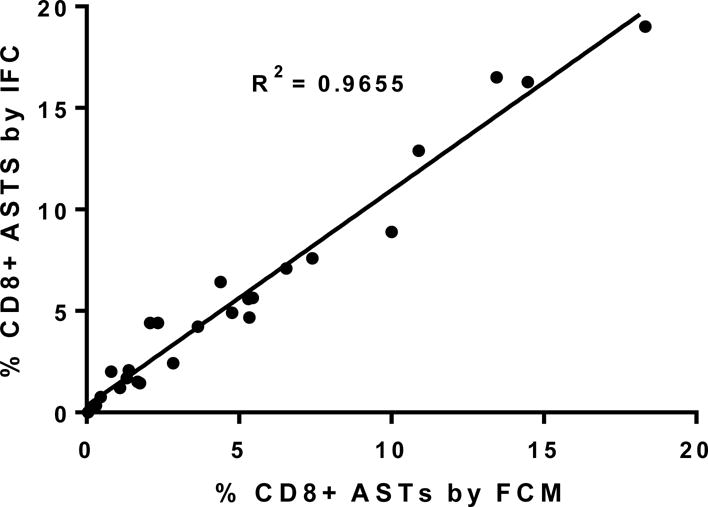
The percent CD8 positive, dextramer-positive events from the twenty-five patient samples used in the current study (y axis) are plotted against the CD8 positive, dextramer-positive events as determined by conventional flow cytometry performed as standard of care (x axis). Linear regression analysis of the scatter plot reveals an R2 of 0.97 between the two techniques.
RESULTS
Enumeration of ASTs by IFC is comparable to enumeration by FCM
Since dextramer enumeration of AST is designed for conventional flow cytometry (FCM) it was first determined if there were any differences in enumeration between FCM and imaging flow cytometry (IFC), Enumeration by FCM was performed as previously described [20]. Enumeration of ASTs on the ImageStream was recorded as a percentage of the total CD3+, CD4-, CD8+ population (Figure 1E). The same calculation was used to generate the percentage ASTs by FCM. The results from 25 samples analyzed as part of this study are shown in Figure 2. The percentage of ASTs by FCM is shown on the x axis, while the corresponding percentage of ASTs detected by IFC in the same whole blood sample is shown on the y axis. Linear regression analysis results in an R2 value of 0.97. Note that for each sample pair, the samples were processed in parallel as independent labeling procedures for the FCM and IFC enumeration. These data indicate that both techniques are highly comparable in enumeration of ASTs by means of dextramers. It can therefore be determined with confidence that those ASTs identified by IFC are the same populations determined by FCM.
MHC dextramer staining in ASTs is optimal at room temperature
According to the manufacturer’s recommended protocol, enumeration of MHC dextramer positive ASTs involves incubation of dextramer reagent in whole blood on ice for 10 minutes prior to further immunophenotyping on ice. Activation of a functional response such as NFAT1 migration to the nucleus is not likely to occur with incubation on ice. We hypothesized that dextramer exposure for 2 hours at 37°C would sufficient to generate an accumulation of NFAT1 in the nucleus since this has been previously described for responses involving TCR stimulation such as following anti-CD3/CD28 stimulation [21]. However, incubation of whole blood with dextramer reagent at 37°C resulted in lower intensity of the dextramer PE signal and a reduced separation from the background observed in the CD8+ non ASTs (Figure 3, bar graph). Further analysis of the PE signal indicated that the low PE intensity was due to degradation of the signal at 37°C and not internalization of the PE (example images shown below graphs). Dextramer labeling at room temperature was then measured, again for 2 hours. At room temperature the intensity of the dextramer PE signal was found to be brighter compared to the 4°C staining condition. Therefore, in order to balance the need for a permissive temperature (above 4°C) for NFAT1 activation and a temperature that would not be detrimental to the labeling of ASTs with dextramers, the room temperature conditions were chosen for subsequent activation experiments.
Figure 3. Analysis of MHC dextramer-induced NFAT1 activation is optimal at room temperature.
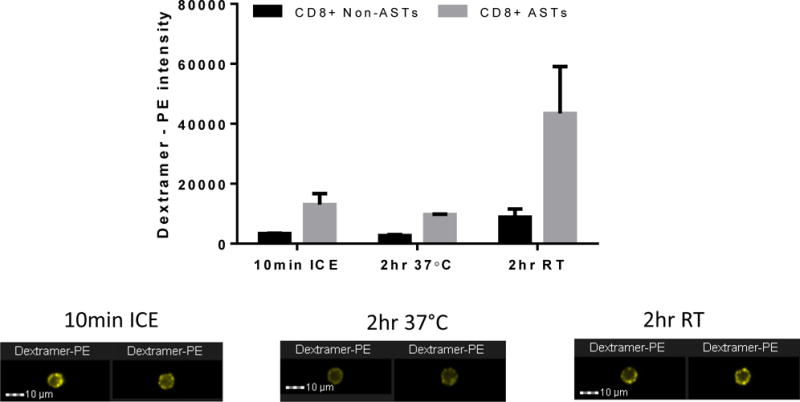
Conventional dextramer staining performed at 4°C for 10 minutes with adequate separation between the positive and negative populations is shown in the left two bars. Staining for 2 hours at 37°C to induce NFAT1 activation is shown in the center two bars and indicates a lack of separation between positive and negative populations. Staining for 2 hours at room temperature to induce NFAT1 activation is shown in the right two bars indicating a better separation of positive and negative than the other two incubation temperatures. Representative images of dextramer positive events for each condition are shown below the graphs. Results are representative of three independent experiments.
MHC dextramer-induced NFAT1 activation in ASTs is maximal at 2 hours and is sufficient to elicit a functional response
Once the optimal temperature condition to stain ASTs with dextramers was determined, a time kinetic study of the effect of dextramer binding on NFAT1 activation was performed over 6 hours (Figure 4A). The results obtained from three independent samples show that following binding of the dextramers there is indeed an activation of NFAT detectable in the targeted ASTs, evident from the increased NFAT1/nuclear similarity score. Significant activation of NFAT1 occurs as early as 10 minutes at room temperature and is sustained until approximately 2 hours after which it declines (black line). By 6 hours incubation the similarity score has almost returned to baseline indicating a decline in activation. The NFAT activity (similarity score) in the CD8+ non-AST, and thus dextramer negative, population did not change significantly over the 6 hours (grey line). These results were highly reproducible in the individuals tested (n=3) with p*<0.01 for all time-points up to 2 hours. Based on the results generated any time-point within the first 2 hours could be chosen for the study. With the knowledge of the potential inter-individual heterogeneity, at least in the enumeration of ASTs, a 2 hour activation of NFAT1 was chosen to increase the likelihood that maximal activation would occur in all subsequent samples. Representative images of CD8+ cells with a range of similarity scores are also shown (Figure 4B).
Figure 4. MHC dextramer-induced NFAT1 activation is maximal at 2 hours and this activation results in IFNγ production.
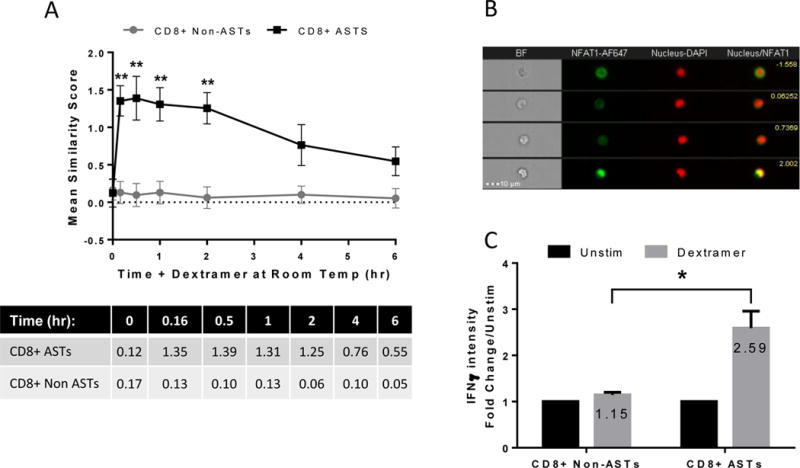
Cells were incubated with dextramer at room temperature for up to 6 hours (A). NFAT1 activation increases significantly after 10 minutes and remains high up until approximately 2 hours. The mean values of each time-point are tabulated below the graph. Representative images of CD8+ cells are shown (B). Each row represents a single event and images from left to right include brightfield (BF), NFAT1-AF647, Nucleus-DAPI, and a composite of the NFAT1-DAPI images with the corresponding similarity score shown in yellow on the upper right. The induced activation results in a functional response with the production of the cytokine, IFNγ after 24 hours at room temperature (C). This functional response is specific to the dextramer positive cells.
Once activation of ASTs by MHC dextramers was shown to be reproducible in multiple (n=5) samples (data not shown), it was then determined whether this accumulation of NFAT1 in the nucleus correlated with a functional response, i.e., cytokine production. Donor cells were incubated with MHC dextramer reagent at room temperature for 24 hours in the presence of Brefeldin A. Interferon gamma (IFNγ) accumulation was measured in both CD8+ non ASTs and ASTs by IFC (Figure 4C). The data indicate that IFNγ accumulation occurs specifically in the CD8+ AST population, but not in the CD8+ non AST population (grey bars). Results are measured as a fold change over the unstimulated population over 24 hours (black bars) and this experiment was performed on 3 independent samples. The fold change is modest reaching a mean of approx. 2.5 fold above the ‘Unstim’ (p*=0.029). This is however reproducible, and is not unexpected due to the relatively low response that would be generated from a single antigen.
Assay is optimal when performed in fresh peripheral blood
In the context of applicability in a retrospective study setting, it was of interest to determine whether activation of NFAT1 by MHC dextramers could be performed on isolated peripheral blood mononuclear cells (PBMCs) so that it may be possible to analyze samples that had been previously cryopreserved.
To compare staining and activation in whole blood versus PBMCs, a sample was divided into two parts. The first part was stained and activated as whole blood (PBL) as optimized in the previous experiments. For the second part, PBMCs were isolated by density centrifugation using histopaque (Sigma-Aldrich) according to manufacturers’ instructions. PBMCs were then incubated in RPMI-1640 containing 10% FBS overnight at 37°C, 5% CO2. The sample staining and activation was then performed on the PBMCs according to the same procedures used for the whole blood sample. Results shown in Figure 5 demonstrate that, as shown previously, in the case of PBL the incubation with dextramers at the permissive room temperature condition results in a brighter staining and activation of NFAT specifically in the targeted cells. In the corresponding PBMC sample however, the baseline NFAT1 activity level is lower in both the AST and non-AST compared to the PBL sample and no activation of NFAT was observed in the AST as a consequence of the dextramer binding. A table enumerating the number of events in each population is shown in Supplementary Table 2. Examples of dextramer staining in the positive populations are shown on the right. A possible explanation for the superior staining and activation in whole blood compared to isolated PBMCs is that the binding of the MHC dextramer to the ASTs is affected by co-factors in the serum of whole blood that are absent in isolated PBMCs. This experiment was performed on three independent occasions and reproducibly found that the dextramer staining in PBL (as recommended by the manufacturer) was superior to staining of PBMCs and that the dextramer-induced NFAT1 activation was only detectable when the assay was performed on PBL and not in PBMCs. The results shown in Figure 5 were chosen since it best illustrates the inferior results of applying the dextramer assay on PBMCs versus PBL. Based on these results, all subsequent experiments were performed on whole blood.
Figure 5. Dextramer staining is optimal when performed in whole blood.
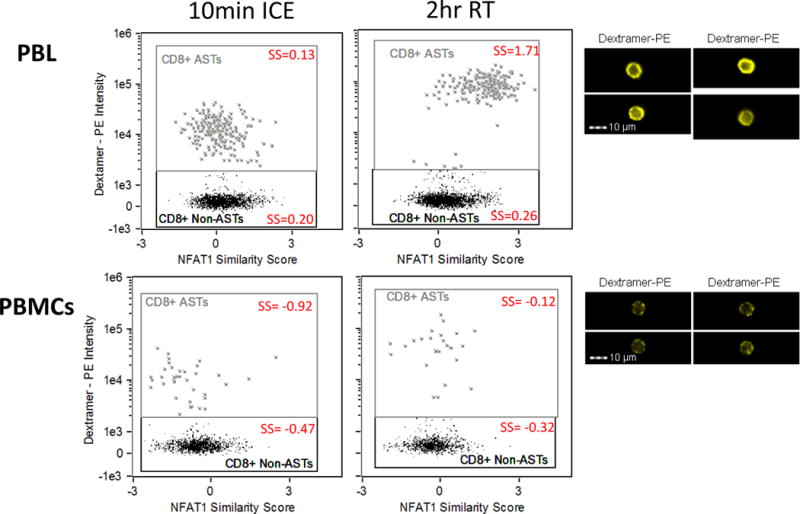
Cells were activated by dextramers in whole blood and in isolated PBMCs from the same blood draw. Upper graphs show the positive CD8+ AST staining and NFAT1 activation when performed in whole blood, with representative of the 2 hour staining images on the right. Lower graphs show the staining preformed in PBMCs and indicate a high background signal in the dextramer negative population and a lack of signal separation between positives and negatives. The mean similarity score (SS) of each population is included (red). Approximately 2500 events in the CD3+CD4-CD8+ population were gated in PBL and 1500 events in the CD3+CD4-CD8+ population were gated in PBMCs. Representative images are shown on the right. Results are representative of three independent experiments.
Activation of ASTs by MHC dextramers is antigen specific
Figure 4 suggests that the activation of ASTs by MHC dextramers is antigen specific but it needs to be ruled out that the lack of an NFAT response in the non-responding cells was not due to the absence of an activation potential in these cells. To confirm this, whole blood was co-stimulated (after dextramer stimulation) with PMA/ionomycin to activate NFAT1 nuclear localization in an antigen-independent manner. PMA/ionomycin causes a calcium ion influx that can stimulate calcineurin-induced NFAT1 activation that bypasses the TCR. PMA/ionomycin caused activation in all cells irrespective of MHC dextramer positivity (Figure 6A). The bar graph shows that in the absence of PMA/ionomycin mix NFAT1 is activated only in the CD8+ AST population (grey bars). In the presence of PMA/ionomycin mix, NFAT1 is activated in both the CD8+ non-ASTs (black bars) and the CD8+ ASTs (grey bars) to the same extent irrespective of the presence of MHC dextramer. This provides further support to the interpretation that the effect of MHC dextramers on NFAT activation is indeed an antigen-specific response. Results are representative of 3 independent experiments. A table of the mean similarity score for each population is shown in Supplementary Table 3.
Figure 6. MHC dextramer-induced NFAT1 activation is antigen-specific.
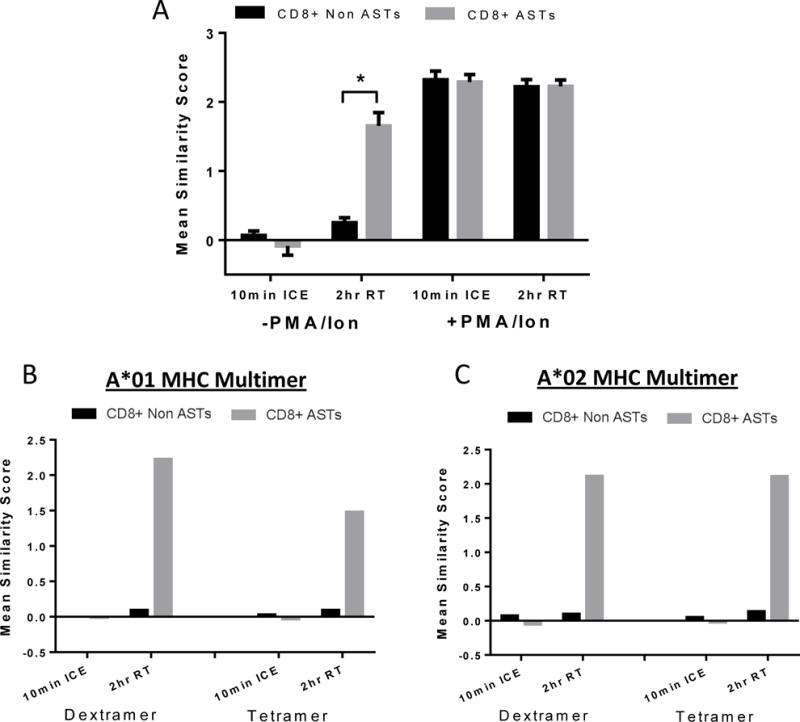
(A) Cells were pre-incubated with dextramer at room temperature for 1.5 hours, and then PMA/ionomycin mix added for the remaining 0.5 hours. The bar graph shows dextramer-induced NFAT1 activation at 2 hours, room temperature specifically in the CD8+ AST population without the addition of PMA/ionomycin. When PMA/ionomycin is added for 30 minutes, activation occurs in both the CD8+ ASTs and CD8+ non ASTs. Results are representative of three independent experiments. (B+C) Samples were incubated with either MHC tetramer or dextramer reagent for either 10 minutes on ice or for 2 hours at room temperature. Activation by A*01 MHC was more pronounced when using the dextramer reagent (B). Both reagents showed a similar activation potential in CASTs when bound to A*02 MHC (C).
Activation of ASTs by MHC dextramers or tetramers is comparable
Results shown thus far are from experiments using MHC dextramer reagents. Part of our validation was a comparison with the tetramer multimers. Tetramers are a four-fold replicate of the MHC-peptide that bind with decreased stability than their dextramer counterparts but are still widely used. We compared the activation potential of NFAT in ASTs using both tetramers and dextramers (Figure 6B and 6C). Results with the A*01 haplotype multimer reagents in the same sample indicate that tetramers can activate signaling to a somewhat similar extent as dextramers but that NFAT1 accumulation in the nucleus following 2 hours at room temperature is lower using the tetramer reagent (B). When comparing these reagents in a sample with a different haplotype (A*02), the results indicate a similar activation for both multimer reagents (C). This suggests that activation may be haplotype-dependent likely based on affinity to the TCR. This was tested in just two samples in the current study and would need further validation in specific systems of interest.
Heterogeneity in AST function is evident in HCT patients
At RPCI, patients who undergo a hematopoietic cell transplant (HCT) are, on occasion, screened for the presence of cytomegalovirus (CMV) antigen specific T cells (CASTs). CMV is present in 50-80% population and is asymptomatic in healthy individuals. In immunocompromised individuals such as those who have received HCTs the presence of CMV could result in a potentially dangerous reactivation of the virus and CMV disease. There is some controversy as to whether detection and enumeration of CASTs is sufficient to predict the chance of CMV reactivation in these patients. We used the assay developed in this study to determine whether functional heterogeneity existed in patients positive for CMV.
Figure 7 shows three representative examples of patients analyzed in this study. All patients in these examples were of the same MHC haplotype (A*02) and therefore the same MHC dextramer reagent was used. The three patients each had different percentages of CASTs and exhibited varying activation of NFAT1. The upper graphs show an example of complete activation of NFAT1 in the vast majority of CASTs following 2 hour incubation at room temperature (A). The middle graphs show an example of a patient where despite the presence of a large percentage of CASTs, there was no activation of the NFAT1 response in the vast majority of CASTs by 2 hours (B). The lower graphs show an example of a patient in which there was approximately 50% heterogeneity of responding and non-responding CASTs (C). The mean NFAT1 similarity score following 2 hour activation in this sample is 0.87. The vertical bars drawn at 0.87 clearly show the ‘incomplete’ activation in this sample. The results from these samples suggest that although the detection and enumeration of CASTs is important, it may not present the full picture of functionality of these ASTs, and that the functionality of the cells may be an important contributing factor to take into account when assessing an individual immunity against a specific antigen. A correlation with clinical outcome of the HCT patients studied was beyond the scope of the present study and would require a multivariate analysis that takes into consideration how the significant antiviral therapies that these patients are treated with would contribute to the functional analysis.
Figure 7. Patient samples show heterogeneity of NFAT1 activation in CMV ASTs.
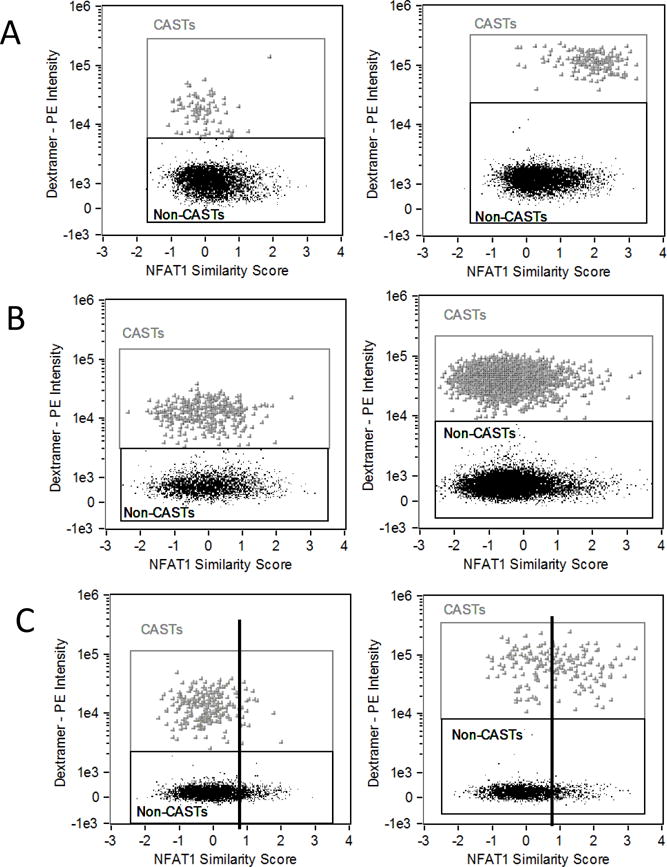
NFAT1 similarity score (SS) in the total CD8 positive population is plotted against dextramer-PE intensity for three patients in three rows. Left graphs show staining and SS following 10 minute dextramer staining at 4°C. Right graphs show staining and SS following 2 hour dextramer staining and activation at room temperature. The upper graphs show that NFAT1 is activated in all CAST cells at 2 hours. The center graphs show a patient sample with no activation of NFAT1 in CASTs at 2 hours. The lower graphs show a heterogeneous response with approximately 50% activation of the CAST population. Vertical bars are drawn at the mean similarity score for the 2 hour sample (0.87) to clearly show 50% activation.
Discussion
The increasing use of flow cytometry in AST enumeration has led to conflicting reports as to whether detection and enumeration of these cells is sufficient to make conclusions on an individual’s immune status [10-14]. In the present study we sought to determine whether MHC dextramers could be used as antigen presentation complexes that elicit a functional response in the form of activation of the NFAT signal transduction pathway in CD8+ ASTs. This functional assay could indicate whether enumeration of ASTs was sufficient, or whether having knowledge of the functional activity of these populations would provide a more comprehensive result. It would also have the potential clinical benefit of being a short assay where results could be generated within hours instead of days for other clinical functional assays.
NFAT activation was measured by nuclear accumulation of the transcription factor by imaging flow cytometry. When using this platform we needed to be sure that any measurements were comparable to those on conventional flow cytometry. This was an important consideration as this is the first report, to our knowledge, of AST detection by multimers using the ImageStream. Our data indicate an expected positive correlation when comparing both techniques. Since the percentage of ASTs can be very low in the effector cell population, a large number of acquired events is necessary, using a highly specific labeling dextramer. IFC has the advantage over FCM that the images of each event can be scrutinized. This makes the identification of false positives in a rare population much easier (example shown in Supplementary Figure 2). We have successfully shown that MHC dextramers can indeed activate NFAT1 in ASTs, and that this activation, in the absence of co-stimulatory factors, can result in a functional response in the form of cytokine production. We show that there is a time-kinetic distribution to this activation as is observed for other antigen-specific responses.
Interestingly, we found that incubation at room temperature gave superior results than incubation at 37°C. Although counter-intuitive for an activation marker, this inferior labeling could be due to the instability of the phycoerythrin (PE) fluorochrome at 37°C. Further studies using unconjugated dextramer for activation are necessary to confirm this. Also counter-intuitive, was the finding that staining and activation of the MHC dextamer positive ASTs was superior in whole blood versus peripheral blood mononuclear cells (PBMCs). Absence of relevant co-factors in the case of PBMCs may be a possible explanation for the observed differences and it would be a worthwhile effort to determine if the addition of for example an anti-CD28 would prove to be beneficial as this would make this analysis applicable in a retrospective setting.
The generation of MHC dextramer technology was a necessity brought about when the MHC tetramer reagents previously developed were proving less than optimal to use when analyzing antigens with a low affinity to the TCR. Despite this caveat, tetramer reagents remain useful in certain research areas and so part of our study included a direct comparison between the two types of reagents. Our results show that both tetramers and dextramers can activate NFAT, at least for the haplotypes tested, to a comparable extent. The reduced activation using tetramer reagent in a sample that was A*01 haplotype may be due to the affinity of the specific reagent to the TCR. A more in-depth study would be needed across all haplotypes if one was to require the use of tetramer reagents. It is our recommendation to use the more efficient dextramer reagents for any functional study, with the estimation that not all haplotypes will activate in the same way. This should be determined for the study being undertaken.
When assessing the patient heterogeneity of NFAT1 activation it was interesting to note that the percentage of CMV specific T cells (CASTs) did not necessarily correlate with functionality of the population. In the examples shown, the sample with the greatest percentage of CASTs had the lowest activation potential. These results reflect the heterogeneity of functional potential of ASTs reported in the literature to date. One possible explanation for this heterogeneity that is currently being investigated in our lab is whether the presence of a certain cytotoxic T cell sub-type affects the functionality of these cells. Specifically, a patient with a majority of terminally differentiated effector cells may exhibit a different functional potential than a patient with a majority of naïve, or memory cells.
In the current study the CMV antigen/dextramers and the NFAT pathway were used as the model systems. Comparable results have been obtained with EBV dextramers in EBV antigen-specific T cells and these data will be included as part of a forthcoming full research paper. This assay has also been extended to include NF-κB/p65 in our hands, and could be used for any transcription factor where nuclear localization is an indication of activation.
Supplementary Material
Acknowledgments
Research sponsored by the NCI Cancer Center Support Grant to the Roswell Park Cancer Institute (CA016056) and NIH 1S10ODOD018048-01 shared instrument grant.
References
- 1.Janeway C. Immunobiology: The Immune System In Health And Disease. Garland Science Taylor & Francis Group; 2005. [Google Scholar]
- 2.Hermann-Kleiter N, Baier G. NFAT pulls the strings during CD4+ T helper cell effector functions. Blood. 2010;115(15):2989–97. doi: 10.1182/blood-2009-10-233585. [DOI] [PubMed] [Google Scholar]
- 3.Batiuk TD, Kung L, Halloran PF. Evidence that calcineurin is rate-limiting for primary human lymphocyte activation. J Clin Invest. 1997;100(7):1894–901. doi: 10.1172/JCI119719. [DOI] [PMC free article] [PubMed] [Google Scholar]
- 4.Fukudo M, Yano I, Masuda S, Okuda M, Inui K. Distinct inhibitory effects of tacrolimus and cyclosporin a on calcineurin phosphatase activity. J Pharmacol Exp Ther. 2005;312(2):816–25. doi: 10.1124/jpet.104.074930. [DOI] [PubMed] [Google Scholar]
- 5.Sommerer C, Meuer S, Zeier M, Giese T. Calcineurin inhibitors and NFAT-regulated gene expression. Clin Chim Acta. 2012;413(17–18):1379–86. doi: 10.1016/j.cca.2011.09.041. [DOI] [PubMed] [Google Scholar]
- 6.Mancini M, Toker A. NFAT proteins: emerging roles in cancer progression. Nat Rev Cancer. 2009;9(11):810–20. doi: 10.1038/nrc2735. [DOI] [PMC free article] [PubMed] [Google Scholar]
- 7.Maguire O, Tornatore KM, O’Loughlin KL, Venuto RC, Minderman H. Nuclear translocation of nuclear factor of activated T cells (NFAT) as a quantitative pharmacodynamic parameter for tacrolimus. Cytometry A. 2013;83(12):1096–104. doi: 10.1002/cyto.a.22401. [DOI] [PMC free article] [PubMed] [Google Scholar]
- 8.Hadrup SR, Bakker AH, Shu CJ, Andersen RS, van Veluw J, Hombrink P, Castermans E, Thor Straten P, Blank C, Haanen JB, et al. Parallel detection of antigen-specific T-cell responses by multidimensional encoding of MHC multimers. Nat Methods. 2009;6(7):520–6. doi: 10.1038/nmeth.1345. [DOI] [PubMed] [Google Scholar]
- 9.Scholler J, Singh M, Bergmeier L, Brunstedt K, Wang Y, Whittall T, Rahman D, Pido-Lopez J, Lehner T. A recombinant human HLA-class I antigen linked to dextran elicits innate and adaptive immune responses. J Immunol Methods. 2010;360(1–2):1–9. doi: 10.1016/j.jim.2010.05.008. [DOI] [PubMed] [Google Scholar]
- 10.Bacher P, Scheffold A. Flow-cytometric analysis of rare antigen-specific T cells. Cytometry A. 2013;83(8):692–701. doi: 10.1002/cyto.a.22317. [DOI] [PubMed] [Google Scholar]
- 11.Gratama JW, Boeckh M, Nakamura R, Cornelissen JJ, Brooimans RA, Zaia JA, Forman SJ, Gaal K, Bray KR, Gasior GH, et al. Immune monitoring with iTAg MHC Tetramers for prediction of recurrent or persistent cytomegalovirus infection or disease in allogeneic hematopoietic stem cell transplant recipients: a prospective multicenter study. Blood. 2010;116(10):1655–62. doi: 10.1182/blood-2010-03-273508. [DOI] [PubMed] [Google Scholar]
- 12.Lacey SF, Martinez J, Gallez-Hawkins G, Thao L, Longmate J, Haq W, Spielberger R, Forman SJ, Zaia JA, Diamond DJ. Simultaneous reconstitution of multiple cytomegalovirus-specific CD8+ cell populations with divergent functionality in hematopoietic stem-cell transplant recipients. J Infect Dis. 2005;191(6):977–84. doi: 10.1086/428136. [DOI] [PubMed] [Google Scholar]
- 13.Laugel B, van den Berg HA, Gostick E, Cole DK, Wooldridge L, Boulter J, Milicic A, Price DA, Sewell AK. Different T cell receptor affinity thresholds and CD8 coreceptor dependence govern cytotoxic T lymphocyte activation and tetramer binding properties. J Biol Chem. 2007;282(33):23799–810. doi: 10.1074/jbc.M700976200. [DOI] [PubMed] [Google Scholar]
- 14.Daniels MA, Devine L, Miller JD, Moser JM, Lukacher AE, Altman JD, Kavathas P, Hogquist KA, Jameson SC. CD8 binding to MHC class I molecules is influenced by T cell maturation and glycosylation. Immunity. 2001;15(6):1051–61. doi: 10.1016/s1074-7613(01)00252-7. [DOI] [PubMed] [Google Scholar]
- 15.Davis MM, Altman JD, Newell EW. Interrogating the repertoire: broadening the scope of peptide-MHC multimer analysis. Nat Rev Immunol. 2011;11(8):551–8. doi: 10.1038/nri3020. [DOI] [PMC free article] [PubMed] [Google Scholar]
- 16.Lee JA, Spidlen J, Boyce K, Cai J, Crosbie N, Dalphin M, Furlong J, Gasparetto M, Goldberg M, Goralczyk EM, et al. MIFlowCyt: the minimum information about a Flow Cytometry Experiment. Cytometry A. 2008;73(10):926–30. doi: 10.1002/cyto.a.20623. [DOI] [PMC free article] [PubMed] [Google Scholar]
- 17.Filby A, Davies D. Reporting imaging flow cytometry data for publication: why mask the detail? Cytometry A. 2012;81(8):637–42. doi: 10.1002/cyto.a.22091. [DOI] [PubMed] [Google Scholar]
- 18.George TC, Fanning SL, Fitzgerald-Bocarsly P, Medeiros RB, Highfill S, Shimizu Y, Hall BE, Frost K, Basiji D, Ortyn WE, et al. Quantitative measurement of nuclear translocation events using similarity analysis of multispectral cellular images obtained in flow. J Immunol Methods. 2006;311(1–2):117–29. doi: 10.1016/j.jim.2006.01.018. [DOI] [PubMed] [Google Scholar]
- 19.Maguire O, Collins C, O’Loughlin K, Miecznikowski J, Minderman H. Quantifying nuclear p65 as a parameter for NF-kappaB activation: Correlation between ImageStream cytometry, microscopy, and Western blot. Cytometry A. 2011;79(6):461–9. doi: 10.1002/cyto.a.21068. [DOI] [PMC free article] [PubMed] [Google Scholar]
- 20.Tario JD, Jr, Chen GL, Hahn TE, Pan D, Furlage RL, Zhang Y, Brix L, Halgreen C, Jacobsen K, McCarthy PL, et al. Dextramer reagents are effective tools for quantifying CMV antigen-specific T cells from peripheral blood samples. Cytometry B Clin Cytom. 2015;88(1):6–20. doi: 10.1002/cyto.b.21196. [DOI] [PMC free article] [PubMed] [Google Scholar]
- 21.Simpson-Abelson MR, Loyall JL, Lehman HK, Barnas JL, Minderman H, O’Loughlin KL, Wallace PK, George TC, Peng P, Kelleher RJ, Jr, et al. Human ovarian tumor ascites fluids rapidly and reversibly inhibit T cell receptor-induced NF-kappaB and NFAT signaling in tumor-associated T cells. Cancer Immun. 2013;13:14. [PMC free article] [PubMed] [Google Scholar]
Associated Data
This section collects any data citations, data availability statements, or supplementary materials included in this article.