Abstract
BACKGROUND. Accumulation of diacylglycerol (DAG) and sphingolipids is thought to promote skeletal muscle insulin resistance by altering cellular signaling specific to their location. However,the subcellular localization of bioactive lipids in human skeletal muscle is largely unknown.
METHODS. We evaluated subcellular localization of skeletal muscle DAGs and sphingolipids in lean individuals (n = 15), endurance-trained athletes (n = 16), and obese men and women with (n = 12) and without type 2 diabetes (n = 15). Muscle biopsies were fractionated into sarcolemmal, cytosolic, mitochondrial/ER, and nuclear compartments. Lipids were measured using liquid chromatography tandem mass spectrometry, and insulin sensitivity was measured using hyperinsulinemic-euglycemic clamp.
RESULTS. Sarcolemmal 1,2-DAGs were not significantly related to insulin sensitivity. Sarcolemmal ceramides were inversely related to insulin sensitivity, with a significant relationship found for the C18:0 species. Sarcolemmal sphingomyelins were also inversely related to insulin sensitivity, with the strongest relationships found for the C18:1, C18:0, and C18:2 species. In the mitochondrial/ER and nuclear fractions, 1,2-DAGs were positively related to, while ceramides were inversely related to, insulin sensitivity. Cytosolic lipids as well as 1,3-DAG, dihydroceramides, and glucosylceramides in any compartment were not related to insulin sensitivity. All sphingolipids but only specific DAGs administered to isolated mitochondria decreased mitochondrial state 3 respiration.
CONCLUSION. These data reveal previously unknown differences in subcellular localization of skeletal muscle DAGs and sphingolipids that relate to whole-body insulin sensitivity and mitochondrial function in humans. These data suggest that whole-cell concentrations of lipids obscure meaningful differences in compartmentalization and suggest that subcellular localization of lipids should be considered when developing therapeutic interventions to treat insulin resistance.
FUNDING. National Institutes of Health General Clinical Research Center (RR-00036), National Institute of Diabetes and Digestive and Kidney Diseases (NIDDK) (R01DK089170), NIDDK (T32 DK07658), and Colorado Nutrition Obesity Research Center (P30DK048520).
Keywords: Endocrinology, Metabolism
Keywords: Diabetes, Mitochondria, Skeletal muscle
Localized lipids in human skeletal muscle predict insulin sensitivity and mitochondrial dysfunction.
Introduction
Insulin resistance is a common feature in the development of type 2 diabetes, yet the mechanisms for this phenomenon remain poorly understood. After a meal, skeletal muscle clears 80% of ingested glucose, and thus insulin resistance in this tissue is a critical determinant of whole-body insulin sensitivity. Excess lipid accumulation in skeletal muscle is associated with insulin resistance, with initial reports highlighting intramuscular triglyceride in the etiology of insulin resistance. However, insulin-desensitizing effects of lipids are now thought to occur from accumulation of lipids, such as diacylglycerols (DAGs) and ceramides, which attenuate insulin signaling via activation of nontypical PKC isoforms, and decreased AKT phosphorylation, respectively (1–9). However, the relative importance of these lipids is debated, as each has been dissociated from insulin resistance in both animals and humans (9–19).
An advance that provides some clarity to this debate is the realization that localization of both DAG and ceramide in muscle may be an important determinant of the ability of these lipids to promote insulin resistance (20–24). This is logical given the diverse ways in which individual organelles impact insulin sensitivity. For example, the sarcolemmal membrane is the primary site of insulin signaling and PKC activation and is susceptible to direct regulation by membrane lipid signaling. Mitochondrial lipids can alter mitochondrial function and reactive oxygen species production, which may have secondary consequences on insulin sensitivity(25). Nuclear lipids alter gene transcription that can effect all aspects of cellular function, including regulation of insulin action (26, 27). Therefore, lipids are expected to influence a diverse range of cellular signals affecting insulin sensitivity that are specific to their cellular location. Despite the potential importance of subcellular localization of lipids in human skeletal muscle, this area remains largely unexplored.
Identifying the subcellular localization of key bioactive lipids is the first step in the discovery of their trafficking, cellular signaling, and metabolic function for the purpose of insulin sensitization and therapeutics. Major aims of the current study were to determine relationships between subcellular localized DAGs and sphingolipids and whole-body insulin sensitivity in humans and to evaluate if cross-sectional relationships could be explained by mechanistic studies in vitro.
Results
We performed a cross-sectional comparison of skeletal muscle lipid localization in 4 groups of individuals spanning a wide range of insulin sensitivities, including (a) endurance-trained athletes (athletes), (b) a sedentary lean control group (lean), (c) sedentary obese people (obese), and (d) individuals with type 2 diabetes (T2D). Individuals were screened, muscle biopsies were performed, and insulin sensitivity was measured using the hyperinsulinemic-euglycemic clamp technique. Muscle biopsies were separated into subcellular fractions using differential centrifugation, with lipidomics performed on each fraction.
Demographics and plasma metabolic markers.
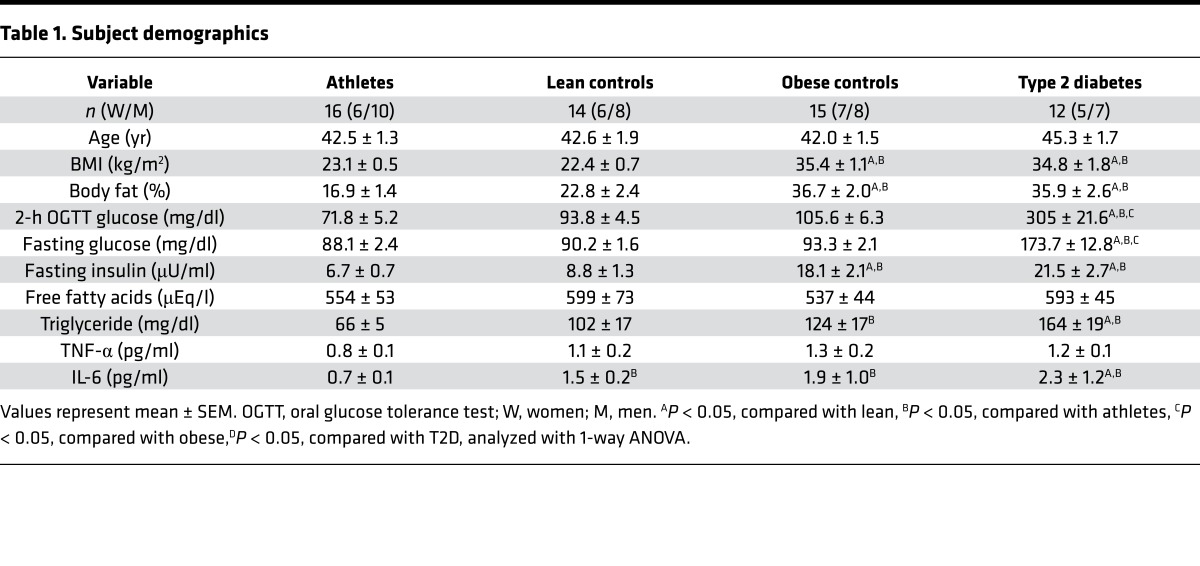
Demographic information for individuals in this study is shown in Table 1. There were 25 women and 33 men in this study, with a similar proportion of each sex in all groups. The mean age was not significantly different among the groups; BMI and percentage body fat were significantly lower in lean and athletes by design. Glucose concentrations after fasting and 2 hours after an oral glucose tolerance test were in the normal range for all individuals other than T2D. Fasting insulin concentrations were significantly greater in obese and T2D compared with lean and athletes. There were no differences in basal TNF-α or free fatty acid (FFA) concentration among the groups. Basal triglyceride and IL-6 concentrations were greater in T2D compared with lean and athletes and greater in obese compared with athletes. The concentration of IL-6 was significantly lower in athletes compared with lean.
Table 1. Subject demographics.
Insulin sensitivity.
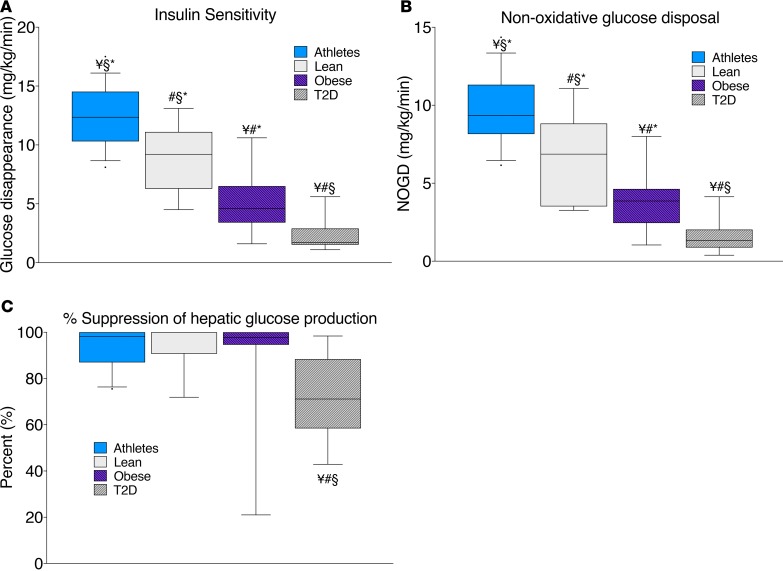
Insulin sensitivity was measured using a standard 3-hour 40 mU/m2/min hyperinsulinemic-euglycemic clamp. The rates of glucose disappearance and nonoxidative glucose disposal, each measured by 6,6 D2-glucose during the insulin clamp, were significantly different among each group and largely reflected differences in muscle disposal (P < 0.001, Figure 1, A and B). Suppression of hepatic glucose production during the clamp was significantly attenuated in T2D compared with all other groups, suggesting hepatic insulin resistance (P = 0.004, Figure 1C). Our 4 groups of volunteers generated a data set with individuals spanning the physiological range of insulin sensitivity.
Figure 1. Hyperinsulinemic-euglycemic clamp measurements in endurance-trained athletes, lean controls, obese individuals, and individuals with type 2 diabetes.
Hyperinsulinemic-euglycemic clamp measurements of insulin sensitivity (A), nonoxidative glucose disposal (B), and percentage suppression of hepatic glucose production (C) in endurance-trained athletes, lean controls, obese individuals, and individuals with type 2 diabetes. The box plot shows the median and 25th and 75th percentiles, and the whiskers represent the 10th and 90th percentiles. n = 16 athletes, 14 lean, 15 obese, and 12 T2D. ¥P < 0.05, compared with lean, #P < 0.05, compared with athletes, §P < 0.05, compared with obese,*P < 0.05, compared with T2D, analyzed with 1-way ANOVA.
Total lipid content.
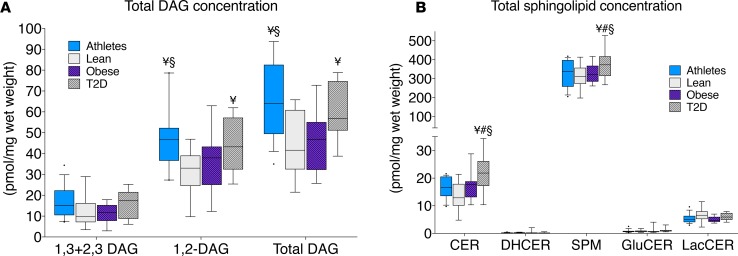
Whole-cell concentrations of lipids are commonly reported; therefore, we have provided these data for direct comparison (Figure 2, A and B). Athletes and T2D had the highest concentration of total DAGs, which is similar to previously published data showing greater DAG content in athletes compared with lean and obese volunteers (13). DAGs exist as several isomers based on the acyl-chain configuration, with only 1,2-DAG thought to decrease insulin sensitivity by activating PKC. However, DAG isomers have not been reported previously in human skeletal muscle. We found that roughly two-thirds of muscle DAGs were the 1,2-isomer, with the remainder being 1,3- and 2,3-DAGs. Only 1,2-DAGs were significantly (P = 0.007) different among groups, which corroborates the idea that only 1,2-DAGs are related to insulin sensitivity in humans. Ceramide and sphingomyelin content were greatest in T2D compared with the other groups (P = 0.01 and P = 0.05, respectively). There were no significant differences in dihydroceramide, glucosylceramide, or lactosylceramide among groups.
Figure 2. Whole-cell skeletal muscle content in endurance-trained athletes, lean controls, obese individuals, and individuals with type 2 diabetes.
Whole-cell skeletal muscle content of DAG isomers (A) and sphingolipids (B) in endurance-trained athletes, lean controls, obese individuals, and individuals with type 2 diabetes. The box plot shows the median and 25th and 75th percentiles, and the whiskers represent the 10th and 90th percentiles. n = 16 athletes, 14 lean, 15 obese, and 12 T2D. CER, ceramides; DHCER, dihydroceramides; SPM, sphingomyelins; GluCER, glucosylceramides; LacCER, lactosylceramides. ¥P < 0.05, compared with lean, §P < 0.05, compared with obese,*P < 0.05, compared with T2D, analyzed with 1-way ANOVA.
Subcellular lipid localization.
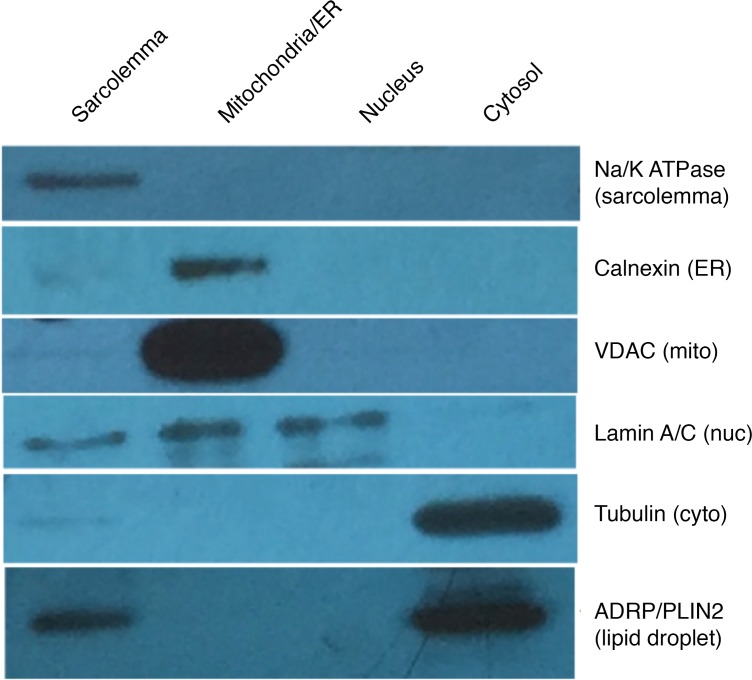
To evaluate the lipid content of different cellular compartments, muscle biopsies were fractionated using differential centrifugation. Enrichment of subcellular fractions was evaluated using Western blots (Figure 3). We achieved separation and enrichment of sarcolemmal, mitochondrial/ER, nuclear, and cytosolic fractions, with a small amount of nuclear contamination of sarcolemmal and mitochondrial/ER fractions. The majority of lipid droplet localization was found in the cytosolic fraction, with some lipid droplet protein in the sarcolemmal fraction.
Figure 3. Western blot showing enrichment of cellular fractions representing the sarcolemmal, mitochondrial/ER, nuclear, and cytosolic compartments.
Sarcolemma.
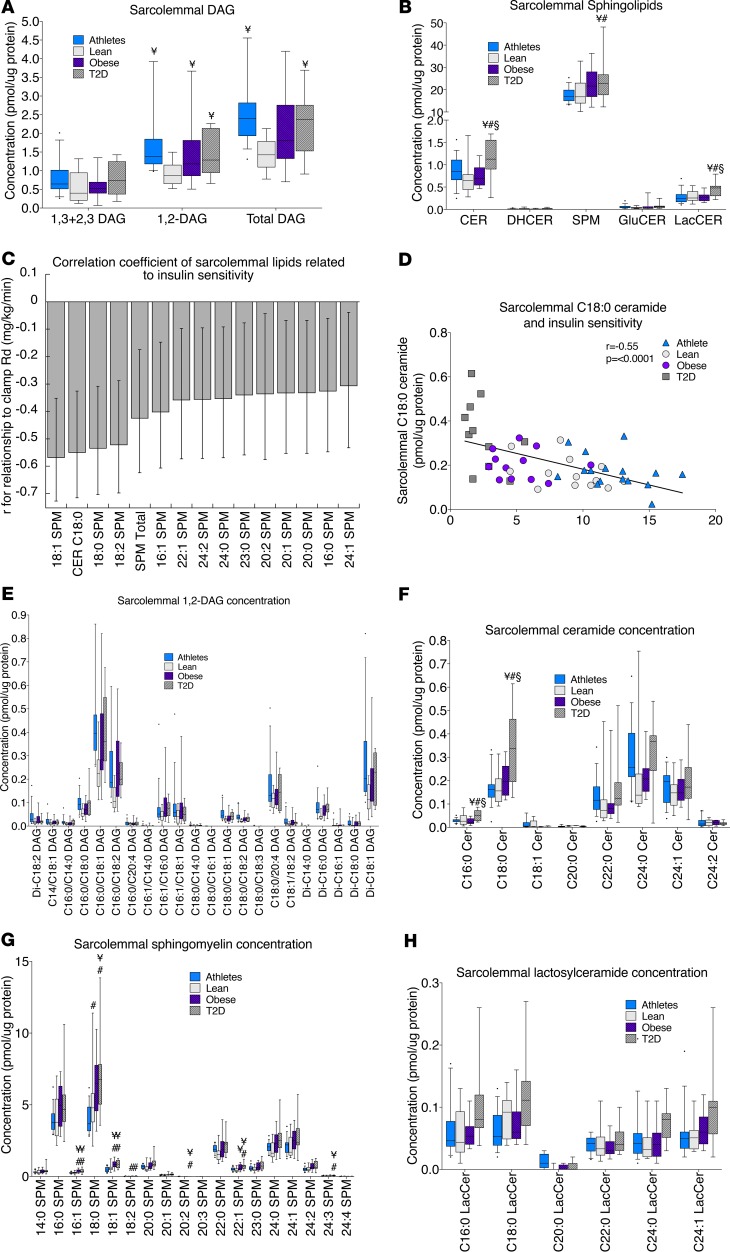
In the sarcolemma, 1,2-DAGs were significantly greater in athletes, obese, and T2D compared with lean, while the distribution of 1,3- and 2,3-DAGs was not significantly different among groups (Figure 4A). Total sarcolemmal DAG was greater in athletes and T2D compared with lean. Excluding athletes, there was an inverse relationship between sarcolemmal disaturated 1,2-DAGs and insulin sensitivity (R2 = 0.39, P = 0.02), which was no longer significant when athletes were included. This suggests that there could be subsarcolemmal compartmentalization of DAGs in athletes that differs compared with other groups and/or suggests the proportion of sarcolemmal DAGs relative to other lipids plays an important role. Ceramide and lactosylceramide content was greatest in the sarcolemma in T2D compared with all other groups, while sarcolemmal sphingomyelin content in T2D was greater than that in lean and athletes (Figure 4B). In the sarcolemma, C18:0 ceramide and specific species of sphingomyelin were significantly inversely related to insulin sensitivity, with the strength of these relationships as well as the 95% confidence intervals shown in Figure 4C and the relationship for C18:0 ceramide shown in Figure 4D. Differences among individual species of 1,2-DAGs, ceramides, sphingomyelins, and lactosylceramides in the sarcolemmal fraction are shown in Figure 4, E–H. To evaluate conversion of sphingomyelin to ceramide via sphingomyelinases, we examined relationships between individual species of these two lipids. In the sarcolemma only, there were significant relationships between C16:0 sphingomyelin and ceramide (P = 0.01) and C18:0 sphingomyelin and ceramide (P = 0.002), consistent with ceramide generation from sphingomyelin degradation.
Figure 4. Sarcolemmal lipid localization in skeletal muscle in endurance-trained athletes, lean controls, obese individuals, and individuals with type 2 diabetes.
Data are shown for DAG concentration (A); sphingolipid concentration (B); relationship of individual lipids to insulin sensitivity, with error bars representing 5% and 95% confidence intervals (C); relationship between C18:0 ceramide and insulin sensitivity (D); 1,2-DAG species (E); ceramide species (F); sphingomyelin species (G); and lactosylceramide species (H). The box plot shows the median and 25th and 75th percentiles, and the whiskers represent the 10th and 90th percentiles. n = 16 athletes, 14 lean, 15 obese, and 12 T2D. Outliers not shown include an athlete with 5.94 pmol 1,2-DAG/μg protein and 6.69 pmol total DAG/μg protein (A) and an athlete with 1.36 pmol C16:0/18:1 DAG/μg protein and 1.02 pmol C16:0/18:2 DAG/μg protein (E). CER, ceramides; DHCER, dihydroceramides; SPM, sphingomyelins; GluCER, glucosylceramides; LacCER, lactosylceramides. ¥P < 0.05, compared with lean, #P < 0.05, compared with athletes, §P < 0.05, compared with obese, analyzed with 1-way ANOVA and corrected for multiple comparisons.
Mitochondria/ER.
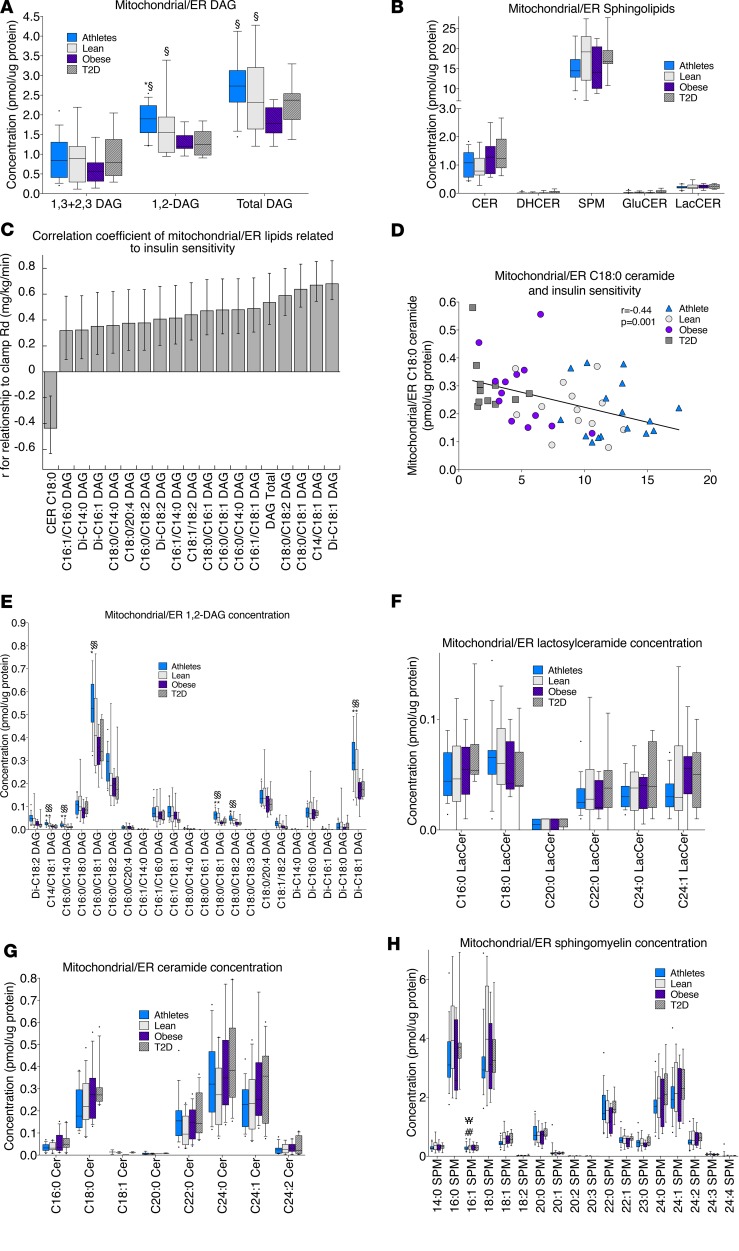
In the mitochondrial/ER fraction, 1,2-DAGs were significantly greater in lean compared with T2D and in athletes compared with obese and T2D (Figure 5A). There were greater total mitochondrial/ER DAGs in lean and athletes compared with obese. There were no significant differences in mitochondrial/ER sphingolipids among groups (Figure 5B), yet mitochondrial/ER C18:0 ceramide was inversely related to insulin sensitivity (Figure 5, C and D). Despite the positive relationships between mitochondrial/ER 1,2-DAGs and insulin sensitivity (Figure 5C), there was an inverse relationship between the proportion of disaturated 1,2-DAGs and insulin sensitivity (R2 = 0.34, P = 0.01), highlighting the potential importance of these specific lipid species. Individual species of 1,2-DAGs, ceramides, sphingomyelin, and lactosylceramides in the mitochondrial/ER compartment are shown in Figure 5, E–H.
Figure 5. Mitochondrial/ER lipid localization in skeletal muscle in endurance-trained athletes, lean controls, obese individuals, and individuals with type 2 diabetes.
Data are shown for DAG concentration (A); sphingolipid concentration (B); relationship of individual lipids to insulin sensitivity, with error bars representing 5% and 95% confidence intervals (C); the relationship between mitochondrial/ER C18:0 ceramide and insulin sensitivity (D); 1,2-DAG species (E); ceramide species (F); sphingomyelin species (G); and lactosylceramide species (H). The box plot shows the median and 25th and 75th percentiles, and the whiskers represent the 10th and 90th percentiles. n = 16 athletes, 14 lean, 15 obese, and 12 T2D. Outliers not shown include an athlete with 31.4 pmol SPM/μg protein (B). CER, ceramides; DHCER, dihydroceramides; SPM, sphingomyelins; GluCER, glucosylceramides; LacCER, lactosylceramides. §P < 0.05, compared with obese,*P < 0.05, compared with T2D, analyzed with 1-way ANOVA and corrected for multiple comparisons.
Nucleus.
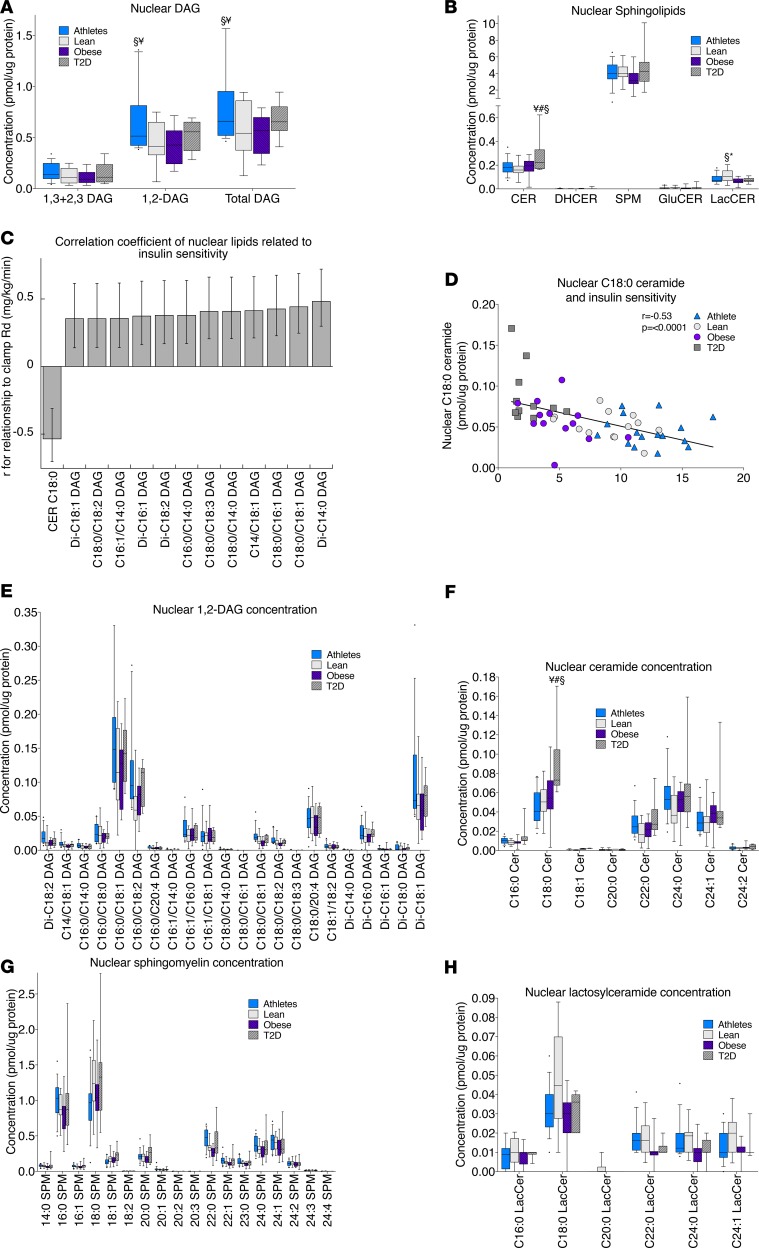
In the nuclear fraction, total DAGs were greater in athletes compared with lean and obese (Figure 6A). Ceramide content was greatest in the nuclear fraction in T2D compared with all other groups, while lactosylceramide content was greatest in lean individuals compared with obese and T2D (Figure 6B). Relationships between nuclear lipids and insulin sensitivity were similar to those observed in the mitochondria/ER, with an inverse relationship found for C18:0 ceramide and positive relationships found for DAGs, as shown in Figure 6, C and D. Individual species of 1,2-DAGs, ceramides, sphingomyelin, and lactosylceramides in the nuclear fraction are shown in Figure 6, E–H.
Figure 6. Nuclear lipid localization in skeletal muscle in endurance-trained athletes, lean controls, obese individuals, and individuals with type 2 diabetes.
Data are shown for DAG concentration (A); sphingolipid concentration (B); relationship of individual lipids to insulin sensitivity, with error bars representing 5% and 95% confidence intervals (C); the relationship between nuclear C18:0 ceramide and insulin sensitivity (D); 1,2-DAG species (E); ceramide species (F); sphingomyelin species (G); and lactosylceramide species (H). The box plot shows the median and 25th and 75th percentiles, and the whiskers represent the 10th and 90th percentiles. n = 16 athletes, 14 lean, 15 obese, and 12 T2D. Outliers not shown include an athlete with 0.38 pmol C16:0/18:1 DAG/μg protein (E). CER, ceramides; DHCER, dihydroceramides; SPM, sphingomyelins; GluCER, glucosylceramides; LacCER, lactosylceramides. ¥P < 0.05, compared with lean, #P < 0.05, compared with athletes, §P < 0.05, compared with obese,*P < 0.05, compared with T2D, analyzed with 1-way ANOVA and corrected for multiple comparisons.
Cytosol.
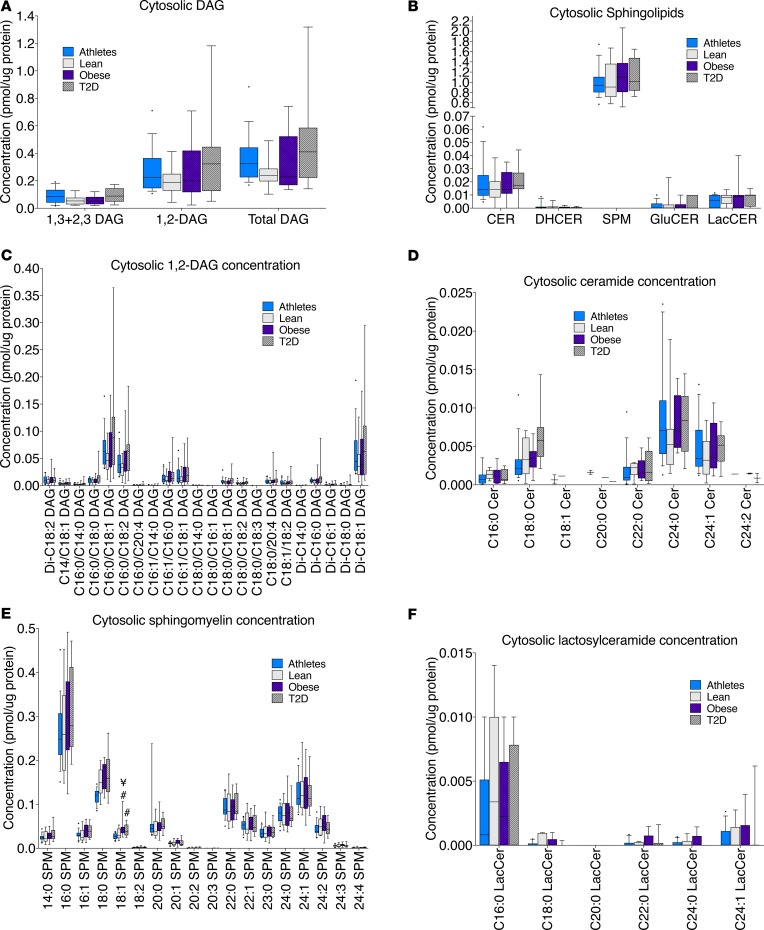
There were no significant differences among groups for cytosolic lipids and no relationships between cytosolic lipids and insulin sensitivity (Figure 7, A and B). Individual species data for 1,2-DAGs, ceramides, sphingomyelin, and lactosylceramides are shown in Figure 7, C–F.
Figure 7. Cytosolic lipid localization in skeletal muscle in endurance-trained athletes, lean controls, obese individuals, and individuals with type 2 diabetes.
Data are shown for DAG concentration (A), sphingolipid concentration (B), 1,2-DAG species, (C) ceramide species (D), sphingomyelin species (E), and lactosylceramide species (F). The box plot shows the median and 25th and 75th percentiles, and the whiskers represent the 10th and 90th percentiles. n = 16 athletes, 14 lean, 15 obese, and 12 T2D. CER, ceramides; DHCER, dihydroceramides; SPM, sphingomyelins; GluCER, glucosylceramides; LacCER, lactosylceramides. ¥P < 0.05, compared with lean, #P < 0.05, compared with athletes, analyzed with 1-way ANOVA and corrected for multiple comparisons
De novo DAG synthesis.
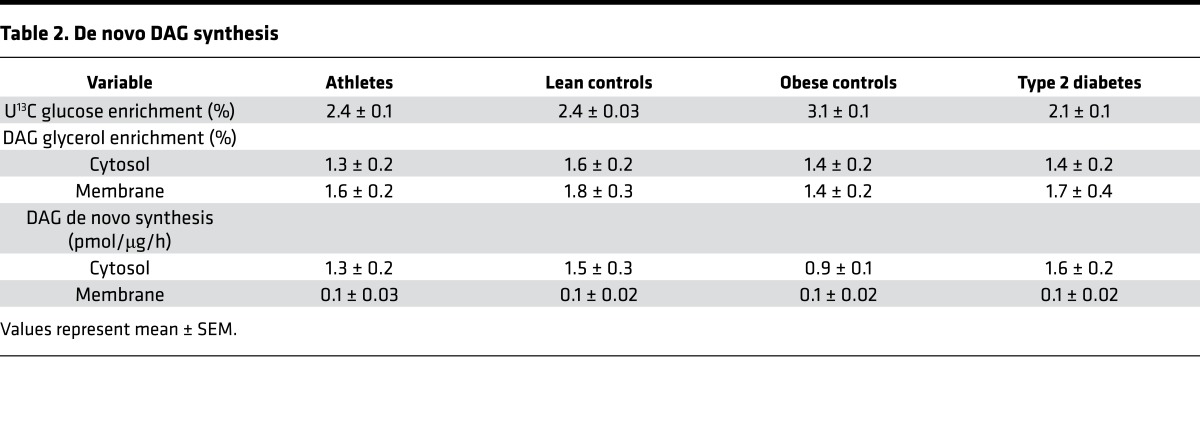
The etiology of DAG accumulation in insulin resistance is not known, but dogma suggests that a mismatch between fatty acid uptake and oxidation is a culprit. We used a [U13Cglucose] isotope infusion to determine if increased de novo DAG synthesis could explain DAG accumulation (28). We found no significant differences in enrichment of the glycerol backbone of DAGs in membrane or cytosolic compartments or membrane and cytosolic de novo DAG synthesis rates among groups (Table 2). These data suggest that alterations in de novo DAG synthesis do not explain 1,2-DAG accumulation, which implicates other pathways, such as phospholipid degradation, and/or alterations in the rate of interconversion between sphingomyelin and ceramide.
Table 2. De novo DAG synthesis.
Protein expression.
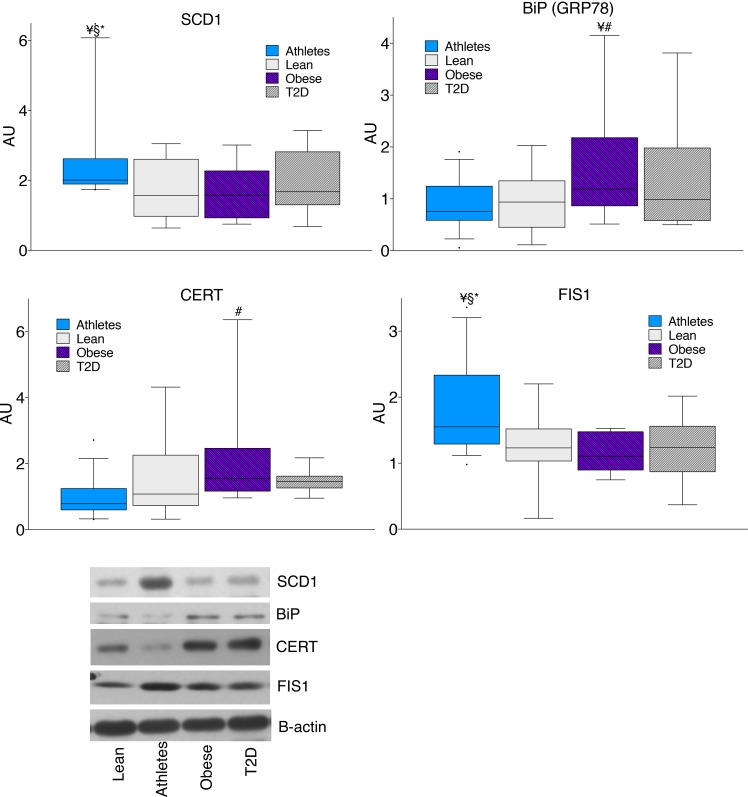
To further investigate differences in the generation of compartment specific lipids, we evaluated enzymes regulating lipid metabolism. We found no differences among groups in enzymes responsible for triglyceride lipolysis (ATGL, CGI58), sphingomyelinases (SMPD3 and SMPD4), or interconversion between phosphatidic acid and DAG (lipin 1, DGKδ). Lipid composition may be influenced by desaturases; one such enzyme, stearoyl-CoA desaturase 1 (SCD1), was significantly greater in athletes compared with the other groups (Figure 8, P = 0.04) and may help explain decreased abundance of saturated lipid species in athletes. The 78-kDa glucose-regulated protein (GRP78) is a marker of ER stress and was significantly greater in obese compared with lean and athletes (P = 0.04). Ceramide can be transported within cells by a transport protein (CERT) that was significantly greater in obese compared with athletes (P = 0.007). The mitochondrial reticulum is dynamic, undergoing constant reorganization that is regulated by fission and fusion events. The content of a mitochondrial fission protein (FIS1) was significantly greater in athletes compared with all 3 other groups (P = 0.04). FIS1 protein content was significantly related to total mitochondrial/ER DAGs (r = 0.41, P = 0.004) as well as other DAG species containing 1 monounsaturated acyl group. These relationships suggest that specific species of mitochondrial DAGs may promote mitochondrial fission and mitochondrial dynamics and may help explain the positive relationship between mitochondrial/ER DAGs and insulin sensitivity.
Figure 8. Skeletal muscle protein content in lean controls, endurance-trained athletes, obese individuals, and individuals with type 2 diabetes.
The box plot shows the median and 25th and 75th percentiles, and the whiskers represent the 10th and 90th percentiles. n = 16 athletes, 14 lean, 15 obese, and 12 T2D. SCD1, stearoyl-CoA desaturase 1; BiP (GRP78), 78-kDa glucose-regulated protein; CERT, ceramide transport protein; FIS1, mitochondrial fission protein 1. ¥P < 0.05, compared with lean, #P < 0.05, compared with athletes, §P < 0.05, compared with obese,*P < 0.05, compared with T2D, analyzed with 1-way ANOVA.
Muscle redox.
Oxidative stress has been implicated in insulin resistance. We found no differences in oxidative stress among groups measured via the GSH/GSSG ratio (P = 0.47; athletes: 47.4 ± 6.4; lean: 48.2 ± 4.8; obese: 43.4 ± 3.8; T2D: 38.2 ± 2.6). However, glutathione content was significantly higher in obese compared with athletes (P = 0.004) and T2D (P = 0.05).
PKC activation.
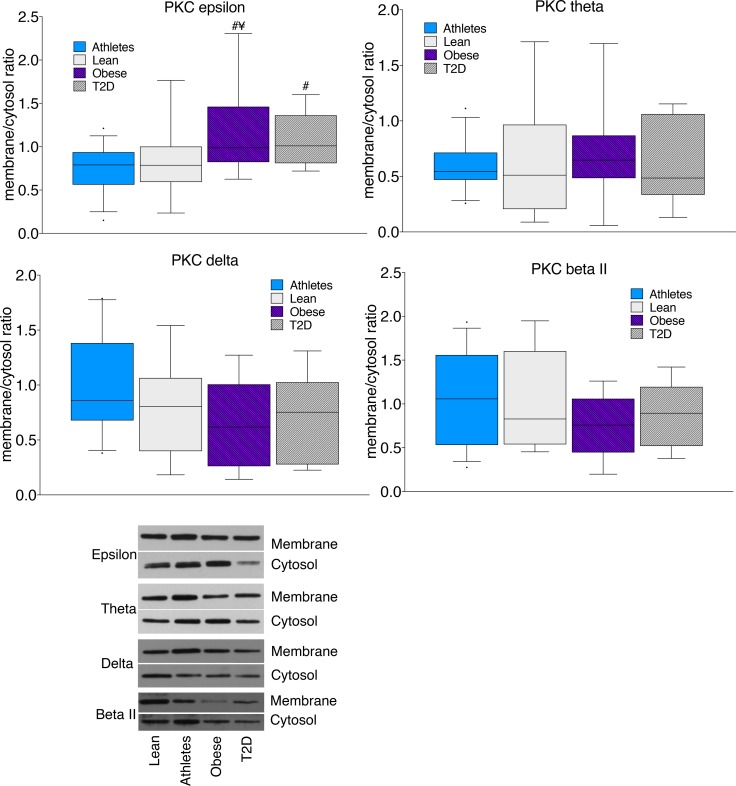
DAGs are thought to promote insulin resistance by activating PKC, which leads to serine phosphorylation and inhibition of insulin receptor substrate 1 in the insulin signaling cascade. We found significantly greater PKCε membrane/cytosol ratios in obese and T2D compared with lean and athletes (P = 0.03), without significant differences for PKCθ, PKCδ, or PKCβII (Figure 9). However, the relationship between localized DAGs and PKC activation is not known. We found a significant positive relationship between PKCε and sarcolemmal 1,2 DAG C16:0/C18:2 (P = 0.03). There were no significant relationships between 1,2-DAGs in any other compartment and PKCε. No significant relationships were found between sarcolemmal 1,2-DAGs and PKCθ, PKCδ, or PKCβII.
Figure 9. Skeletal muscle PKC membrane/cytosol ratios in lean controls, endurance-trained athletes, obese individuals, and individuals with type 2 diabetes.
The box plot shows the median and 25th and 75th percentiles, and the whiskers represent the 10th and 90th percentiles. n = 16 athletes, 14 lean, 15 obese, and 12 T2D, analyzed with 1-way ANOVA. ¥P < 0.05, compared with lean, #P < 0.05, compared with athletes, analyzed with 1-way ANOVA.
Lipids and mitochondrial respiration.
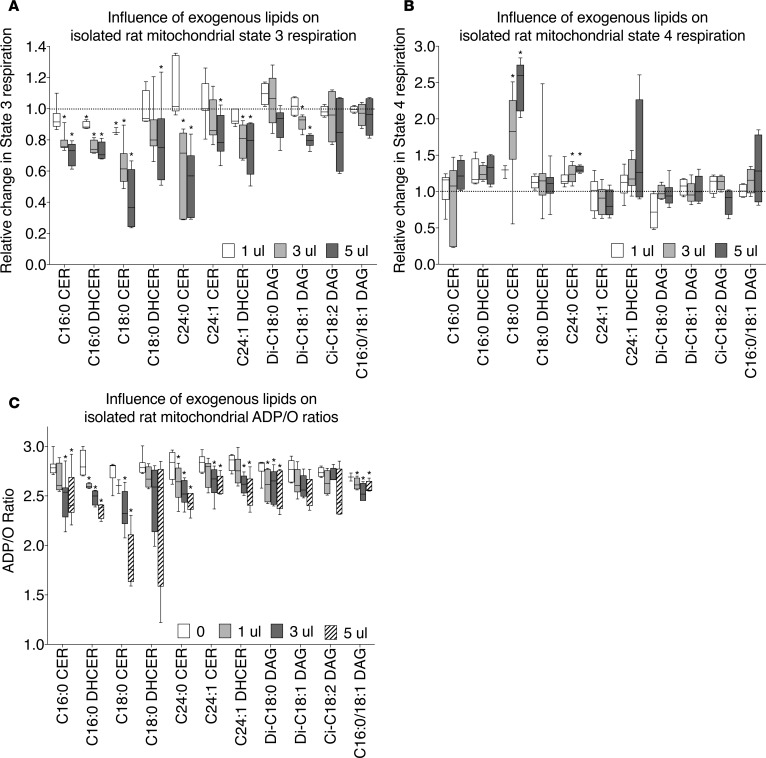
We found mitochondrial/ER accumulation of ceramide that correlated with insulin resistance, suggesting the two may be related. Ceramide can inhibit mitochondrial respiration by decreasing activity of complex 1 and 3 in the electron transport chain as well as by altering membrane structure and permeability (25, 29). However, there are no data in the literature regarding whether this is a generalized ceramide effect or if there are differences among specific species. Our lab and others have reported species-specific accumulation of C16:0 and C18:0 ceramide and di-C18:0 DAG in insulin resistance, which drove us to evaluate whether there are species-specific effects on mitochondrial function (30–34). We found that administering any exogenous ceramide or dihydroceramide species to isolated rat mitochondria significantly decreased ADP-stimulated state 3 respiration (Figure 10A). The response to DAGs were variable, as di-C18:1 1,2-DAG significantly decreased state 3 respiration at moderate to high doses, while other DAG species had no effect (Figure 10A). Only C18:0 and C24:0 ceramides increased state 4 respiration, suggestive of increased proton leak (Figure 10B). All ceramide and dihydroceramide species, other than C18:0 dihydroceramide, as well as di-C18:1 and di-C18:2 DAG decreased ADP/O ratios, suggesting that they may enhance the leak rate of protons and/or reduce coupling between ATP synthesis and oxygen consumption (Figure 10C). These data suggest that even small amounts of mitochondrial ceramide accumulation may decrease mitochondrial function, which may increase oxidative stress and decrease insulin sensitivity (35).
Figure 10. Effect of exogenous lipids on mitochondrial function.
Physiological doses of individual ceramides (1 μl = 0.017, 3 μl = 0.05, 5 μl = 0.083 pmol/μg mitochondrial protein), dihydroceramides (1 μl = 0.0017, 3 μl = 0.005, 5 μl = 0.008 pmol/μg mitochondrial protein), and DAGs (1 μl = 0.07, 3 μl = 0.20, 5 μl = 0.34 pmol/μg mitochondrial protein) were individually administered to isolated rat mitochondria. The changes in (A) state 3 respiration, (B) state 4 respiration, and (C) ADP/O were measured. The box plot shows the median and 25th and 75th percentiles, and the whiskers represent the 10th and 90th percentiles. n = 4–7 for each lipid administered. *P < 0.05, compared with T2D, analyzed with 1-way ANOVA and corrected for multiple comparisons.
Discussion
The accumulation of bioactive lipids such as DAG and sphingolipids have emerged as important mediators of insulin resistance. Recent data indicate lipids related to insulin resistance are located in membranes; however, the exact membranes are unknown, which limits our ability to prevent and treat insulin resistance. We performed this study to measure subcellular skeletal muscle lipid localization to identify specific membranes, species, and isomers related to insulin resistance in humans spanning a wide range of insulin sensitivity. When normalized to protein content, roughly 80%–90% of DAGs and sphingolipids were split between both sarcolemmal and mitochondrial/ER membranes. Approximately two-thirds of cellular DAGs were the 1,2-isoform, and no differences were found among groups for 1,3- and 2,3-DAGs. In the sarcolemma, ceramide and sphingomyelin were inversely related to insulin sensitivity. In the mitochondrial/ER fraction, DAGs were positively related to insulin sensitivity and may influence mitochondrial dynamics and function. Ceramide accumulation in the mitochondria/ER was inversely related to insulin sensitivity and may impede mitochondrial respiration and increase proton leak rate, as evidenced by our findings in vitro. Together, these data advance our knowledge of subcellular distribution of DAGs and sphingolipids that relate to insulin resistance and reveal potential organelle-specific alterations in cell signaling and function that may prove themselves as therapeutic targets.
It is generally accepted that only 1,2-DAGs can activate PKC to induce insulin resistance (36, 37). Our data support this idea, as there were no differences in 1,3- and 2,3-DAGs among groups, despite dramatic differences in insulin sensitivity, and only 1,2-DAGs were significantly related to PKC activation. Our data support the idea that 1,3- and 2,3-DAGs represent a DAG isoform that does not influence insulin sensitivity in humans.
The majority of 1,3- and 2,3-DAGs are thought to arise from ATGL-mediated lipolysis, while 1,2-DAGs are thought to be generated from phospholipid degradation in sarcolemma and de novo synthesis in the ER. It is interesting that all DAG isomers are found in all 4 cellular compartments. This raises the possibility that DAGs may be chaperoned through the polar cytosol via a DAG-binding protein(s). No such protein is known to exist, and it is possible that DAG isomers are distributed throughout the cell only via membrane budding, fusion, and trafficking. However, future discovery efforts may reveal such a DAG-binding protein that could dictate the intracellular localization of DAGs in many tissues.
Sarcolemmal localization of DAGs may drive canonical intracellular signaling. DAGs are thought to promote insulin resistance via activation of novel and conventional PKC isoforms that serine-phosphorylate IRS1 to decrease insulin signaling (38). We measured 4 PKC isoforms, and only found activation of PKCε. Further, only sarcolemmal DAGs related to PKCε activation. However, we cannot rule out that other PKC isoforms were activated in a transitory manner (21). Low sarcolemmal 1,2-DAGs in lean compared with other groups suggest that sarcolemmal 1,2-DAG accumulation is an adaptation to both chronic endurance exercise training as well as obesity. How sarcolemmal DAGs can coexist with dichotomous phenotypes of insulin sensitivity is not entirely clear. It is possible that sarcolemmal DAGs are not related to insulin sensitivity or there is further compartmentalization of specific DAG species into caveoli, T-tubules, and/or membrane lipid domains not captured by our methods that influence DAG-PKC activation.
Sarcolemmal ceramide was strongly related to insulin resistance, with the strongest relationship observed for C18:0 ceramide. These data parallel a recent publication from the Jensen lab that subsarcolemmal ceramides were related to insulin sensitivity in humans (24). Our finding of greater sarcolemmal C16:0 and C18:0 ceramide in T2D is similar to that in previous studies, suggesting that these ceramide species are uniquely negative toward insulin resistance (30–32, 39), and parallel a recent publication by our lab showing that C18:0 muscle ceramides are significantly related to insulin resistance (33). Sarcolemmal C18:0 ceramide may explain the canonical pathways of ceramide-induced insulin resistance, as it antagonizes an inhibitor of protein phosphatase 2A (PP2A), resulting in increased PP2A activity and inhibition of AKT phosphorylation in response to insulin (40). Significant correlations between C16:0 and C18:0 sphingomyelin and ceramide species suggest that sphingomyelin degradation is an important reservoir for sarcolemmal ceramide production. Strong inverse relationships between sarcolemmal sphingomyelin and insulin sensitivity suggest sphingomyelin itself may promote insulin resistance, although there is evidence to the contrary (41).
Regulation of sarcolemmal ceramide formation is relatively unknown. No differences in sphingomyelinase 3 or 4 protein content were found among groups, but sphingomyelinase activity may regulate local ceramide synthesis. Sphingomyelinase activity is stimulated by TNF-μ and oxidized LDL and inhibited by intracellular glutathione (42). We did not find significant differences in TNF-μ and found increased glutathione content in obesity, suggesting these are unlikely mechanisms for enhanced sphingomyelinase activity. Previous studies reported that obese individuals with or without type 2 diabetes have greater oxidized LDL (43), which could explain increased sarcolemmal sphingomyelinase activity and ceramide formation in insulin resistance. It is also possible that oxidized LDL simply reflects alterations in redox state in insulin resistance. Oxidative stress can increase plasma membrane trafficking and activity of sphingomyelinase, which could also explain increased sarcolemmal ceramide formation (44). These data suggest that targeted inhibition of sarcolemmal sphingomyelinases could be an effective mechanism to decrease sarcolemmal ceramide, especially C16:0 and C18:0 species, to increase insulin sensitivity.
Sarcolemmal accumulation of lactosylceramide in T2D is another observation in this study. Muscle lactosylceramide content is positively related to insulin resistance and decreases after 6 months of insulin-sensitizing caloric restriction in rodents (45). Lactosylceramides are precursors for ganglioside formation, which promote insulin resistance in animal models (46). Sarcolemmal lactosylceramide accumulation in insulin resistance in this study is consistent with the notion that gangliosides are predominately localized to the plasma membrane (47). Our data suggest sarcolemmal lactosylceramide may also be implicated in the sequelae of insulin resistance.
One of the most surprising findings in this study was mitochondrial/ER accumulation of 1,2-DAGs in insulin-sensitive individuals. These data do not corroborate the general view that all cellular DAGs promote insulin resistance. It is possible that mitochondrial DAG accumulation is an adaptation to physical activity or endurance training and could explain reports showing increased whole-cell DAG concentration in athletes (13) and no change in whole-cell DAGs after exercise training (16). It is important to note that a greater proportion of mitochondrial/ER disaturated 1,2-DAGs was inversely related to insulin sensitivity. These data suggest that, in addition to localization, DAG composition influences insulin sensitivity, but the exact mechanisms explaining this phenomenon are not known. Futures studies need to be performed to evaluate the change in intracellular 1,2-DAG localization and composition after insulin-sensitizing lifestyle interventions.
There are several possibilities why mitochondrial/ER DAGs may accumulate in insulin-sensitive individuals. One possibility is that greater rates of TAG synthesis in insulin-sensitive individuals result in greater ER DAG (48, 49). If true, this would suggest increased 1,2-DAGs localized in the ER do not attenuate insulin sensitivity. However, we found no differences in DAG de novo synthesis among groups, suggesting increased TAG synthesis is not likely to explain mitochondrial/ER DAG accumulation. Mitochondria also contain the enzymes to convert phosphatidic acid to 1,2-DAG and do so in response to oxidative stress (50, 51). Basal markers of oxidative stress were not different among groups, suggesting that this is also not a likely explanation. However, exercise increases oxidative stress acutely and, thus, could contribute to mitochondrial 1,2-DAG accumulation. While the mechanism explaining an increase in mitochondrial/ER DAGs cannot be identified here, an increased abundance of DAGs in the mitochondrial membranes may promote mitochondrial fission and fusion. Mitochondrial fission and fusion are critical in the maintenance of the mitochondrial network (52), and lipids are known to regulate these processes (53, 54). DAG organization in membranes allows for extreme membrane curvature required for the pinching off and separation of membranes as well as the transition states needed for membrane fusion (52, 55). A significant relationship between total mitochondrial/ER DAGs and FIS1 suggests a relationship between mitochondrial/ER DAGs and mitochondrial fission. Analyses of species revealed that only unsaturated DAGs were related to FIS1, suggesting that if mitochondrial DAGs promote membrane fission, the unsaturated species may promote greater membrane fluidity and/or have a 3-dimensional confirmation promoting acute membrane angles. Increased membrane folding and convolution from increased 1,2-DAG content may also allow increased mitochondrial cristae density and would also be consistent with increased mitochondrial/ER DAGs in insulin sensitivity. Consistent with this idea, athletes have greater mitochondrial cristae density compared with obese individuals with and without type 2 diabetes (56). Further, whole-body lipin 1 knockout decreased muscle DAG concentration and resulted in disordered mitochondria with poor mitochondrial function (57), and membrane DAG accumulation in mice was recently linked with increased mitochondrial biogenesis and oxidative capacity (51). These observations lead to the idea that mitochondrial DAG accumulation promotes increased mitochondrial biogenesis, cristae density, oxidative capacity, and function and may help explain increased DAG content observed in athletes (13).
To our knowledge, these are the first data reporting mitochondrial/ER sphingolipid content in humans spanning a range of insulin sensitivity, with C18:0 ceramide inversely related to insulin sensitivity. There are several potential mechanisms that could explain greater ceramide in this location. Degradation of mitochondrial sphingomyelin is not a likely explanation for mitochondrial/ER ceramide accumulation, as there were no differences in mitochondrial sphingomyelin content among groups, no relationships between mitochondrial sphingomyelin and ceramide species, and no differences in the protein expression of ER-localized neutral sphingomyelinase 3 (SMPD4). However, inflammation is commonly observed in insulin resistance and can stimulate mitochondrial ceramide synthesis and accumulation (58). Mitochondrial ceramide formation has also been reported by a reverse reaction neutral ceramidase in liver (59). While the mechanism for mitochondrial ceramide accumulation is not known, animal data show that ceramide inhibits complex 1 and 3 of the electron transport chain, providing a potential mechanism for their influence on skeletal muscle metabolic function (25, 29). Our data in isolated muscle mitochondria corroborate ceramide inhibition of mitochondrial respiration and show that this phenomenon is true for many species. Importantly, inhibition of mitochondrial respiration was specific for ceramides and dihydroceramides and was not a global effect of adding lipids to isolated mitochondria. Our data are consistent with direct inhibition of complexes in the electron transport chain. However, ceramide may become incorporated into mitochondrial membranes, altering membrane fluidity and increasing the rate of proton leak. Therefore, accumulation of small amounts of mitochondrial/ER ceramide impairs mitochondrial function, which could increase oxidative stress and insulin resistance (35, 60).
Nuclear lipid localization is relatively unstudied in humans. In smooth muscle, ceramides inhibit nuclear protein import and proliferation (61). If nuclear ceramides play this role in skeletal muscle, the effects would be more pronounced in T2D, who had greater total nuclear ceramides compared with the other 3 groups. We found that total nuclear DAGs were greater in athletes. It is known that nuclear DAGs regulate the cell cycle (62), with nuclear DAGs and PKCα accumulation during cell proliferation (63, 64). Nuclear DAGs may be increased in athletes during recovery from endurance exercise under the control of IGF-1. Acute exercise has variable effects on plasma IGF-1 in untrained individuals, but acute exercise in athletes increases plasma IGF-1 (65, 66). IGF-1 activates a nuclear phosphoinositidase C that increases nuclear DAGs without altering whole-cell content in Swiss 3T3 cells (64, 67). Therefore, it is possible that nuclear DAG accumulation in athletes helps promote muscle proliferation and recovery from exercise.
Another possibility is that nuclear DAGs may be ligands promoting PPARα activation. ATGL-mediated lipolysis is required for activation of PPARα and PGC1α, consistent with FFA or DAG derivatives, such as prostaglandins, leukotriene B4, and phospholipids, serving as PPAR ligands (26, 27). Though fatty acids are the purported nuclear ligands promoting PPARα activation (68), the possibility that DAGs themselves may also be a nuclear lipid ligand cannot be excluded. This contention is not without precedent, as there are other lipids that act as nuclear ligands, including acyl-CoA and glycerol-phospholipids (69, 70). The potential role of DAGs as a nuclear ligand capable of influencing gene transcription is ripe for future investigation.
In summary, to our knowledge this is the first report of subcellular DAG and sphingolipid localization in relation to insulin sensitivity in human skeletal muscle. We studied individuals across the metabolic spectrum, with a 6-fold variation in insulin sensitivity. In the sarcolemma, we found sphingomyelin and ceramides were inversely related to insulin sensitivity, while sarcolemmal 1,2-DAG accumulation related to PKCε activation. We also found sarcolemmal ceramide, sphingomyelin, and lactosylceramide accumulation in insulin-resistant individuals, with a strong inverse relationship of C18:0 ceramide and insulin sensitivity. In the mitochondrial/ER fraction, 1,2-DAGs were greater in insulin-sensitive individuals and this may relate to alterations in mitochondrial dynamics, structure, and/or function. Mitochondrial/ER ceramides were increased in individuals with low insulin sensitivity and were found to decrease mitochondrial function when administered in vitro to isolated rat muscle mitochondria. Combined, these data indicate that whole-cell content of DAGs and sphingolipids oversimplifies the complexity of how these bioactive lipids promote decreased insulin sensitivity in human skeletal muscle. Lipid species localized in various cell organelles affect insulin sensitivity, likely through different mechanisms. These data suggest that altering specific localized lipid species in skeletal muscle may provide novel targets for preventing and treating insulin resistance in humans.
Methods
Subjects.
Fourteen lean sedentary controls (lean), sixteen lean athletes, fifteen sedentary obese controls (obese), and twelve T2D were recruited for this study. Subjects were excluded if they had a BMI <20 kg/m2 or >25 kg/m2 for lean and athletes; a BMI <30 or >40 kg/m2 for obese and T2D; had fasting triglycerides >150 mg/dl; or had liver, kidney, thyroid, or lung disease. Sedentary subjects were engaged in planned physical activity <2 hours per week. Endurance athletes were masters athletes training for cycling and triathlon competitions. T2D were excluded from the study if they used insulin and/or thiazolidinediones. All other medications were permissible but were washed out for 2 weeks prior to metabolic testing. These medications included metformin (n = 4), sitagliptin (n = 2), sitagliptin/metformin (n = 2), glimepiride (n = 1), glyburide (n = 1), glipizide (n = 1), and liraglutide (n = 2). None of the obese, lean, or athletes were taking medications. Subjects were weight stable in the 6 months prior to the study.
Preliminary testing.
Following a 12-hour overnight fast, subjects reported to the Clinical Translational Research Center, where they were given a health and physical examination, followed by a fasting blood draw, and a standard 75-g oral glucose tolerance test to verify glucose tolerance. Body composition was determined using DEXA analysis (Lunar DPX-IQ, Lunar Corporation).
Diet and exercise control.
Diet was not controlled in this study to avoid confounding from acute dietary changes on muscle lipid composition. Subjects were asked to refrain from planned physical activity for 48 hours before the metabolic study.
Insulin clamp study.
Volunteers spend the night at the Clinical Translational Research Center to ensure compliance with the overnight fast. After a 12-hour overnight fast, an antecubital vein in one arm was cannulated for infusions of glucose stable isotopes, insulin, and “spiked” dextrose, and a retrograde dorsal hand vein in the contralateral side was catheterized for blood sampling via the heated hand technique. A primed continuous infusion of [6,6-2H2]glucose and [U13-C]glucose was initiated at 0.04 mg/kg/min and continued throughout a 2-hour equilibrium period and the 3-hour insulin clamp. Blood samples for determination of baseline hormone and substrate concentrations were drawn during the final 30 minutes of the 2-hour tracer equilibration before the clamp. After 2 hours of tracer equilibration, a percutaneous needle biopsy (~150 mg) was taken from midway between the greater trochanter of the femur and the patella. Muscle was immediately flash frozen in liquid nitrogen and stored at –80°C until analysis. Skeletal muscle samples were dissected free of extramuscular fat on ice as previously described (71). The [U13-C]glucose infusion was used to measure de novo DAG synthesis and was stopped after the first biopsy. A hyperinsulinemic-euglycemic clamp was then initiated and continued for the next 3 hours using the method of DeFronzo et al. (72). Briefly, a primed continuous infusion of insulin was administered at 40 mU/m2/min for 3 hours. A variable infusion of 20% dextrose was infused to maintain blood glucose approximately 90 mg/dl. The dextrose infusion used to maintain euglycemia was labeled with [6,6-2H2]glucose (Cambridge Isotope Labs) to maintain stable enrichment of plasma glucose (73). Arterialized blood was sampled every 5 minutes for bedside determination of glucose concentration (Analox), and the dextrose infusion was adjusted as necessary. During the last 30 minutes of the clamp, measurements of respiratory gas exchange were made via indirect calorimetry, and arterialized blood was taken for hormone for substrate measurements.
Substrate and hormone analyses.
Standard enzymatic assays were used to measure glucose and triglycerides (Olympus AU400e Chemistry analyzer, Olympus America Inc.), lactate (MilliporeSigma, 826), glycerol (r-Biopharm), and FFAs (NEFA Kit, Wako). Plasma insulin and glucagon were measured using a radioimmunoassay (Diagnostic Systems Laboratories Inc.), and TNF-α and IL-6 were measured using high-sensitivity ELISA (R&D Systems Inc.).
Muscle fractionation.
Muscle biopsies were homogenized using a Teflon-glass homogenizer for 1 minute on ice at 600 rpm in fractionation buffer (250 mM sucrose; 5 mM MgCl2; 1 mM EDTA; 20 mM Tris-Cl; 40 mM KCl, pH 7.4). Samples were then centrifuged for 1 hour at 100,000 g, and the supernatant containing the cytosolic compartment was saved. The pellet was resuspended in 1 ml of the fractionation buffer and placed on ice for 30 minutes. The sample was then loaded on top of an Optiprep gradient containing 5 ml of 16%, 1.5 ml of 20%, 1.5 ml of 25%, and 2 ml of 30% Optiprep buffer diluted with fractionation buffer. The gradient was then spun using an NVT65 rotor at 60,000 g for 1 hour at 4°C. The top 3 ml containing the sarcolemmal fraction was saved, the next 1.5 ml was not saved, the next 3 ml contained the mitochondrial/ER fraction, and the final 2 ml above the 30% Optiprep buffer that contained the nuclear fraction was collected. Aliquots of each fraction were saved and run for protein content.
Lipidomics analysis.
Fractions containing cytosolic, sarcolemmal, mitochondrial/ER, and nuclear fractions were all collected and brought to 3-ml total volume, and then 1.5 ml MeOH and 5 ml MTBE were added. Then, an internal standard cocktail was added, and samples were lipid extracted. The top fraction containing the lipids was saved, and the lipid extraction was repeated. DAG and sphingolipid species were analyzed by an Agilent 1100 HPLC connected to an API 2000 triple quadrupole mass spectrometer (74). The 1,3- and 1,2-DAG isomers were separated chromatographically using a Hilic 2.1 micron, 3 × 100 mm column. Concentration was determined by comparing ratios of unknowns to di-C15:0 DAG and C12:0 sphingolipids and comparing these with standard curves representing the majority of DAG and sphingolipid species run with each sample set.
De novo DAG synthesis.
Muscle biopsies were fractionated into membrane and cytosolic compartments as previously described (34). Lipids were extracted, and DAG was isolated using solid-phase extraction as previously described (75). The isolated DAG fraction was transesterified using Na-methoxide, which generates fatty acid methyl esters that were extracted with hexane. The remaining polar phase contains the DAG glycerol backbone, which was derivatized using the triacetate derivative and analyzed for 13C enrichment using GC/MS as previously described (76).
Western blotting.
To measure muscle signaling, 20 μg sample protein was run on an SDS-PAGE 8% Bis-Tris gel (Invitrogen), transferred to a polyvinylidene fluoride membrane, and blocked with 5% BSA. Primary antibodies were from Cell Signaling (SCD1, cs2438; BiP, cs3183; PKCe, cs2683; PKCd, cs2058; ATGL, cs 2138; Lipin 1, cs5195), Santa Cruz (FIS1, sc376447; PKCt, sc1875; PKC BII, sc210), Abcam (CERT, ab72536; SMPD4, ab107760), Abgent Inc. (DKGδ, AP8126b), R&D Systems Inc. (SMPD3, AF7184), and Novus Biologicals (CGI-58, 110-41576). HRP-conjugated secondary antibody and enhanced chemiluminescence was used to visualize protein bands of interest. Intensity of protein bands was captured using an AlphaImager 3300 and quantified using FluorChem software (Alpha Innotech Corp.).
Cellular redox.
Glutathione and oxidized glutathione content were measured in muscle homogenates using standard metabolomics methods as previously described (77).
PKC activity.
PKC activity was estimated using the membrane/cytosol ratio of PKC isoforms as previously described (34).
Mitochondrial function.
Mitochondria were isolated from rat skeletal muscle as previously described (78), and respiration was measured using a Clarke electrode (Strathkelvin) using standard methods. Briefly, maximal (state 3) and resting (state 4) respiration and the ADP/O ratio were determined in the presence of 1 mM pyruvate plus 1 mM malate. State 3 respiration was elicited with the addition of a 200 nmol bolus of ADP (0.2 mM final concentration). Following an initial experiment performed with pyruvate plus malate, the individual lipid species were then titrated into the chamber for a total of 1, 3, and 5 μl of lipids, spanning the physiological range for ceramides (1 μl = 0.017, 3 μl = 0.05, 5 μl = 0.083 pmol/μg mitochondrial protein), dihydroceramides (1 μl = 0.0017, 3 μl = 0.005, 5 μl = 0.008 pmol/μg mitochondrial protein), and DAGs (1 μl = 0.07, 3 μl = 0.20, 5 μl = 0.34 pmol/μg mitochondrial protein). State 3, state 4, and ADP/O were determined following each successive addition of the individual lipid species. Ceramides were administered in isopropanol and DAG in DMSO. Control experiments were performed to evaluate the influence of the lipid carrier solvents on mitochondrial function.
Statistics.
Data are presented as mean ± SEM. Differences in normally distributed data among groups were analyzed using a 1-way ANOVA (SPSS). Nonnormally distributed data were log transformed prior to analysis. Significant differences in individual lipid species among groups were adjusted for multiple comparisons using the Benjamini-Hochberg procedure. When significant differences were detected, groups were compared using 2-tailed Student’s t tests. Significant relationships between localized lipids and insulin sensitivity were determined using Pearson’s correlation coefficient and were adjusted for multiple comparisons using the Benjamini-Hochberg procedure. Mitochondrial respiration measures were analyzed using mixed models, with repeated measures adjusted for multiple comparisons using the Benjamini-Hochberg procedure and significant differences compared with baseline evaluated using Dunnett’s comparison. A P value of less than 0.05 was considered significant.
Study approval.
This human study was reviewed and approved by the Colorado Multiple Institution Review Board (University of Colorado Anschutz Medical Campus). All subjects provided written informed consent prior to participation in the study.
Author contributions
BCB is the guarantor of this work and, as such, had full access to all the data in the study and takes responsibility for the integrity of the data and the accuracy of the data analysis. LP helped design the study, provided medical oversight, performed all biopsies, and helped interpret the data and write the manuscript. SAN performed subject testing, Western blot analysis, interpreted data, and edited the manuscript. AS helped develop the subcellular fractionation protocol, performed Western blots, helped with subject testing, and edited the manuscript. AK performed subject testing, performed Western blots, analyzed samples, and edited the manuscript. DEK performed mitochondrial isolations and all mitochondrial respiration experiments and edited the manuscript. KAH developed the lipidomics methods and performed lipidomics analysis on all samples. JKSB helped with statistical analysis for the entire study and edited the manuscript. TN and AD performed the muscle metabolomics analyses and edited the manuscript. MRJ and PSM assisted with mitochondrial isolation and respiration studies and edited the manuscript. BCB designed the study, performed subject testing, analyzed and interpreted data, and helped write the manuscript.
Supplementary Material
Acknowledgments
This work was partially supported by the National Institutes of Health General Clinical Research Center (RR-00036), NIDDK (R01DK089170 to BCB), NIDDK (T32DK07658 to Nancy Krebs, University of Colorado Anschutz Medical Campus), and the Colorado Nutrition Obesity Research Center (P30DK048520).
Version 1. 02/08/2018
Electronic publication
Footnotes
Conflict of interest: The authors have declared that no conflict of interest exists.
Reference information: JCI Insight. 2018;3(3):e96805. https://doi.org/10.1172/jci.insight.96805.
Contributor Information
Leigh Perreault, Email: Leigh.Perreault@ucdenver.edu.
Sean A. Newsom, Email: sean.newsom@oregonstate.edu.
Allison Strauss, Email: Allison.Strauss@ucdenver.edu.
Anna Kerege, Email: Akerege@gmail.com.
Travis Nemkov, Email: TRAVIS.NEMKOV@UCDENVER.EDU.
Angelo D’Alessandro, Email: ANGELO.DALESSANDRO@UCDENVER.EDU.
Matthew R. Jackman, Email: Matthew.Jackman@ucdenver.edu.
References
- 1.Adams JM, et al. Ceramide content is increased in skeletal muscle from obese insulin-resistant humans. Diabetes. 2004;53(1):25–31. doi: 10.2337/diabetes.53.1.25. [DOI] [PubMed] [Google Scholar]
- 2.Turinsky J, O’Sullivan DM, Bayly BP. 1,2-Diacylglycerol and ceramide levels in insulin-resistant tissues of the rat in vivo. J Biol Chem. 1990;265(28):16880–16885. [PubMed] [Google Scholar]
- 3.Moro C, et al. Influence of gender, obesity, and muscle lipase activity on intramyocellular lipids in sedentary individuals. J Clin Endocrinol Metab. 2009;94(9):3440–3447. doi: 10.1210/jc.2009-0053. [DOI] [PMC free article] [PubMed] [Google Scholar]
- 4.Straczkowski M, et al. Increased skeletal muscle ceramide level in men at risk of developing type 2 diabetes. Diabetologia. 2007;50(11):2366–2373. doi: 10.1007/s00125-007-0781-2. [DOI] [PubMed] [Google Scholar]
- 5.Avignon A, et al. Chronic activation of protein kinase C in soleus muscles and other tissues of insulin-resistant type II diabetic Goto-Kakizaki (GK), obese/aged, and obese/Zucker rats. A mechanism for inhibiting glycogen synthesis. Diabetes. 1996;45(10):1396–1404. doi: 10.2337/diab.45.10.1396. [DOI] [PubMed] [Google Scholar]
- 6.Schmitz-Peiffer C, Oakes ND, Browne CL, Kraegen EW, Biden TJ. Reversal of chronic alterations of skeletal muscle protein kinase C from fat-fed rats by BRL-49653. Am J Physiol. 1997;273(5 Pt 1):E915–E921. doi: 10.1152/ajpendo.1997.273.5.E915. [DOI] [PubMed] [Google Scholar]
- 7.Schmitz-Peiffer C, et al. Alterations in the expression and cellular localization of protein kinase C isozymes epsilon and theta are associated with insulin resistance in skeletal muscle of the high-fat-fed rat. Diabetes. 1997;46(2):169–178. doi: 10.2337/diab.46.2.169. [DOI] [PubMed] [Google Scholar]
- 8.Griffin ME, et al. Free fatty acid-induced insulin resistance is associated with activation of protein kinase C theta and alterations in the insulin signaling cascade. Diabetes. 1999;48(6):1270–1274. doi: 10.2337/diabetes.48.6.1270. [DOI] [PubMed] [Google Scholar]
- 9.Itani SI, Ruderman NB, Schmieder F, Boden G. Lipid-induced insulin resistance in human muscle is associated with changes in diacylglycerol, protein kinase C, and IkappaB-alpha. Diabetes. 2002;51(7):2005–2011. doi: 10.2337/diabetes.51.7.2005. [DOI] [PubMed] [Google Scholar]
- 10.Bruce CR, et al. Endurance training in obese humans improves glucose tolerance and mitochondrial fatty acid oxidation and alters muscle lipid content. Am J Physiol Endocrinol Metab. 2006;291(1):E99–E107. doi: 10.1152/ajpendo.00587.2005. [DOI] [PubMed] [Google Scholar]
- 11.Dubé JJ, et al. Effects of weight loss and exercise on insulin resistance, and intramyocellular triacylglycerol, diacylglycerol and ceramide. Diabetologia. 2011;54(5):1147–1156. doi: 10.1007/s00125-011-2065-0. [DOI] [PMC free article] [PubMed] [Google Scholar]
- 12.Coen PM, et al. Insulin resistance is associated with higher intramyocellular triglycerides in type I but not type II myocytes concomitant with higher ceramide content. Diabetes. 2010;59(1):80–88. doi: 10.2337/db09-0988. [DOI] [PMC free article] [PubMed] [Google Scholar]
- 13.Amati F, et al. Skeletal muscle triglycerides, diacylglycerols, and ceramides in insulin resistance: another paradox in endurance-trained athletes? Diabetes. 2011;60(10):2588–2597. doi: 10.2337/db10-1221. [DOI] [PMC free article] [PubMed] [Google Scholar]
- 14.Coen PM, et al. Exercise and weight loss improve muscle mitochondrial respiration, lipid partitioning, and insulin sensitivity after gastric bypass surgery. Diabetes. 2015;64(11):3737–3750. doi: 10.2337/db15-0809. [DOI] [PMC free article] [PubMed] [Google Scholar]
- 15.Dubé JJ, Amati F, Stefanovic-Racic M, Toledo FG, Sauers SE, Goodpaster BH. Exercise-induced alterations in intramyocellular lipids and insulin resistance: the athlete’s paradox revisited. Am J Physiol Endocrinol Metab. 2008;294(5):E882–E888. doi: 10.1152/ajpendo.00769.2007. [DOI] [PMC free article] [PubMed] [Google Scholar]
- 16.Devries MC, et al. Endurance training modulates intramyocellular lipid compartmentalization and morphology in skeletal muscle of lean and obese women. J Clin Endocrinol Metab. 2013;98(12):4852–4862. doi: 10.1210/jc.2013-2044. [DOI] [PubMed] [Google Scholar]
- 17.Helge JW, Dobrzyn A, Saltin B, Gorski J. Exercise and training effects on ceramide metabolism in human skeletal muscle. Exp Physiol. 2004;89(1):119–127. doi: 10.1113/expphysiol.2003.002605. [DOI] [PubMed] [Google Scholar]
- 18.Hoy AJ, et al. Lipid and insulin infusion-induced skeletal muscle insulin resistance is likely due to metabolic feedback and not changes in IRS-1, Akt, or AS160 phosphorylation. Am J Physiol Endocrinol Metab. 2009;297(1):E67–E75. doi: 10.1152/ajpendo.90945.2008. [DOI] [PMC free article] [PubMed] [Google Scholar]
- 19.Frangioudakis G, Ye JM, Cooney GJ. Both saturated and n-6 polyunsaturated fat diets reduce phosphorylation of insulin receptor substrate-1 and protein kinase B in muscle during the initial stages of in vivo insulin stimulation. Endocrinology. 2005;146(12):5596–5603. doi: 10.1210/en.2005-0481. [DOI] [PubMed] [Google Scholar]
- 20.Jocken JW, et al. Insulin-mediated suppression of lipolysis in adipose tissue and skeletal muscle of obese type 2 diabetic men and men with normal glucose tolerance. Diabetologia. 2013;56(10):2255–2265. doi: 10.1007/s00125-013-2995-9. [DOI] [PMC free article] [PubMed] [Google Scholar]
- 21.Szendroedi J, et al. Role of diacylglycerol activation of PKCθ in lipid-induced muscle insulin resistance in humans. Proc Natl Acad Sci USA. 2014;111(26):9597–9602. doi: 10.1073/pnas.1409229111. [DOI] [PMC free article] [PubMed] [Google Scholar]
- 22.Nowotny B, et al. Mechanisms underlying the onset of oral lipid-induced skeletal muscle insulin resistance in humans. Diabetes. 2013;62(7):2240–2248. doi: 10.2337/db12-1179. [DOI] [PMC free article] [PubMed] [Google Scholar]
- 23.van Blitterswijk WJ, van der Luit AH, Veldman RJ, Verheij M, Borst J. Ceramide: second messenger or modulator of membrane structure and dynamics? Biochem J. 2003;369(Pt 2):199–211. doi: 10.1042/BJ20021528. [DOI] [PMC free article] [PubMed] [Google Scholar]
- 24.Chung JO, Koutsari C, Blachnio-Zabielska AU, Hames KC, Jensen MD. Intramyocellular ceramides: Subcellular concentrations and fractional de novo synthesis in postabsorptive humans. Diabetes. 2017;66(8):2082–2091. doi: 10.2337/db17-0082. [DOI] [PMC free article] [PubMed] [Google Scholar]
- 25.Di Paola M, Cocco T, Lorusso M. Ceramide interaction with the respiratory chain of heart mitochondria. Biochemistry. 2000;39(22):6660–6668. doi: 10.1021/bi9924415. [DOI] [PubMed] [Google Scholar]
- 26.Haemmerle G, et al. ATGL-mediated fat catabolism regulates cardiac mitochondrial function via PPAR-α and PGC-1. Nat Med. 2011;17(9):1076–1085. doi: 10.1038/nm.2439. [DOI] [PMC free article] [PubMed] [Google Scholar]
- 27.Devchand PR, Keller H, Peters JM, Vazquez M, Gonzalez FJ, Wahli W. The PPARalpha-leukotriene B4 pathway to inflammation control. Nature. 1996;384(6604):39–43. doi: 10.1038/384039a0. [DOI] [PubMed] [Google Scholar]
- 28.Craven PA, Davidson CM, DeRubertis FR. Increase in diacylglycerol mass in isolated glomeruli by glucose from de novo synthesis of glycerolipids. Diabetes. 1990;39(6):667–674. doi: 10.2337/diab.39.6.667. [DOI] [PubMed] [Google Scholar]
- 29.Gudz TI, Tserng KY, Hoppel CL. Direct inhibition of mitochondrial respiratory chain complex III by cell-permeable ceramide. J Biol Chem. 1997;272(39):24154–24158. doi: 10.1074/jbc.272.39.24154. [DOI] [PubMed] [Google Scholar]
- 30.Tonks KT, et al. Skeletal muscle and plasma lipidomic signatures of insulin resistance and overweight/obesity in humans. Obesity (Silver Spring) 2016;24(4):908–916. doi: 10.1002/oby.21448. [DOI] [PMC free article] [PubMed] [Google Scholar]
- 31.Raichur S, et al. CerS2 haploinsufficiency inhibits β-oxidation and confers susceptibility to diet-induced steatohepatitis and insulin resistance. Cell Metab. 2014;20(4):687–695. doi: 10.1016/j.cmet.2014.09.015. [DOI] [PubMed] [Google Scholar]
- 32.Turpin SM, et al. Obesity-induced CerS6-dependent C16:0 ceramide production promotes weight gain and glucose intolerance. Cell Metab. 2014;20(4):678–686. doi: 10.1016/j.cmet.2014.08.002. [DOI] [PubMed] [Google Scholar]
- 33.Bergman BC, et al. Muscle sphingolipids during rest and exercise: a C18:0 signature for insulin resistance in humans. Diabetologia. 2016;59(4):785–798. doi: 10.1007/s00125-015-3850-y. [DOI] [PubMed] [Google Scholar]
- 34.Bergman BC, Hunerdosse DM, Kerege A, Playdon MC, Perreault L. Localisation and composition of skeletal muscle diacylglycerol predicts insulin resistance in humans. Diabetologia. 2012;55(4):1140–1150. doi: 10.1007/s00125-011-2419-7. [DOI] [PMC free article] [PubMed] [Google Scholar]
- 35.Anderson EJ, et al. Mitochondrial H2O2 emission and cellular redox state link excess fat intake to insulin resistance in both rodents and humans. J Clin Invest. 2009;119(3):573–581. doi: 10.1172/JCI37048. [DOI] [PMC free article] [PubMed] [Google Scholar]
- 36.Boni LT, Rando RR. The nature of protein kinase C activation by physically defined phospholipid vesicles and diacylglycerols. J Biol Chem. 1985;260(19):10819–10825. [PubMed] [Google Scholar]
- 37.Rando RR, Young N. The stereospecific activation of protein kinase C. Biochem Biophys Res Commun. 1984;122(2):818–823. doi: 10.1016/S0006-291X(84)80107-2. [DOI] [PubMed] [Google Scholar]
- 38.Schmitz-Peiffer C, Biden TJ. Protein kinase C function in muscle, liver, and beta-cells and its therapeutic implications for type 2 diabetes. Diabetes. 2008;57(7):1774–1783. doi: 10.2337/db07-1769. [DOI] [PMC free article] [PubMed] [Google Scholar]
- 39.Holloway GP, Han XX, Jain SS, Bonen A, Chabowski A. Chronic muscle stimulation improves insulin sensitivity while increasing subcellular lipid droplets and reducing selected diacylglycerol and ceramide species in obese Zucker rats. Diabetologia. 2014;57(4):832–840. doi: 10.1007/s00125-014-3169-0. [DOI] [PubMed] [Google Scholar]
- 40.Mukhopadhyay A, et al. Direct interaction between the inhibitor 2 and ceramide via sphingolipid-protein binding is involved in the regulation of protein phosphatase 2A activity and signaling. FASEB J. 2009;23(3):751–763. doi: 10.1096/fj.08-120550. [DOI] [PMC free article] [PubMed] [Google Scholar]
- 41.Park M, et al. A role for ceramides, but not sphingomyelins, as antagonists of insulin signaling and mitochondrial metabolism in C2C12 myotubes. J Biol Chem. 2016;291(46):23978–23988. doi: 10.1074/jbc.M116.737684. [DOI] [PMC free article] [PubMed] [Google Scholar]
- 42.Adada M, Luberto C, Canals D. Inhibitors of the sphingomyelin cycle: Sphingomyelin synthases and sphingomyelinases. Chem Phys Lipids. 2016;197:45–59. doi: 10.1016/j.chemphyslip.2015.07.008. [DOI] [PubMed] [Google Scholar]
- 43.Njajou OT, et al. Association between oxidized LDL, obesity and type 2 diabetes in a population-based cohort, the health, aging and body composition study. Diabetes Metab Res Rev. 2009;25(8):733–739. doi: 10.1002/dmrr.1011. [DOI] [PMC free article] [PubMed] [Google Scholar]
- 44.Levy M, Castillo SS, Goldkorn T. nSMase2 activation and trafficking are modulated by oxidative stress to induce apoptosis. Biochem Biophys Res Commun. 2006;344(3):900–905. doi: 10.1016/j.bbrc.2006.04.013. [DOI] [PMC free article] [PubMed] [Google Scholar]
- 45.Obanda DN, Yu Y, Wang ZQ, Cefalu WT. Modulation of sphingolipid metabolism with calorie restriction enhances insulin action in skeletal muscle. J Nutr Biochem. 2015;26(7):687–695. doi: 10.1016/j.jnutbio.2015.01.007. [DOI] [PMC free article] [PubMed] [Google Scholar]
- 46.Yamashita T, et al. Enhanced insulin sensitivity in mice lacking ganglioside GM3. Proc Natl Acad Sci USA. 2003;100(6):3445–3449. doi: 10.1073/pnas.0635898100. [DOI] [PMC free article] [PubMed] [Google Scholar]
- 47.Lipina C, Hundal HS. Ganglioside GM3 as a gatekeeper of obesity-associated insulin resistance: Evidence and mechanisms. FEBS Lett. 2015;589(21):3221–3227. doi: 10.1016/j.febslet.2015.09.018. [DOI] [PubMed] [Google Scholar]
- 48.Bergman BC, Perreault L, Hunerdosse DM, Koehler MC, Samek AM, Eckel RH. Increased intramuscular lipid synthesis and low saturation relate to insulin sensitivity in endurance-trained athletes. J Appl Physiol. 2010;108(5):1134–1141. doi: 10.1152/japplphysiol.00684.2009. [DOI] [PMC free article] [PubMed] [Google Scholar]
- 49.Perreault L, Bergman BC, Hunerdosse DM, Playdon MC, Eckel RH. Inflexibility in intramuscular triglyceride fractional synthesis distinguishes prediabetes from obesity in humans. Obesity (Silver Spring) 2010;18(8):1524–1531. doi: 10.1038/oby.2009.454. [DOI] [PMC free article] [PubMed] [Google Scholar]
- 50.Cowell CF, Döppler H, Yan IK, Hausser A, Umezawa Y, Storz P. Mitochondrial diacylglycerol initiates protein-kinase D1-mediated ROS signaling. J Cell Sci. 2009;122(Pt 7):919–928. doi: 10.1242/jcs.041061. [DOI] [PMC free article] [PubMed] [Google Scholar]
- 51.Selathurai A, et al. The CDP-ethanolamine pathway regulates skeletal muscle diacylglycerol content and mitochondrial biogenesis without altering insulin sensitivity. Cell Metab. 2015;21(5):718–730. doi: 10.1016/j.cmet.2015.04.001. [DOI] [PubMed] [Google Scholar]
- 52.Archer SL. Mitochondrial dynamics--mitochondrial fission and fusion in human diseases. N Engl J Med. 2013;369(23):2236–2251. doi: 10.1056/NEJMra1215233. [DOI] [PubMed] [Google Scholar]
- 53.Ha EE, Frohman MA. Regulation of mitochondrial morphology by lipids. Biofactors. 2014;40(4):419–424. doi: 10.1002/biof.1169. [DOI] [PMC free article] [PubMed] [Google Scholar]
- 54.Frohman MA. Role of mitochondrial lipids in guiding fission and fusion. J Mol Med. 2015;93(3):263–269. doi: 10.1007/s00109-014-1237-z. [DOI] [PMC free article] [PubMed] [Google Scholar]
- 55.Domart MC, et al. Acute manipulation of diacylglycerol reveals roles in nuclear envelope assembly & endoplasmic reticulum morphology. PLoS One. 2012;7(12):e51150. doi: 10.1371/journal.pone.0051150. [DOI] [PMC free article] [PubMed] [Google Scholar]
- 56.Nielsen J, et al. Plasticity in mitochondrial cristae density allows metabolic capacity modulation in human skeletal muscle. J Physiol (Lond) 2017;595(9):2839–2847. doi: 10.1113/JP273040. [DOI] [PMC free article] [PubMed] [Google Scholar]
- 57.Zhang P, Verity MA, Reue K. Lipin-1 regulates autophagy clearance and intersects with statin drug effects in skeletal muscle. Cell Metab. 2014;20(2):267–279. doi: 10.1016/j.cmet.2014.05.003. [DOI] [PMC free article] [PubMed] [Google Scholar]
- 58.Yu J, et al. JNK3 signaling pathway activates ceramide synthase leading to mitochondrial dysfunction. J Biol Chem. 2007;282(35):25940–25949. doi: 10.1074/jbc.M701812200. [DOI] [PubMed] [Google Scholar]
- 59.Novgorodov SA, et al. Novel pathway of ceramide production in mitochondria: thioesterase and neutral ceramidase produce ceramide from sphingosine and acyl-CoA. J Biol Chem. 2011;286(28):25352–25362. doi: 10.1074/jbc.M110.214866. [DOI] [PMC free article] [PubMed] [Google Scholar]
- 60.Kelley DE, He J, Menshikova EV, Ritov VB. Dysfunction of mitochondria in human skeletal muscle in type 2 diabetes. Diabetes. 2002;51(10):2944–2950. doi: 10.2337/diabetes.51.10.2944. [DOI] [PubMed] [Google Scholar]
- 61.Faustino RS, et al. Ceramide regulation of nuclear protein import. J Lipid Res. 2008;49(3):654–662. doi: 10.1194/jlr.M700464-JLR200. [DOI] [PubMed] [Google Scholar]
- 62.Topham MK, Bunting M, Zimmerman GA, McIntyre TM, Blackshear PJ, Prescott SM. Protein kinase C regulates the nuclear localization of diacylglycerol kinase-zeta. Nature. 1998;394(6694):697–700. doi: 10.1038/29337. [DOI] [PubMed] [Google Scholar]
- 63.Banfić H, Zizak M, Divecha N, Irvine RF. Nuclear diacylglycerol is increased during cell proliferation in vivo. Biochem J. 1993;290(Pt 3):633–636. doi: 10.1042/bj2900633. [DOI] [PMC free article] [PubMed] [Google Scholar]
- 64.Divecha N, Banfić H, Irvine RF. The polyphosphoinositide cycle exists in the nuclei of Swiss 3T3 cells under the control of a receptor (for IGF-I) in the plasma membrane, and stimulation of the cycle increases nuclear diacylglycerol and apparently induces translocation of protein kinase C to the nucleus. EMBO J. 1991;10(11):3207–3214. doi: 10.1002/j.1460-2075.1991.tb04883.x. [DOI] [PMC free article] [PubMed] [Google Scholar]
- 65.Chicharro JL, et al. Effects of an endurance cycling competition on resting serum insulin-like growth factor I (IGF-I) and its binding proteins IGFBP-1 and IGFBP-3. Br J Sports Med. 2001;35(5):303–307. doi: 10.1136/bjsm.35.5.303. [DOI] [PMC free article] [PubMed] [Google Scholar]
- 66.Koziris LP, et al. Serum levels of total and free IGF-I and IGFBP-3 are increased and maintained in long-term training. J Appl Physiol. 1999;86(4):1436–1442. doi: 10.1152/jappl.1999.86.4.1436. [DOI] [PubMed] [Google Scholar]
- 67.Martelli AM, Gilmour RS, Bertagnolo V, Neri LM, Manzoli L, Cocco L. Nuclear localization and signalling activity of phosphoinositidase C beta in Swiss 3T3 cells. Nature. 1992;358(6383):242–245. doi: 10.1038/358242a0. [DOI] [PubMed] [Google Scholar]
- 68.Zechner R, et al. FAT SIGNALS--lipases and lipolysis in lipid metabolism and signaling. Cell Metab. 2012;15(3):279–291. doi: 10.1016/j.cmet.2011.12.018. [DOI] [PMC free article] [PubMed] [Google Scholar]
- 69.Hertz R, Magenheim J, Berman I, Bar-Tana J. Fatty acyl-CoA thioesters are ligands of hepatic nuclear factor-4alpha. Nature. 1998;392(6675):512–516. doi: 10.1038/33185. [DOI] [PubMed] [Google Scholar]
- 70.Krylova IN, et al. Structural analyses reveal phosphatidyl inositols as ligands for the NR5 orphan receptors SF-1 and LRH-1. Cell. 2005;120(3):343–355. doi: 10.1016/j.cell.2005.01.024. [DOI] [PubMed] [Google Scholar]
- 71.Guo Z, Mishra P, Macura S. Sampling the intramyocellular triglycerides from skeletal muscle. J Lipid Res. 2001;42(7):1041–1048. [PubMed] [Google Scholar]
- 72.DeFronzo RA, Tobin JD, Andres R. Glucose clamp technique: a method for quantifying insulin secretion and resistance. Am J Physiol. 1979;237(3):E214–E223. doi: 10.1152/ajpendo.1979.237.3.E214. [DOI] [PubMed] [Google Scholar]
- 73.Finegood DT, Bergman RN, Vranic M. Estimation of endogenous glucose production during hyperinsulinemic-euglycemic glucose clamps. Comparison of unlabeled and labeled exogenous glucose infusates. Diabetes. 1987;36(8):914–924. doi: 10.2337/diab.36.8.914. [DOI] [PubMed] [Google Scholar]
- 74.Bielawski J, Szulc ZM, Hannun YA, Bielawska A. Simultaneous quantitative analysis of bioactive sphingolipids by high-performance liquid chromatography-tandem mass spectrometry. Methods. 2006;39(2):82–91. doi: 10.1016/j.ymeth.2006.05.004. [DOI] [PubMed] [Google Scholar]
- 75.Bergman BC, Perreault L, Hunerdosse DM, Koehler MC, Samek AM, Eckel RH. Intramuscular lipid metabolism in the insulin resistance of smoking. Diabetes. 2009;58(10):2220–2227. doi: 10.2337/db09-0481. [DOI] [PMC free article] [PubMed] [Google Scholar]
- 76.Bergman BC, et al. The importance of palmitoleic acid to adipocyte insulin resistance and whole-body insulin sensitivity in type 1 diabetes. J Clin Endocrinol Metab. 2013;98(1):E40–E50. doi: 10.1210/jc.2012-2892. [DOI] [PMC free article] [PubMed] [Google Scholar]
- 77.Newsom SA, et al. Skeletal muscle phosphatidylcholine and phosphatidylethanolamine are related to insulin sensitivity and respond to acute exercise in humans. J Appl Physiol. 2016;120(11):1355–1363. doi: 10.1152/japplphysiol.00664.2015. [DOI] [PMC free article] [PubMed] [Google Scholar]
- 78.Jackman MR, Willis WT. Characteristics of mitochondria isolated from type I and type IIb skeletal muscle. Am J Physiol. 1996;270(2 Pt 1):C673–C678. doi: 10.1152/ajpcell.1996.270.2.C673. [DOI] [PubMed] [Google Scholar]
Associated Data
This section collects any data citations, data availability statements, or supplementary materials included in this article.


