Abstract
The production of the oncometabolite 2-hydroxyglutarate (2-HG) has been associated with c-MYC overexpression. c-MYC also regulates glutamine metabolism and drives progression of asymptomatic precursor plasma cell (PC) malignancies to symptomatic multiple myeloma (MM). However, the presence of 2-HG and its clinical significance in PC malignancies is unknown. By performing 13C stable isotope resolved metabolomics (SIRM) using U[13C6]Glucose and U[13C5]Glutamine in human myeloma cell lines (HMCLs), we show that 2-HG is produced in clonal PCs and is derived predominantly from glutamine anaplerosis into the TCA cycle. Furthermore, the 13C SIRM studies in HMCLs also demonstrate that glutamine is preferentially utilized by the TCA cycle compared with glucose. Finally, measuring the levels of 2-HG in the BM supernatant and peripheral blood plasma from patients with precursor PC malignancies such as smoldering MM (SMM) demonstrates that relatively elevated levels of 2-HG are associated with higher levels of c-MYC expression in the BM clonal PCs and with a subsequent shorter time to progression (TTP) to MM. Thus, measuring 2-HG levels in BM supernatant or peripheral blood plasma of SMM patients offers potential early identification of those patients at high risk of progression to MM, who could benefit from early therapeutic intervention.
Keywords: Hematology, Oncology
Keywords: Cancer
Glutamine derived 2-HG is associated with progression of smoldering multiple myeloma to multiple myeloma.
Introduction
Altered cellular metabolism is a hallmark of cancers that provides for the increased requirements of nutrients and energy in rapidly proliferating cells (1). Although upregulation of aerobic glycolysis or the “Warburg effect” is common in cancer cells, it is insufficient to support their increased anabolic metabolism (2). Thereby, the TCA cycle is crucial, since its metabolites serve as precursors for the biosynthesis of fatty acids, nucleic acids, and proteins, and thus needs constant replenishment (3). Glutamine, a nonessential amino acid, supplements glucose as a substantial carbon source via entry into the TCA cycle by its conversion to glutamate (i.e., glutamine anaplerosis) and is one method of replenishing the TCA cycle metabolites (Supplemental Figure 1; supplemental material available online with this article; https://doi.org/10.1172/jci.insight.94543DS1) (4). Thus, glutamine metabolism is of clinical significance as a bioenergetic and anabolic substrate in various cancers (5).
Multiple myeloma (MM) is a plasma cell (PC) malignancy characterized by the proliferation of clonal PCs within the BM and is associated with end-organ damage such as renal failure, lytic bone destruction, anemia, or hypercalcemia (6). MM is always preceded by an asymptomatic phase, monoclonal gammopathy of undetermined significance (MGUS) or smoldering MM (SMM), depending on the extent of BM involvement by the clonal PCs and monoclonal protein levels (7). In most cases, overexpression of the transcription factor c-MYC is believed to drive progression of MGUS and SMM to MM (8). c-MYC also regulates glutamine metabolism by increasing glutamine anaplerosis into the TCA cycle of mitochondria (9), which is vital in clonal PCs from human myeloma cell lines (HMCLs) (10). 2-Hydroxyglutarate (2-HG), an oncometabolite derived from α-ketoglutarate in the TCA cycle, has been associated with epigenetic modifications causing tumorigenesis in cancers associated with IDH1/2 mutations such as acute myeloid leukemia (11, 12) and glioblastoma (13). However, 2-HG was also found to be derived from glutamine anaplerosis into the TCA cycle driven by c-MYC overexpression in the absence of IDH1/2 mutations in subtypes of breast cancer (14). Given that clonal PCs in MM mostly lack IDH1/2 mutations but frequently overexpress c-MYC, we sought to determine if clonal PCs can produce 2-HG as a result of glutamine anaplerosis. Furthermore, we assessed whether increasing levels of 2-HG or other TCA cycle metabolites in the BM or peripheral blood plasma of patients with precursor PC malignancies such as SMM would indicate a higher risk of progressing to MM.
Thus, we utilized 13C in a stable isotope resolve metobolomics (SIRM) approach to determine the contribution of carbon substrates from glutamine into the TCA cycle of clonal PCs in comparison with those from glucose. The results support glutamine being the main contributor of carbon substrates to the TCA cycle pathway via strong anaplerotic input. The results also demonstrate that 2-HG can be produced in clonal PCs in the absence of IDH1/2 mutations and is mostly derived from glutamine anaplerosis into the TCA cycle; glutamine anaplerosis, in turn, can potentially serve as a biomarker in BM and peripheral blood plasma for increased risk of progression of asymptomatic precursor PC disorders such as SMM to MM.
Results
Assessment of glucose and glutamine utilization for the TCA cycle in HMCLs.
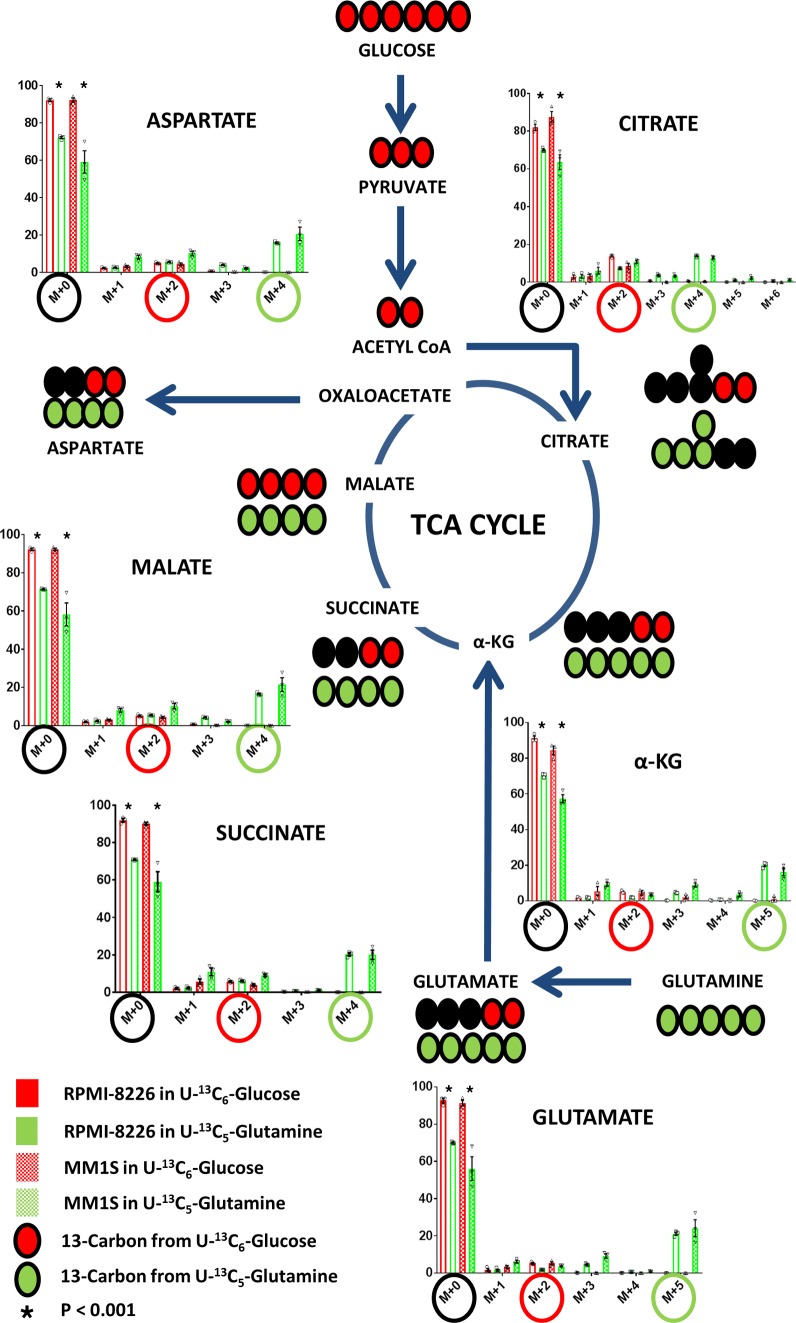
We utilized the HMCLs MM1S and RPMI-8226 to assess the incorporation of glucose and glutamine into the TCA cycle by incubating them in cell culture media containing 35% U[13C6]Glucose and 35% U[13C5]Glutamine, respectively. The incorporation of labeled U [13C6]Glucose and U[13C5]Glutamine into the various intracellular TCA cycle substrates is shown in both HMCLs at 12 hours (Figure 1). With the first turn of the TCA cycle, U[13C6]Glucose-derived TCA cycle intermediates would be expected to yield (m+2) isotopomers of citrate, α-ketoglutarate, glutamate, succinate, malate, and aspartate. Whereas U[13C5]Glutamine-derived TCA cycle intermediates would be expected to yield (m+5) isotopomers of α-ketoglutarate and glutamate but (m+4) isotopomers of succinate, malate, aspartate, and citrate. The formation of (m+5) citrate in HMCLs incubated in U[13C5]Glutamine reflects the reductive carboxylative activity present in which citrate is formed from α-ketoglutarate, although it accounts for only a small percentage of the 13C derived from glutamine anaplerosis. The dilution of the intracellular unlabeled TCA intermediate pool (i.e., [m+0] TCA intermediates) with their corresponding 13C isotopomers is significantly higher in HMCLs incubated with U[13C5]Glutamine than U[13C6]Glucose, which indicates a higher percentage of incorporation of glutamine into the TCA cycle via anaplerosis compared with glucose entry into the TCA cycle via pyruvate. Overall, these results demonstrate that glutamine is the major carbon source for the TCA cycle intermediates in clonal PCs compared with glucose (Figure 1).
Figure 1. Glutamine is an important contributor of carbon substrate to the TCA cycle.
The mass isotopomer distribution of the various TCA cycle intermediates after incubation of MM1S and RPMI-8226 human myeloma cell lines (HMCLs) in cell culture media containing either U[13C5]Glutamine or U[13C6]Glucose. The (m+4) or (m+5) isotopomers highlighted in green circles represent the isotopomer derived from U[13C5]Glutamine, and the (m+2) isotopomers highlighted in red circles are derived from U[13C6]Glucose. The unlabeled TCA cycle intermediates represented by (m+0) are highlighted in black circles. Bar graph values represent the averages of the individual data points (triplicates) that overlay the bar graph. The error bars represent ± SEM. Comparisons were made using the 2-tailed Student t test, and significance was defined as P < 0.05.
Assessment of glucose and glutamine utilization for the aerobic glycolysis in HMCLs.
We utilized the HMCLs MM1S and RPMI-8226 to assess the incorporation of glucose and glutamine into the aerobic glycolysis pathway by using cell culture media containing 35% U[13C6]Glucose and 35% U[13C5]Glutamine, respectively. The incorporation of labeled U[13C6]Glucose and U[13C5]Glutamine into intracellular lactate was evaluated in both HMCLs at 12 hours. U[13C6]Glucose would be expected to yield (m+3) isotopomers of lactate through the formation of (m+3) pyruvate. However, U[13C5]Glutamine would be expected to also yield an (m+3) isotopomer of lactate as a result of (m+4) malate conversion to (m+3) pyruvate. The percentage of incorporation of 13C from U[13C6]Glucose into the (m+3) lactate via aerobic glycolysis is much higher compared with that from U[13C5]Glutamine (Figure 2). These observations are consistent with the Warburg effect being derived entirely from glucose rather than glutamine.
Figure 2. Glucose is an important contributor of carbon substrate for the formation of lactate.
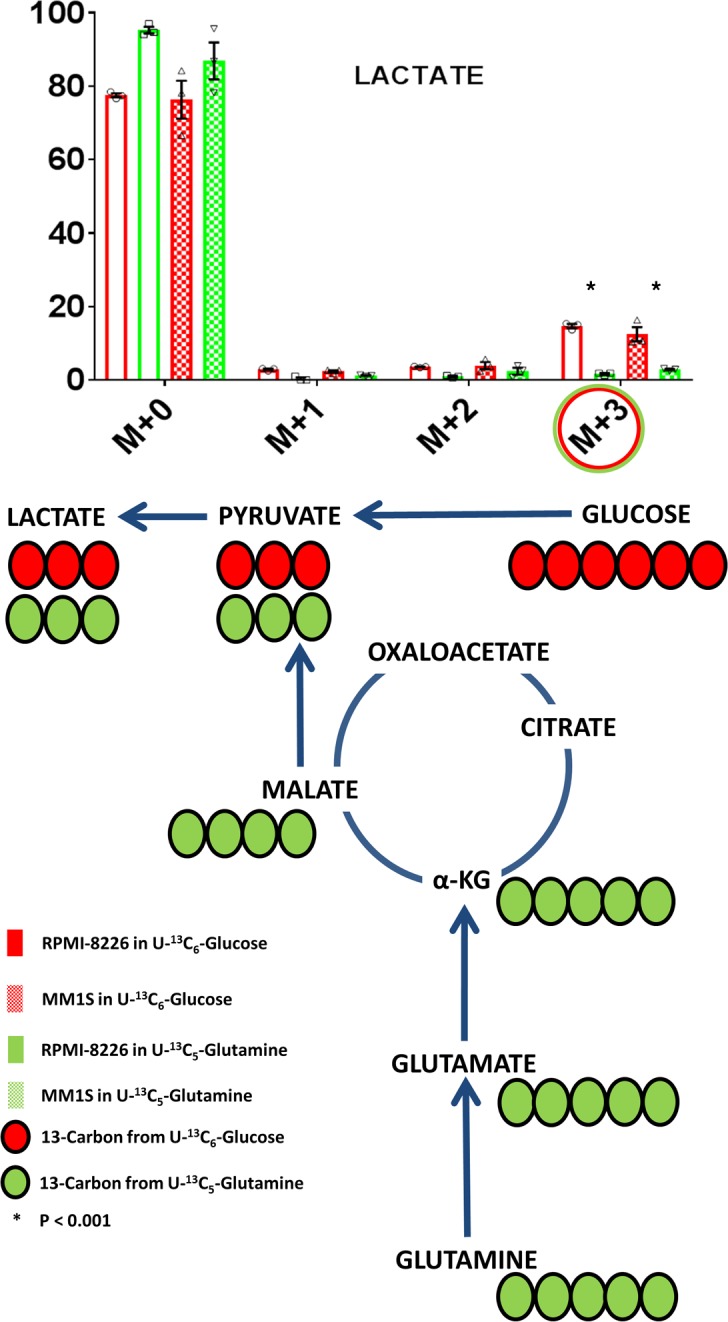
The mass isotopomer distribution of lactate after incubation of MM1S or RPMI-8226 human myeloma cell lines (HMCLs) in cell culture media containing either U[13C5]Glutamine or U[13C6]Glucose. The (m+3) isotopomers highlighted in green and red circles represent the isotopomer derived from U[13C5]Glutamine and U[13C6]Glucose, respectively. Bar graph values represent the averages of the individual data points (triplicates) that overlay the bar graph. The error bars represent ± SEM. Comparisons were made using the 2-tailed Student t test, and significance was defined as P < 0.05.
Identifying the presence of 2-HG in HMCLs and its production from glucose and glutamine.
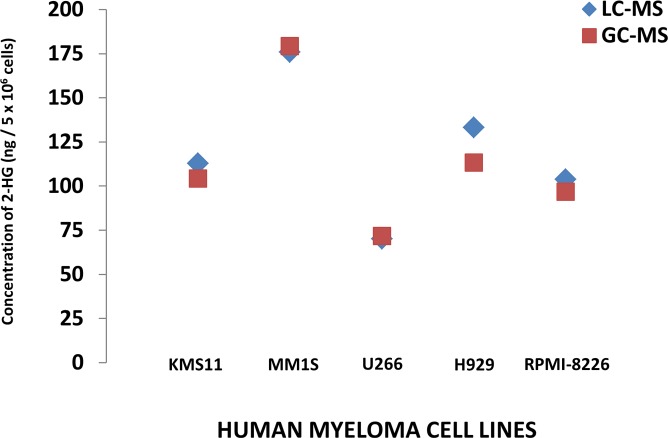
The production of 2-HG within the clonal PCs of 5 different HMCLs (MM1S, RPMI-8226, H929, U266, and KMS11) was assessed by measuring the intracellular 2-HG concentrations by 2 different methodologies: Gas chromatography–mass spectrometry GC-MS and liquid chromatography–MS (LC-MS). All 5 aforementioned HMCLs were confirmed to not possess any known IDH1/2 mutations by DNA sequencing, their intracellular 2-HG concentrations were normalized to cell number, and intracellular protein concentrations were measured and depicted in Figure 3 and Table 1, respectively. Given the presence of 2-HG in these various HMCLs, MM1S and RPMI-8226 HMCLs were then used to assess the incorporation of glucose and glutamine into the formation of 2-HG (m/z 363.2) oncometabolite using cell culture media containing 35% U[13C6]Glucose and 35% U[13C5]Glutamine, respectively. The incorporation of labeled U[13C6]Glucose and U[13C5]Glutamine into intracellular 2-HG formation was evaluated in both HMCLs at 12 hours. U[13C6]Glucose would be expected to yield (m+2) isotopomers of 2-HG through the formation of (m+2) α-ketoglutarate. However, U[13C5]Glutamine would be expected to yield an (m+5) isotopomer of 2-HG as a result of (m+5) glutamate conversion to (m+5) α-ketoglutarate. The percentage of incorporation of 13C from U[13C5]Glutamine into the (m+5) 2-HG is much higher compared with 13C from U[13C6]Glucose into the (m+2) 2-HG (Figure 4). This demonstrates that 2-HG is present and formed in clonal PCs and that almost all of the 2-HG appears to be derived from carbon substrates obtained from glutamine anaplerosis into the TCA cycle.
Figure 3. 2-HG is detectable in human myeloma cell lines.
Intracellular concentrations of 2-hydroxyglutarate (2-HG) measured by gas chromatography–mass spectrometry (GC-MS) and liquid chromatography–mass spectrometry (LC-MS) methods in each of 5 different human myeloma cell lines (HMCLs).
Table 1. The intracellular concentrations of 2-HG in 5 different HMCLs based on either number of cells or protein content that is measured by both GC-MS and LC-MS.
Figure 4. Glutamine is an important contributor of carbon substrate for the formation of 2-HG.
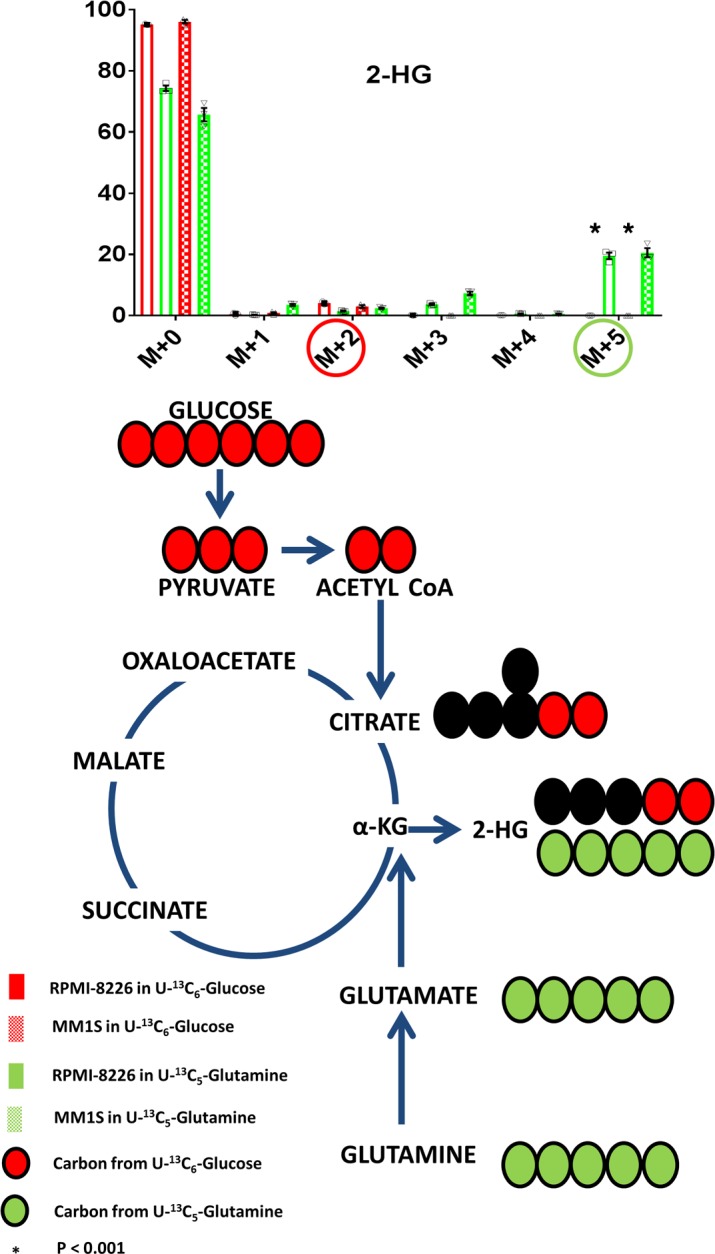
The mass isotopomer distribution of 2-hydroxyglutarate (2-HG) after incubation of MM1S or RPMI-8226 human myeloma cell lines (HMCLs) in cell culture media containing either U[13C5]Glutamine or U[13C6]Glucose. The (m+5) isotopomers highlighted in green circles represent the isotopomer derived from U[13C5]Glutamine, and the (m+2) isotopomers highlighted in red circles are derived from U[13C6]Glucose. Bar graph values represent the averages of the individual data points (triplicates) that overlay the bar graph. The error bars represent ± SEM. Comparisons were made using the 2-tailed Student t test, and significance was defined as P < 0.05.
Assessment of extracellular flux of TCA metabolites in HMCLs.
In order to determine whether any of the TCA metabolites formed intracellularly in the HMCLs is released extracellularly, the spent media of the HMCLs incubated for 24 hours in cell culture media containing 35% U[13C6]Glucose and 35% U[13C5]Glutamine were evaluated by GC-MS for 13C isotopomers and shown in Supplemental Figure 2. Select TCA cycle metabolites — such as lactate, glutamate, α-ketoglutarate, and 2-HG — were found to be released extracellularly into the media in relatively significant quantities (>1% 13C enrichment) compared with the remainder of metabolites. Based on the 13C enrichment in 2-HG in the spent media, 2-HG has a much lower amount of release into the extracellular media compared with lactate, glutamate, and α-ketoglutarate. As expected, most of the secreted lactate produced from aerobic glycolysis was derived from glucose instead of glutamine, as seen by the higher levels of lactate isotopomer in the media of HMCLs incubated in U[13C6]Glucose-containing media in comparison with the HMCLs incubated in U[13C5]Glutamine-containing media. The remainder of the aforementioned extracellularly secreted TCA cycle metabolites are produced mostly from glutamine instead of glucose, as demonstrated by the higher levels of isotopomers of glutamate, α-ketoglutarate, and 2-HG in the media of HMCLs incubated in U[13C5]Glutamine-containing media in comparison with the HMCLs incubated in U[13C6]Glucose-containing media.
BM clonal PCs in MM have higher glutamine uptake compared with the remainder of BM mononuclear cells.
Given that glutamine is an important contributor of anabolic carbon substrate to the TCA cycle in HMCLs, we studied primary clonal PCs derived from patients with MM to determine if they had a higher uptake of glutamine compared with the remainder of their BM mononuclear cells. Fresh BM aspirates were obtained from 4 consecutive patients (Supplemental Table 1) diagnosed with MM and were processed to separate the clonal PCs from the remainder of the BM mononuclear cells based on CD138 expression. The CD138+ cells consisted of clonal PCs (clonality was confirmed by immunofluorescent slide–based κ or λ restriction, as seen in Supplemental Figure 3) and the CD138– represented the non-PCs or remainder of the BM mononuclear cells within the BM microenvironment. Both groups of cells from each patient underwent ex vivo assessment of their glutamine utilization by measuring the mass isotopomer distribution of intracellular glutamate after incubating them in cell culture media containing 2 mM of U[13C5]Glutamine. The expected incorporation of carbon substrate from glutamine into the TCA cycle by anaplerosis is depicted in Supplemental Figure 4. The incorporation of glutamine into the cells was higher in the CD138+ fraction of cells compared with the CD138– cells, as demonstrated by the higher (m+5) glutamate (P < 0.001) detected in the intracellular metabolites by GC-MS (Figure 5). The 13C also incorporated into the various other intracellular TCA cycle substrates in CD138+ cells as a result of the glutamine anaplerosis pathway (Supplemental Figure 5).
Figure 5. Glutamine uptake is higher in BM plasma cells compared with the remainder of the BM mononuclear cells.
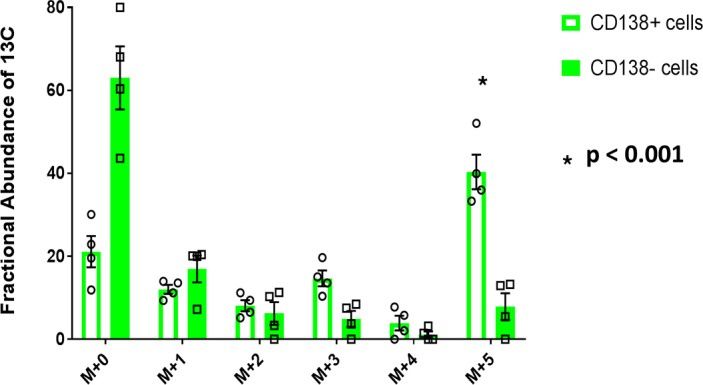
Mass isotopomer distribution of glutamate representing the results of ex vivo glutamine anaplerosis of U[13C5]Glutamine into CD138+ and CD138– cells derived from the BM aspirates of patients with multiple myeloma (MM) (n = 4). Bar graph values represent the averages of the individual data points that overlay the bar graph. The error bars represent ± SEM. Comparisons were made using the 2-tailed Student t test, and significance was defined as P < 0.05.
Quantification of the TCA cycle metabolite concentrations in BM supernatant of patients with MGUS and MM.
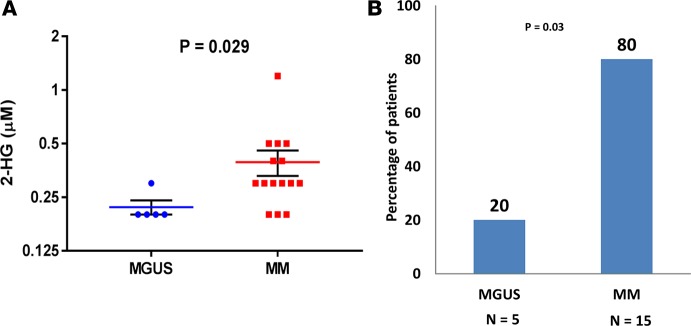
Since c-MYC is believed to be 1 potential driver of progression of precursor PC disorders such as MGUS to MM, it was of interest to determine if 2-HG concentrations in the BM supernatant would be different between patients with MGUS and MM, since the latter would be more likely to have clonal PCs with c-MYC overexpression leading to increased glutamine anaplerosis and formation of 2-HG. Based on Figure 4, we were interested in evaluating whether the potential increased 2-HG production by clonal PCs in MM would be released into the BM supernatant, making it easier to measure and compare to levels in the BM supernatant of MGUS. Thus, a total of 15 consecutive patients with a diagnosis of MM and 5 consecutive patients with a diagnosis of MGUS who were undergoing BM aspirations as part of their routine clinical evaluation had their BM supernatant assessed for the various TCA metabolite concentrations. Their clinical characteristics, as well as the quantification of the various TCA metabolite concentrations in their BM supernatant by GC-MS, are listed in Supplemental Table 2. The median concentration of 2-HG measured in the BM supernatant of these 20 samples was 0.3 μM or 44 ng/ml, which is much lower in quantity compared with levels expected in the BM supernatant of patients with IDH1/2 mutant–driven tumors such as acute myeloid leukemia (AML) (mean ~28,000 ng/ml) (15). Comparative assessments of the median 2-HG concentrations between the MM and MGUS patients demonstrated higher levels of 2-HG in the BM supernatant of MM compared with MGUS (P = 0.029) (Figure 6A). A higher proportion of MM patients (12/15 patients or 80%) had 2-HG levels equal or more than the median concentration compared with MGUS patients (1/5 patients or 20%) (P = 0.03) (Figure 6B).
Figure 6. 2-HG differentiates between monoclonal gammopathy of undetermined significance and multiple myeloma.
(A) Dot plot graph depicting the individual (blue circles and red squares), mean (red and blue line), and ± SEM (black error bars) of 2-hydroxyglutarate (2-HG) concentrations in the BM supernatant of patients in the monoclonal gammopathy of undetermined significance (MGUS) (n = 5) and multiple myeloma (MM) (n = 15) cohorts. Comparisons were made by the Mann-Whitney test, and significance was defined as P < 0.05. (B) Bar graph representing the percentage of monoclonal gammopathy of undetermined significance (MGUS) (n = 5) and multiple myeloma (MM) (n = 15) patients with 2-hydroxyglutarate (2-HG) levels in the BM supernatant higher than the median 2-HG level of the cohort. Comparisons were made by the 2-tailed Fisher’s exact test, and significance was defined as P < 0.05.
2-HG levels in the BM supernatant of patients with SMM is associated with high risk of progression to MM.
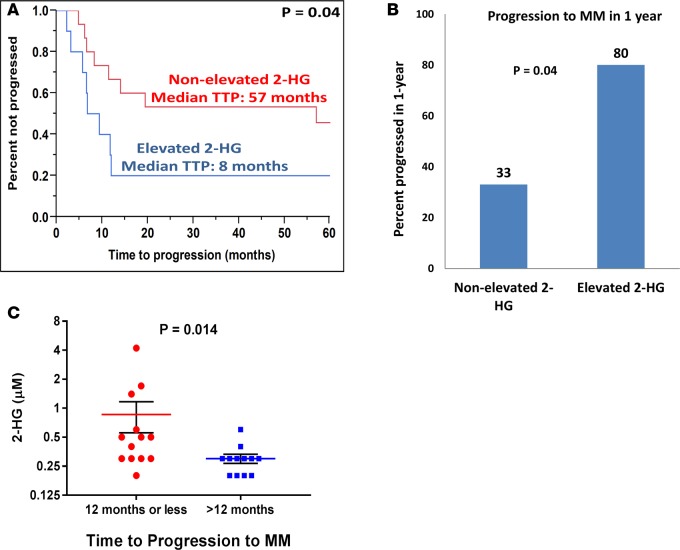
Since patients with SMM have variable rates of progression to MM that may be driven by c-MYC overexpression, it was of interest to determine if 2-HG concentrations in the BM supernatant would be able to discriminate between patients with SMM who progress rapidly to MM and those SMM patients who remain asymptomatic for extended periods of time. Those SMM patients that progress rapidly to MM would likely have more clonal PCs with c-MYC overexpression leading to increased glutamine anaplerosis and formation of 2-HG. Thus, we identified 25 patients with a diagnosis of SMM who had their initial diagnostic BM supernatant samples stored for biobanking purposes. The BM supernatant from each of these patients underwent identification and quantification of the various TCA metabolites by GC-MS. The resulting concentrations and clinical characteristics of these patients are listed in Supplemental Table 3. Of these patients, 21 (84%) had more than 10% BM PCs and 4 (16%) had an M-spike greater than 3 g/dl. Increasing levels of 2-HG predicted for a shorter time to progression (TTP) to MM (hazard ratio [HR], 2.29; 95% CI, 1.14–4.43; P = 0.023). The median 2-HG concentration was 0.30 μM (range, 0.2–4.2). Patients whose BM supernatant 2-HG concentration was above the median were categorized as “elevated 2-HG” (n = 10), and those below the median were categorized as “nonelevated 2-HG” (n = 15). The nonelevated 2-HG group had a median TTP of 57 months vs. 8 months in the elevated 2-HG group (P = 0.04) (Figure 7A). Also, 80% of SMM patients in the elevated 2-HG group progressed to MM within 1 year vs. 33% of SMM patients in the nonelevated 2-HG group (P=0.04) (Figure 7B). Comparative assessments of the median 2-HG concentrations between the group of SMM patients who progressed within 12 months or less to MM (n = 13) and the group of SMM patients who progressed after 12 months (n = 12) demonstrated higher levels of 2-HG in the BM supernatant of the former group of SMM patients (P = 0.014) (Figure 7C). An example of a patient in the elevated 2-HG group who progressed from SMM to MM with a new lytic thoracic bone lesion on PET/CT within 9 months of being diagnosed with SMM is demonstrated in Supplemental Figure 6. None of levels of the other TCA metabolites such as glutamate and α-ketoglutarate were associated with a shorter TTP to MM. Increasing BM PCs was the only other variable that predicted for a shorter TTP to MM (HR, 5.11; 95% CI, 1.27–20.2; P = 0.022).
Figure 7. 2-HG levels in the BM supernatant predicts for shorter time to progression of smoldering multiple myeloma to multiple myeloma.
(A) Kaplan-Meier curve showing the time to progression (TTP) of patients with smoldering multiple myeloma (SMM) with a 2-hydroxyglutarate (2-HG) level in the BM supernatant higher than the median 2-HG level (elevated 2-HG) (n = 10) compared with patients with SM) with a 2-HG level in the BM supernatant lower or equal to the median 2-HG levels of the cohort (nonelevated 2-HG) (n = 15). Comparisons were made by the Wilcoxon test, and significance was defined as P < 0.05. (B) Bar graph representing the percentage of SMM patients with 2-HG levels in the BM supernatant higher than the median 2-HG level (elevated 2-HG) (n = 10) or lower than the median 2-HG level (nonelevated 2-HG) (n = 15) who progressed to MM in 1 year from the time of 2-HG level assessment. Comparisons were made by the 2-tailed Fisher’s exact test, and significance was defined as P < 0.05. (C) Dot plot graph depicting the individual (red circles and blue squares), mean (red and blue line), and ± SEM (black error bars) of 2-HG concentrations in the BM supernatant of patients with SMM who progressed to MM within 12 months or less (n = 13) and later than 12 months (n = 12). Comparisons were made by the Mann-Whitney test, and significance was defined as P < 0.05.
2-HG levels in the BM supernatant of patients with SMM correlates with the percentage of BM PCs expressing c-MYC.
The archived BM core biopsy blocks from the aforementioned 25 patients with SMM whose BM supernatant was used to quantify 2-HG levels were obtained. The percentage of total BM PCs expressing the protein c-MYC in their nucleus is detailed in Supplemental Table 3, along with the rest of the patient characteristics and corresponding 2-HG concentrations in their BM supernatant. All patients appeared to have at least some proportion of their BM PCs express c-MYC in their nucleus. The BM supernatant 2-HG concentrations were higher in patients who had a higher percentage of BM PCs expressing nuclear c-MYC (i.e., > 20% of total PCs) as demonstrated in Figure 8A (P = 0.045). Examples of variable percentages of BM PCs from patients with SMM expressing nuclear c-MYC and their corresponding BM plasma 2-HG levels are depicted in Figures 8, B and C. Expression of nuclear c-MYC in 20% or more of BM clonal PCs predicted for a shorter TTP to MM (HR, 4.27; 95% CI, 1.46–15.48; P = 0.007).
Figure 8. c-Myc expression in BM plasma cells correlates with 2-HG levels in the BM supernatant.
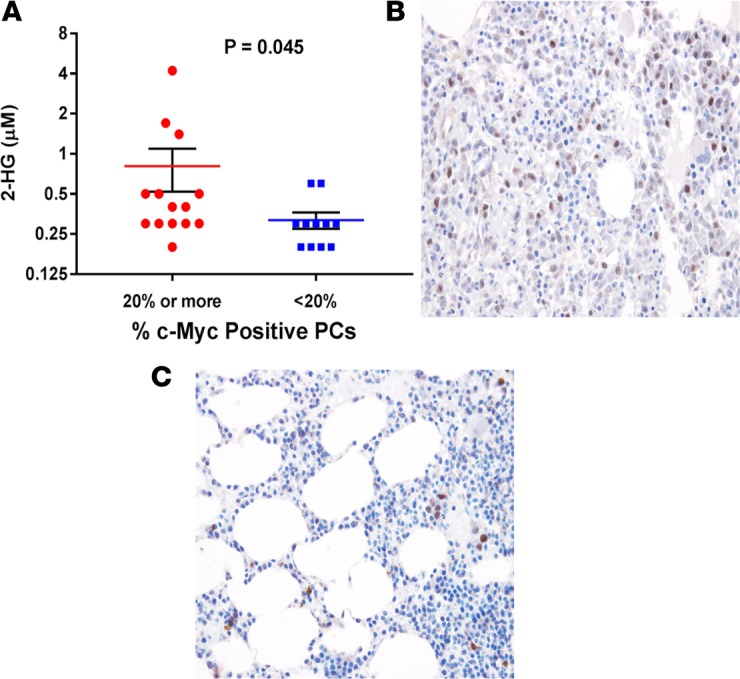
(A) Dot plot graph depicting the individual (red circles and blue squares), mean (red and blue line), and ± SEM (black error bars) of 2-hydroxyglutarate (2-HG) concentrations in the BM supernatant of patients with smoldering multiple myeloma (SMM) whose BM biopsies show either ≥ 20% (n = 14) or < 20% (n = 11) clonal plasma cells with c-MYC nuclear staining. Comparisons were made by the Mann-Whitney test, and significance was defined as P < 0.05. (B) Example of a BM biopsy (magnification 40×) showing ≥ 20% clonal plasma cells with c-MYC nuclear staining (brown). (C) Example of a BM biopsy (magnification 40×) showing <20% clonal plasma cells with c-MYC nuclear staining (brown).
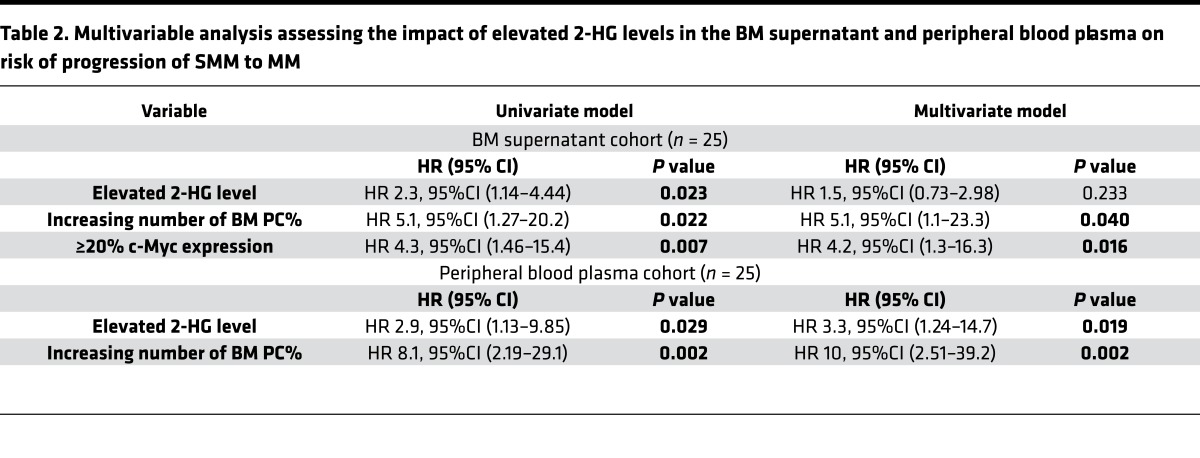
Finally, a multivariable model predicting for shorter TTP in these SMM patients was created that included all clinical and pathological variables found to be significantly associated with TTP of SMM to MM such as: i) levels of 2-HG in the BM supernatant, ii) BM PC percentage, and iii) expression of nuclear c-MYC in 20% or more of BM clonal PCs. However, only increasing BM PC percentage and expression of nuclear c-MYC in 20% or more of BM clonal PCs retained statistical significance. Increasing levels of 2-HG in the BM supernatant not significant in the multivariable model, mostly due to the direct positive association with expression of nuclear c-MYC in 20% or more of BM clonal PCs and finally the small sample size of n = 25 (Table 2). Nevertheless, these results further support the main hypothesis that 2-HG production is present in clonal PCs and is derived from glutamine anaplerosis, which is driven by c-MYC overexpression.
Table 2. Multivariable analysis assessing the impact of elevated 2-HG levels in the BM supernatant and peripheral blood plasma on risk of progression of SMM to MM.
2-HG levels in the peripheral blood plasma of patients with SMM is also associated with high risk of progression to MM.
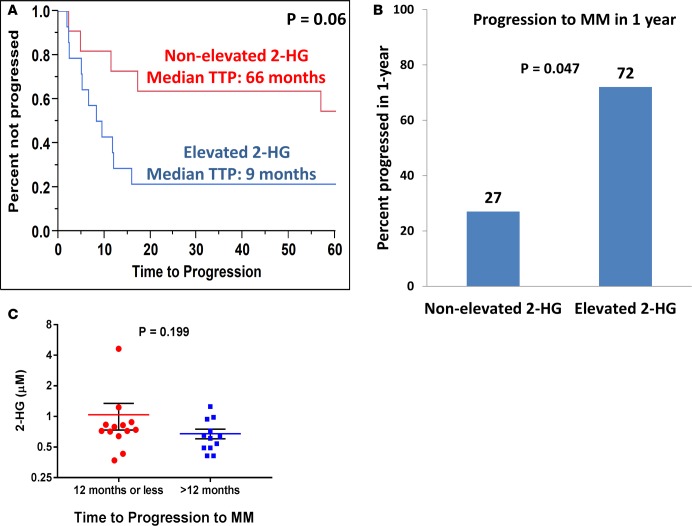
To verify the prognostic value of the differences in 2-HG concentrations in SMM patients, we performed similar TCA metabolite quantification in the peripheral blood plasma of 25 patients with SMM. The resulting concentrations and clinical characteristics of these patients are listed in Supplemental Table 4. Of these patients, 20 (80%) had more than 10% BM PCs and 7 (28%) had a M-spike greater than 3 g/dl. Just as in the BM supernatant, increasing levels of 2-HG in the peripheral blood plasma predicted for a shorter TTP to MM (HR, 2.89; 95% CI, 1.13–9.8; P = 0.029). None of the levels of the other TCA metabolites, such as glutamate and α-ketoglutarate, were associated with the TTP to MM. The median 2-HG concentration was 0.70 μM (from 0.37 to 4.63). The median concentration of 2-HG measured in the peripheral blood plasma of AML patients with IDH1/2 mutations in a prior study was around 21 μM (12). Patients whose peripheral blood plasma 2-HG concentration was equal or above the median were categorized as “elevated 2-HG” (n = 14), and those below the median were categorized as “nonelevated 2-HG” (n = 11). The nonelevated 2-HG group had a median TTP of 66 months vs. 9 months in the elevated 2-HG group (P = 0.06) (Figure 9A). Also, 72% of SMM patients in the elevated 2-HG group progressed to MM within 1 year vs. 27% of SMM patients in the nonelevated 2-HG group (P = 0.047) (Figure 9B). Comparative assessments of the median 2-HG concentrations between the SMM patients who progressed within 12 months or less to MM and the SMM patients who progressed after 12 months demonstrated slightly higher levels of 2-HG in the peripheral blood plasma of the former group of SMM patients (P = 0.199) (Figure 9C). Finally, increasing BM PCs again was the only other clinical variable that predicted for a shorter TTP to MM (HR, 8.1; 95% CI, 2.19–29.1; P = 0.002). A multivariable model predicting for shorter TTP in these SMM patients included levels of 2-HG in the peripheral blood and BM PC percentage, both of which retained statistical significance as shown in Table 2.
Figure 9. 2-HG levels in the peripheral blood predicts for shorter time to progression of smoldering multiple myeloma to multiple myeloma.
(A) Kaplan-Meier curve showing the time to progression (TTP) of patients with smoldering multiple myeloma (SMM) with a 2-hydroxyglutarate (2-HG) level in the peripheral blood plasma higher than the median 2-HG level (elevated 2-HG) (n = 14) compared with patients with SMM with a 2-HG level in the peripheral blood plasma lower or equal to the median 2-HG levels of the cohort (nonelevated 2-HG) (n = 11). Comparisons were made by the Wilcoxon test, and significance was defined as P < 0.05. (B) Bar graph representing the percentage of SMM patients with 2-HG levels in the peripheral blood plasma higher than the median 2-HG level (elevated 2-HG) (n = 14) or lower than the median 2-HG level (nonelevated 2-HG) (n = 11) that progressed to MM in 1 year from the time of 2-HG level assessment. Comparisons were made by the 2-tailed Fisher’s exact test, and significance was defined as P < 0.05. (C) Dot plot graph depicting the individual (red circles and blue squares), mean (red and blue line), and ± SEM (black error bars) of 2-HG concentrations in the peripheral blood plasma of patients with SMM who progressed to MM within 12 months or less (n = 13) and later than 12 months (n = 12). Comparisons were made by the Mann-Whitney test, and significance was defined as P < 0.05.
Discussion
The current study demonstrates that glutamine anaplerosis provides most of the anabolic carbon substrate required by the TCA cycle substrates within clonal PCs rather than glucose through its entry into the TCA cycle via pyruvate (Figure 1). A previous report by Le et al. demonstrated that glutamine is imported and undergoes metabolism through the TCA cycle (16). Furthermore, under hypoxic conditions, glutamine mainly contributes carbons to the TCA cycle intermediates instead of glucose (16). The current demonstration of glutamine as a major contributor of TCA substrates in clonal PCs is of substantial clinical importance and provides a mechanistic explanation for the recent reports demonstrating that inhibition of the conversion of glutamine to glutamate via glutaminase (GLS1) inhibitors or disruption of glutamine uptake via ASCT2 inhibition (10) can decrease cell growth of various HMCLs. Our results also demonstrate that carbon substrates from glucose are largely used for the formation of lactate via aerobic glycolysis, as in the Warburg effect compared with glutamine from anaplerosis into the TCA cycle (Figure 2).
The aforementioned dependence of clonal PCs from MM on glutamine metabolism is likely driven by the transcription factor c-MYC. Overexpression of c-MYC has been associated with promotion of the transcription of glutamine importers ASCT2 and SN2 on cell membranes (17). It can also upregulate GLS protein expression by suppressing mIR23a/b (both being negative regulators of GLS) (18). Thus, c-MYC leads to increased import of glutamine into cells while also promoting the conversion of glutamine into glutamate, which then enters into the TCA cycle (i.e., glutamine anaplerosis) in mitochondria (19). Overexpression of c-MYC in clonal PCs from patients with MM is very common (8). Furthermore, the ex vivo assessment of glutamine uptake by clonal PCs in comparison with the remainder of the BM mononuclear cells in patients with MM included in our study confirms the increased glutamine anaplerosis in clonal PCs (Figure 5).
2-HG is a known oncometabolite derived from α-ketoglutarate and is associated with epigenetic modifications, as well activation of the mTOR signaling pathway (20), causing tumorigenesis in various cancers, especially those associated with IDH1/2 mutations such as acute myeloid leukemia (11, 12) and glioblastoma (13, 21). However, in certain subtypes of breast cancer, 2-HG was also found to be produced from α-ketoglutarate as a result of glutamine anaplerosis into the TCA cycle driven by c-MYC overexpression in the absence of IDH1/2 mutations (14). Our study showed that 2-HG is also produced in HMCLs (Figure 3), which are known to have high c-MYC expression (22). To our best knowledge, importance of this metabolic pathway is first demonstrated in the current study.
Disease progression from asymptomatic precursor clonal PC disorders such as MGUS and SMM to symptomatic MM is of substantial clinical interest. c-MYC expression is absent in clonal PCs from patients with MGUS, whereas 70% of new MM patients have upregulated c-MYC in their clonal PCs (8). Furthermore, Myc activation in germinal center B cells leads to formation of sporadic MM tumors in Vk*MYC mice, suggesting its critical role for the progression into MM (23). Thus, our study assessed the hypothesis that, if overexpression of c-MYC is mostly present in clonal PCs from MM but absent in MGUS, then there would be more 2-HG production from clonal PCs in MM that is driven by glutamine anaplerosis as a result of c-MYC overexpression and this 2-HG could be released into the BM supernatant. The results from our study supported this hypothesis by demonstrating that 2-HG levels were more likely to be elevated in the BM supernatant of patients with MM compared with those of MGUS (Figure 6, A and B). It is not a surprise that the actual concentrations of 2-HG in the BM or peripheral blood plasma are low (i.e., fractions of a micromolar). This is likely due to the relatively limited release of 2-HG extracellularly (Supplemental Figure 2) and to its dilution in the entire body plasma volume.
Nevertheless, this ability of 2-HG levels to potentially differentiate between clonal PCs with an MGUS or MM phenotype could be very useful in the clinical scenario of SMM. Both MGUS and SMM patients have an increased life-long risk of progression to MM; however, a diagnosis of MM is not made until patients experience overt end-organ damage. MGUS progresses to MM at a rate of 1% per year (24), whereas SMM has a much higher rate of progression of 10% per year for the first 5 years, 3% per year for the next 5 years, and then 1% per year thereafter (25). One-third of patients with SMM progress to MM within 2 years of diagnosis, and these patients constitute a high-risk phenotype. It is believed that these high-risk patients with SMM who progress to MM rapidly are likely to already have clonal PCs with a malignant and more proliferative phenotype similar to MM but not clinically recognized. In contrast, SMM patients who do not progress to MM for several years likely have clonal PCs with a premalignant, nonproliferative phenotype similar to MGUS. To date, high-risk SMM patients do not receive treatment until they progress to overt MM and experience end-organ damage (Supplemental Figure 6). This is because, although a number of useful prognostic factors have been identified, there is a lack of accurate and sensitive biomarkers that can preemptively identify high-risk SMM (26). Being able to identify patients with high-risk SMM will provide an opportunity for changing the treatment paradigm to develop effective preventive and early treatment strategies for MM. In this effort, our study evaluated whether 2-HG levels would be higher in the BM and peripheral blood plasma of patients with SMM who progress to myeloma quickly compared with those who do not progress quickly. The patients in the elevated 2-HG groups had a shorter TTP to symptomatic MM compared with patients in the nonelevated 2-HG groups in both BM supernatant (Figures 7, A–C) and peripheral blood plasma (Figures 9, A–C); however, in the latter, the P value was slightly greater than 0.05 due to the small sample size. In a multivariable model looking at the factors predictive of shorter TTP of SMM to MM, increasing percentage of BM PCs, as well as higher quantitative levels of 2-HG in the peripheral blood plasma, were both predictive of a shorter TTP to MM (Table 2). Correlation of nuclear c-MYC protein expression by IHC in the BM supernatant cohort suggests a direct correlation with the percentage of clonal PCs positive for c-MYC expression by IHC and the 2-HG levels present in the BM supernatant (Figure 8A). This is likely why, in a similar multivariable model of the BM supernatant SMM cohort, higher quantitative levels of 2-HG in the BM supernatant barely lost statistical significance despite being significant in the univariate models. This is likely due to the small sample size and direct correlation of 2-HG levels with the quantity of BM PCs, as well as c-MYC expressions in the BM PCs. Together, this supports the hypothesis that — since 2-HG is derived mostly from glutamine anaplerosis into the TCA cycle, which is driven by c-MYC overexpression— SMM patients with elevated 2-HG levels are likely to have clonal PCs that already have the MM phenotype and have c-MYC overexpression, in contrast with those SMM patients with nonelevated 2-HG levels that are likely to have clonal PCs similar to MGUS and do not have as much of c-MYC overexpression. This is one of the few studies to employ SIRM-based assessments to evaluate the glutamine anaplerosis and the TCA cycle pathways in clonal PCs from HMCLs. Almost all HMCLs have primary MYC translocations involving an immunoglobulin gene locus, making their levels of c-MYC expression high (22). Other metabolomic-based approaches have been undertaken in the past using archived biofluids such as peripheral blood and urine samples from patients with MM (27–29). Though these studies were different from this study, as they utilized an untargeted metabolite profiling methodology via NMR spectroscopy, they were able to identify metabolite profiles that correlated with the presence of either active disease, remission, or precursor states such as MGUS. However, an assessment by Puchades-Carrasco of MM patients at diagnosis exhibited decreased levels of glutamine in the peripheral blood compared with healthy controls (29). Furthermore, after achieving complete remission, the glutamine levels in these MM patients normalized to levels similar to healthy individuals (29). This supports our findings in that glutamine metabolism is important in MM and peripheral blood levels of glutamine are likely lower in active disease, as it is being utilized by clonal PCs to support glutamine anaplerosis.
Future studies with larger patient sample sizes are required to confirm this association of 2-HG with the progression of precursor PC disorders such as SMM to MM. An assessment of glutamine utilization in normal PCs from healthy individuals would also be useful in understanding normal glutamine metabolism in the BM. In addition, further studies directed at identification of the enantiomer forms of 2-HG such as D vs. L isoforms and their association with disease progression is also required. More importantly, the true mechanistic significance of 2-HG in clonal PCs is still not understood. It is possible that 2-HG is solely a manifestation of c-MYC overexpression as a result of increased glutamine utilization leading to small levels of 2-HG production through reductive carboxylation. However, it could also be possible that even small levels of 2-HG production as a result of c-MYC overexpression can lead to epigenetic regulation within clonal PCs that leads to the ultimate progression of disease of MGUS and SMM to MM. Thus, subsequent mechanistic studies of 2-HG and its effects in clonal PCs, as well as the determination of the global methylation patterns in clonal PCs as a result of 2-HG, would be important to be studied and compared between groups of patients with elevated and nonelevated 2-HG. Nevertheless, to our best knowledge, this is the first study to demonstrate that 2-HG can be produced in clonal PCs and is detectable in the peripheral blood and BM supernatant of patients with PC disorders. Furthermore, this 2-HG is almost entirely derived from glutamine anaplerosis into the TCA cycle rather than glucose. This appears to be of clinical significance, given that elevated 2-HG levels in patients with SMM are associated with a high risk of early progression to MM. Additional mechanistic studies to determine the role of 2-HG in this association with early progression of SMM to MM is warranted as the next step.
Methods
Cell culture preparation and isotope labeling
The MM1S, CCL-155 (RPMI-8226), H929, and U266 HMCLs were obtained from American Type Culture Collection (ATCC) . The KMS11 HMCL was provided by Leif Bergsagel (Mayo Clinic, Scottsdale, Arizona, USA). All HMCLs were grown in RPMI-1640 cell culture medium containing 11 mM (millimolar) of glucose and supplemented with 10% FBS, 2 mM Glutamax (GIBCO), 100 U/ml penicillin, and 100 μg/ml streptomycin. The cell culture incubators were set at 37°C and 5% CO2/air. For the 13C-labeling experiments, only the MM1S and RPMI-8226 HMCLs were eventually resuspended in media containing 13C-labeled isotopes when they reached at least 60% or more confluency in the unlabeled RPMI-1640 medium. In labeling experiments using 13C-labeled glucose, 35% of the glucose in the aforementioned cell culture media was substituted with U[13C6]Glucose (Cambridge Isotopes) to maintain a stable concentration of 11 mM of glucose. Similarly, in labeling experiments using 13C-labeled glutamine, 35% of the glutamine in the aforementioned cell culture media was substituted with U[13C5]Glutamine (Cambridge Isotopes) to maintain a concentration of 2 mM. All cell lines were passaged fewer than 5 times between thawing and the completion of U[13C6]Glucose or U[13C5]Glutamine labeling experiments. A sample of the labeling media was taken at the initial time of labeled media preparation and stored as a reference for analysis. Additional samples of the labeling media were collected at 12 and 24 hours. Following each of the 12- and 24-hour labeling periods, cell pellets of the HMCLs were harvested by centrifugation at 500 g for 6 minutes, and an aliquot of the supernatant or spent media was stored at −80°C. Cell pellets were further washed 3 times with phosphate-buffered saline and centrifugation at 500 g for 6 minutes. These final cell pellets and aliquots of spent media were stored at −80°C for subsequent TCA cycle intermediate isotopomer analyses.
TCA cycle intermediates isotopomer analysis
Sample preparations.
The HMCL cell pellets were resuspended in 50 μl of 1× PBS and sonicated briefly to prepare cell pellet homogenates. A mixture of methanol/acetonitrile (50:50) was added to the homogenates to deproteinate the samples, followed by centrifugation at 19,000 g for 10 minutes. Supernatants were dried under a stream of nitrogen gas. The remaining pellet was saved to perform protein assay. Prepared extracts and spent media were derivatized using 20 μl of a 20-mg/ml ethoxyamine hydrochloride solution in pyridine for 60 minutes at 70°C. Subsequently, the extracts were silylated with 100 μl of MTBSTFA (N-Methyl-N-[tert-butyldimethylsilyl] trifluoroacetamide) and 1% tBDMCS (tertbutyldimetheylchlorosilane) (Regis Technologies) for 60 minutes at 35°C, followed by overnight incubation at room temperature. After evaporation to dryness using nitrogen, the residues were redissolved in 25 μl n-decane.
GC-MS analyses.
Isotopomer analysis of the intracellular and extracellular TCA cycle metabolites from the HMCL cell pellets and spent media, respectively, were performed using an Agilent Technologies 5975C GC-MS. Splitless injections of 1-μl aliquots of the derivatized extracts were injected onto a DB5-MS capillary column (30 m × 250 μm internal diameter [i.d.], 0.25 μm film thickness; J&W Scientific). The MS was operated under electron impact (EI) conditions with selected ion monitoring (SIM). The temperature of the injector was set at 250oC and the transfer line to the MS at 280oC. Helium was used as the carrier gas at a flow rate of 0.9 ml/min. The GC temperature program used involved the following: the oven was held for 0.5 minutes at 120oC and was then increased to 210oC at 15oC/min, to 270oC at 10oC/min, to 280°C at 5 °C/min holding for 1 minute, and finally to 325°C with a hold time of 10 minutes. Data were processed using MassHunter quantitative analysis software version B.05.01 build 5.1.315.0 (Agilent Technologies Inc.) for integration of peaks and calculation isotopic ratios.
SIM was used to monitor the mole percent enrichment for each analyte, such as the fragment (M0) and all labeled mass isotopomer positions (M1, M2, M3, etc.) up to m+2 above the number of carbons in the molecule backbone. M/z values of M0 were monitored for the following intermediates: lactate (m/z 261.2), fumarate (m/z 287.1), succinate (m/z 289.1), α-ketoglutarate (m/z 360.2), malate (m/z 419.3), citrate (m/z 591.4), 2-HG (m/z 433), and glutamate (m/z 432.2). The mass isotopomer distribution of each compound was then corrected for natural abundance using the respective standards (30). We used an appropriate set of linear simultaneous equations to calculate mole percent enrichment of TCA cycle intermediates to understand glucose-dependent or glucose-independent glutamine metabolism in myeloma cells.
Ex vivo 13C labeling of CD138+ and CD138– mononuclear cells.
The freshly obtained BM aspirates from patients underwent Ficoll-Paque gradient separation for plasma processing, which was stored for later analysis at -80°C. The remnant cellular component of the BM aspirate underwent red cell lysis using ACK lysis buffer. The clonal PCs were extracted using positive selection by mixing the cells with a CD138+ selection cocktail and anti-CD138 magnetic-activated cell separation microbeads (RoboSep cell separation system, StemCell Technologies Inc.) in an automated RoboSep cell separation system. Purity of the sorted clonal PCs was confirmed via light chain restriction using slide-based immunofluorescent method. The CD138+ clonal PCs and the remainder of the CD138– cells were incubated in RPMI-1640 medium containing 11 mM of glucose and supplemented with 10% FBS, 2 mM U[13C5]Glutamine, 100 U/ml penicillin, and 100 μg/ml streptomycin.
Methodology for quantitative assessments of TCA metabolites via GC-MS
Spent media and plasma samples were spiked in 20μl of internal solution containing U[13C]-labeled analytes for 2-HG, glutamate, and α-ketoglutarate. The proteins were removed by adding 250 μl of chilled methanol and acetonitrile solution to the sample mixture. After drying the supernatant in the speed vacuum, the sample was derivatized with ethoxime, followed by sylation with MtBSTFA + 1% tBDMCS before it was analyzed on an Agilent 5975C GC-MS under EI and single ion monitoring conditions. Concentrations of α-ketoglutarate (m/z 360.2), 2-HG (m/z 433), and glutamate (m/z 432.4) were measured against 7-point calibration curves that underwent the same derivatization.
Methodology for quantitative assessments of 2-HG via LC-MS/MS:
The accuracy of the GC-MS method was assessed by comparing the contents of measured 2-HG using LC-electrospray ionization (ESI) MS/MS platform consisting of Shimadzu Nexera ultra-high–performance LC (UHPLC) coupled to 6500 triple quadrupole tandem mass spectrometry (Triple Quad 6500, SCIEX). Chromatographic separation was performed using ACQUITY UPLC HSS T3 Column (Waters; 100 Å, 1.8 μm, 2.1 mm × 50 mm) with mobile phase A consisting of 5 mM ammonium formate with 0.1% formic acid in water (v/v) and acetonitrile as mobile phase B. Targeted multiple reaction monitoring (MRM) analysis of the selected ions in positive electrospray ionization mode was performed using the following ion transitions (precursor ions → product ions): m/z 147.1 (M + H)+ to m/z 129 for 2-HG and m/z 152.1 to m/z 134 for U[13C5]2-HG as internal standard. Quantification was achieved using a calibration curve with the area of 2-HG normalized by the area of the stable isotope–labeled standard (U[13C5]2-HG).
Clinical assessment of patients with PC disorders
MGUS and MM.
We prospectively evaluated consecutive patients with MM and MGUS who underwent BM aspiration as part of their clinical evaluation. The diagnostic criteria of International Myeloma Working Group (IMWG) were applied to confirm the diagnosis of MGUS and MM. Their BM supernatant was extracted from the BM aspirate and stored in EDTA tubes at –80°C. These later underwent quantification of their TCA metabolite concentrations via GC-MS.
SMM.
We also evaluated patients with a known diagnosis of SMM who were seen at the Mayo Clinic, Rochester and already had their peripheral blood or BM supernatant stored in the biobank. The diagnostic criteria of IMWG were applied to confirm the diagnosis of SMM: presence of a serum monoclonal immunoglobulin level > 3 g/dl, and/or BM infiltration with monotypic PCs equal or exceeding 10%, in the absence of end-organ damage attributable to the PC disorder.
For all MGUS, SMM, or MM patients whose peripheral blood or BM supernatant samples were evaluated for TCA metabolite concentration quantification, their relevant laboratory data including M-spike, serum free light chain (FLC) ratio, hemoglobin, total calcium, creatinine, β-2 microglobulin, immunoglobulin subtype quantification, 24-hour urinary protein electrophoresis and immunofixation, BM PC percentage and labeling index (S-phase %), cytogenetics, and fluorescent in situ hybridization (FISH) results were abstracted for analysis.
IDH1/2 exon 4 mutation assessment
Sanger sequencing of exon 4 in IDH1 and IDH2 genes was performed using dye termination chemistry with ABI 3730xl sequencer. Primer sets for PCR were designed using Primer3 (http://frodo.wi.mit.edu). Intronic primers covering sequences of interest were designed at least 20 bp away from the intron/exon boundaries. PCR were carried out using AmpliTaq Gold DNA Polymerase (Applied Biosystems) based on the standard protocol. After PCR reactions, the amplicons were treated with the ExoSAP-IT (USB) to degrade unincorporated PCR primers and deoxynucleotide triphosphates.
The cleaned products were mixed with the forward or reverse PCR primers for sequencing. IDH1-exon4 (forward), 5′ - GAGCTCTATATGCCATCACTGC - 3′; IDH1-exon4 (reverse), 5′ - CAAGTTGGAAATTTCTGGGC - 3′; IDH2-exon4 (forward), 5′ - ATTCTGGTTGAAAGATGGCG - 3′; and IDH2-exon4 (reverse), 5′ - GAGACAAGCTGGGAGAGGAG - 3′. DNA sequence variants were identified using Mutation Surveyor Analysis Software (Soft Genetics).
IHC
The c-MYC IHC stain was carried out using the Biocare MACH 3 Detection system. A 4-μm tissue section was cut from the BM core biopsy paraffin block and mounted on charged slides, which was then deparaffinized and hydrated. Endogenous peroxidase was blocked using hydrogen peroxide. Heat-induced epitope retrieval was accomplished for c-MYC using a steamer and EDTA with pH of 8.0 for 30 minutes, followed by a 5-minute cool down. Next, the slides were placed in Dako wash solution and then in the Dako autostainer. For detection of c-MYC, the slides were incubated in the first primary antibody c-MYC (Epitomics; clone Y69, catalog 1472-1, dilution 1:100) for 30 minutes, followed by incubation in a MACH 3 Rabbit Probe (Biocare Medical) for 20 minutes, a MACH 3 Rabbit Polymer (Biocare Medical) for 20 minutes, and chromagen DAB+ (DakoCytomation) for two 5-minute incubations. The slides were then counterstained in hematoxylin, dehydrated, cleared in xylene, and coverslipped. Appropriate positive controls were used. The number of PCs expressing c-MYC in their nucleus was counted and scored as a percentage of the total PC population by 2 hematopathologist reviewers independently and then rereviewed together to arrive at a uniform scoring of nuclear c-MYC expression (T. Ghosh, D. Jevremovic).
Statistics
Statistical analysis was performed using JMP statistical software (version 12, SAS Institute Inc.). Fractional abundance of 13C in the various TCA metabolites is expressed as mean ± SEM. Comparisons of the fractional abundance were performed using the 2-tailed Student’s t test, and significance was defined as P < 0.05. Comparisons between categorical variables were performed by the 2-tailed Fisher’s Exact test, and nonparametric testing was performed using the Mann-Whitney test where specified. TTP of SMM to MM was defined by the development of end-organ damage or symptoms requiring the initiation of therapy. The TTP analysis was done using the Kaplan–Meier method, and differences between TTP curves were tested for statistical significance using the Wilcoxon test unless otherwise specified.
Study approval
This study was approved by the IRB at the Mayo Clinic (Rochester, Minnesota, USA). All patients included in this study had provided written informed consent to allow their BM and peripheral blood samples, as well as clinical records, to be utilized for research purposes in this study.
Author contributions
WIG designed the study, was involved in performing the in vitro cell line studies, analyzed the data, and wrote the manuscript; VR obtained the clinical patient samples, analyzed the data, and reviewed the manuscript; TH analyzed the data and reviewed the manuscript; TG and DJ reviewed the BM biopsy slides for nuclear c-MYC expression; TD performed the bioinformatics analysis and reviewed the manuscript; DS contributed to designing the methodology used for the isotopomer assessments and reviewed the manuscript; XMP contributed in reviewing the isotopomer assessments and coordinating the metabolomic assessments; LW performed the c-MYC IHC studies on the paraffin-embedded BM biopsy blocks; SKK analyzed the patient clinical data and reviewed the manuscript; KSN was involved in designing the study and in reviewing the primary data and the manuscript.
Supplementary Material
Acknowledgments
Research reported in this publication was supported by the National Cancer Institute of the NIH under award number K23CA218742. The content is solely the responsibility of the authors and does not necessarily represent the official views of the NIH. This research is also supported in part by the Fraternal Order of the Eagles Grant of the Mayo Clinic Cancer Center, the Mayo Clinic Center for Biomedical Discovery Pilot Award, and the Marion Schwartz Foundation for Multiple Myeloma. This publication was also made possible by Mayo Clinic Metabolomics Resource Core through grant number U24DK100469 from the National Institute of Diabetes and Digestive and Kidney Diseases and originates from the NIH Director’s Common Fund. This study was also supported by Brian D. Novis research grant from the International Myeloma Foundation, the Predolin foundation, Wendy Will Case cancer fund, and small grants from the hematology division.
Version 1. 01/11/2018
Electronic publication
Footnotes
Conflict of interest: The authors have declared that no conflict of interest exists.
Reference information: JCI Insight. 2018;3(1):e94543. https://doi.org/10.1172/jci.insight.94543.
Contributor Information
Vijay Ramakrishnan, Email: Ramakrishnan.Vijay@mayo.edu.
Taro Hitosugi, Email: hitosugi.taro@mayo.edu.
Toshi Ghosh, Email: ghosh.toshi@mayo.edu.
Dragan Jevremovic, Email: jevremovic.dragan@mayo.edu.
Tumpa Dutta, Email: dutta.tumpa@mayo.edu.
Dhananjay Sakrikar, Email: dj.sakrikar@bindingsite.com.
Linda Wellik, Email: wellik.Linda@mayo.edu.
References
- 1.Vander Heiden MG, Cantley LC, Thompson CB. Understanding the Warburg effect: the metabolic requirements of cell proliferation. Science. 2009;324(5930):1029–1033. doi: 10.1126/science.1160809. [DOI] [PMC free article] [PubMed] [Google Scholar]
- 2.Dang CV, Hamaker M, Sun P, Le A, Gao P. Therapeutic targeting of cancer cell metabolism. J Mol Med. 2011;89(3):205–212. doi: 10.1007/s00109-011-0730-x. [DOI] [PMC free article] [PubMed] [Google Scholar]
- 3.Corbet C, Feron O. Cancer cell metabolism and mitochondria: Nutrient plasticity for TCA cycle fueling. Biochim Biophys Acta. 2017;1868(1):7–15. doi: 10.1016/j.bbcan.2017.01.002. [DOI] [PubMed] [Google Scholar]
- 4.Altman BJ, Stine ZE, Dang CV. From Krebs to clinic: glutamine metabolism to cancer therapy. Nat Rev Cancer. 2016;16(10):619–634. doi: 10.1038/nrc.2016.71. [DOI] [PMC free article] [PubMed] [Google Scholar]
- 5.Dang CV. Links between metabolism and cancer. Genes Dev. 2012;26(9):877–890. doi: 10.1101/gad.189365.112. [DOI] [PMC free article] [PubMed] [Google Scholar]
- 6.Kyle RA, et al. Review of 1027 patients with newly diagnosed multiple myeloma. Mayo Clin Proc. 2003;78(1):21–33. doi: 10.4065/78.1.21. [DOI] [PubMed] [Google Scholar]
- 7.Landgren O, et al. Monoclonal gammopathy of undetermined significance (MGUS) consistently precedes multiple myeloma: a prospective study. Blood. 2009;113(22):5412–5417. doi: 10.1182/blood-2008-12-194241. [DOI] [PMC free article] [PubMed] [Google Scholar]
- 8.Chng WJ, et al. Clinical and biological implications of MYC activation: a common difference between MGUS and newly diagnosed multiple myeloma. Leukemia. 2011;25(6):1026–1035. doi: 10.1038/leu.2011.53. [DOI] [PMC free article] [PubMed] [Google Scholar]
- 9.Dang CV. Rethinking the Warburg effect with Myc micromanaging glutamine metabolism. Cancer Res. 2010;70(3):859–862. doi: 10.1158/0008-5472.CAN-09-3556. [DOI] [PMC free article] [PubMed] [Google Scholar]
- 10.Bolzoni M, et al. Dependence on glutamine uptake and glutamine addiction characterize myeloma cells: a new attractive target. Blood. 2016;128(5):667–679. doi: 10.1182/blood-2016-01-690743. [DOI] [PubMed] [Google Scholar]
- 11.Balss J, et al. Pretreatment d-2-hydroxyglutarate serum levels negatively impact on outcome in IDH1-mutated acute myeloid leukemia. Leukemia. 2016;30(4):782–788. doi: 10.1038/leu.2015.317. [DOI] [PubMed] [Google Scholar]
- 12.Janin M, et al. Serum 2-hydroxyglutarate production in IDH1- and IDH2-mutated de novo acute myeloid leukemia: a study by the Acute Leukemia French Association group. J Clin Oncol. 2014;32(4):297–305. doi: 10.1200/JCO.2013.50.2047. [DOI] [PubMed] [Google Scholar]
- 13.Ward PS, et al. Identification of additional IDH mutations associated with oncometabolite R(-)-2-hydroxyglutarate production. Oncogene. 2012;31(19):2491–2498. doi: 10.1038/onc.2011.416. [DOI] [PMC free article] [PubMed] [Google Scholar]
- 14.Terunuma A, et al. MYC-driven accumulation of 2-hydroxyglutarate is associated with breast cancer prognosis. J Clin Invest. 2014;124(1):398–412. doi: 10.1172/JCI71180. [DOI] [PMC free article] [PubMed] [Google Scholar]
- 15.Fathi AT, et al. Prospective serial evaluation of 2-hydroxyglutarate, during treatment of newly diagnosed acute myeloid leukemia, to assess disease activity and therapeutic response. Blood. 2012;120(23):4649–4652. doi: 10.1182/blood-2012-06-438267. [DOI] [PubMed] [Google Scholar]
- 16.Le A, et al. Glucose-independent glutamine metabolism via TCA cycling for proliferation and survival in B cells. Cell Metab. 2012;15(1):110–121. doi: 10.1016/j.cmet.2011.12.009. [DOI] [PMC free article] [PubMed] [Google Scholar]
- 17.van Geldermalsen M, et al. ASCT2/SLC1A5 controls glutamine uptake and tumour growth in triple-negative basal-like breast cancer. Oncogene. 2016;35(24):3201–3208. doi: 10.1038/onc.2015.381. [DOI] [PMC free article] [PubMed] [Google Scholar]
- 18.Gao P, et al. c-Myc suppression of miR-23a/b enhances mitochondrial glutaminase expression and glutamine metabolism. Nature. 2009;458(7239):762–765. doi: 10.1038/nature07823. [DOI] [PMC free article] [PubMed] [Google Scholar]
- 19.Pavlova NN, Thompson CB. The Emerging Hallmarks of Cancer Metabolism. Cell Metab. 2016;23(1):27–47. doi: 10.1016/j.cmet.2015.12.006. [DOI] [PMC free article] [PubMed] [Google Scholar]
- 20.Carbonneau M, et al. The oncometabolite 2-hydroxyglutarate activates the mTOR signalling pathway. Nat Commun. 2016;7:12700. doi: 10.1038/ncomms12700. [DOI] [PMC free article] [PubMed] [Google Scholar]
- 21.Wahl DR, Venneti S. 2-Hydoxyglutarate: D/Riving Pathology in gLiomaS. Brain Pathol. 2015;25(6):760–768. doi: 10.1111/bpa.12309. [DOI] [PMC free article] [PubMed] [Google Scholar]
- 22.Dib A, Gabrea A, Glebov OK, Bergsagel PL, Kuehl WM. Characterization of MYC translocations in multiple myeloma cell lines. J Natl Cancer Inst Monogr. 2008;(39):25–31. doi: 10.1093/jncimonographs/lgn011. [DOI] [PMC free article] [PubMed] [Google Scholar]
- 23.Chesi M, et al. AID-dependent activation of a MYC transgene induces multiple myeloma in a conditional mouse model of post-germinal center malignancies. Cancer Cell. 2008;13(2):167–180. doi: 10.1016/j.ccr.2008.01.007. [DOI] [PMC free article] [PubMed] [Google Scholar]
- 24.Kyle RA, et al. A long-term study of prognosis in monoclonal gammopathy of undetermined significance. N Engl J Med. 2002;346(8):564–569. doi: 10.1056/NEJMoa01133202. [DOI] [PubMed] [Google Scholar]
- 25.Kyle RA, et al. Clinical course and prognosis of smoldering (asymptomatic) multiple myeloma. N Engl J Med. 2007;356(25):2582–2590. doi: 10.1056/NEJMoa070389. [DOI] [PubMed] [Google Scholar]
- 26.Dispenzieri A, et al. Smoldering multiple myeloma requiring treatment: time for a new definition? Blood. 2013;122(26):4172–4181. doi: 10.1182/blood-2013-08-520890. [DOI] [PMC free article] [PubMed] [Google Scholar]
- 27.Ludwig C, et al. Alterations in bone marrow metabolism are an early and consistent feature during the development of MGUS and multiple myeloma. Blood Cancer J. 2015;5:e359. doi: 10.1038/bcj.2015.85. [DOI] [PMC free article] [PubMed] [Google Scholar]
- 28.Lodi A, et al. Proton NMR-based metabolite analyses of archived serial paired serum and urine samples from myeloma patients at different stages of disease activity identifies acetylcarnitine as a novel marker of active disease. PLoS ONE. 2013;8(2):e56422. doi: 10.1371/journal.pone.0056422. [DOI] [PMC free article] [PubMed] [Google Scholar]
- 29.Puchades-Carrasco L, et al. Multiple myeloma patients have a specific serum metabolomic profile that changes after achieving complete remission. Clin Cancer Res. 2013;19(17):4770–4779. doi: 10.1158/1078-0432.CCR-12-2917. [DOI] [PubMed] [Google Scholar]
- 30.Jennings ME, Matthews DE. Determination of complex isotopomer patterns in isotopically labeled compounds by mass spectrometry. Anal Chem. 2005;77(19):6435–6444. doi: 10.1021/ac0509354. [DOI] [PMC free article] [PubMed] [Google Scholar]
Associated Data
This section collects any data citations, data availability statements, or supplementary materials included in this article.


