

Abstract
Chemical Exchange Saturation Transfer (CEST) MRI has been developed and employed in multiple clinical imaging research centers worldwide. Selective RF saturation pulses with standard 2D and 3D MRI acquisition schemes are now routinely performed, and CEST MRI can produce semi-quantitative results using Magnetization Transfer Ratio asymmetry (MTRasym) analysis while accounting for B0 inhomogeneity. Faster clinical CEST MRI acquisition methods and more quantitative acquisition and analysis routines are under development. Endogenous biomolecules with amide, amine, and hydroxyl groups have been detected during clinical CEST MRI studies, and exogenous CEST agents have also been administered to patients. These CEST MR imaging tools show promise for contributing to assessments of cerebral ischemia, neurological disorders, lymphedema, osteoarthritis, muscle physiology, and solid tumors. This review summarizes the salient features of clinical CEST MRI protocols and critically evaluates the utility of CEST MRI for these clinical imaging applications.
1. Introduction
Magnetic Resonance Imaging (MRI) has profoundly changed clinical diagnoses of tissue anatomy and function, but current MRI techniques in clinical practice have had much less impact on diagnoses at a molecular level. The developing field of Chemical Exchange Saturation Transfer (CEST) MRI has potential to provide molecular information for diagnosing pathological tissues and the detection of molecular responses to treatment [1,2]. This potential to provide molecular imaging has driven substantial research efforts to translate CEST MRI methods to the modern radiology clinic. This review describes the current status of clinical CEST MRI, and the current diagnostic applications that have recently been interrogated with clinical CEST MRI with an emphasis on the molecular-level information associated with each pathology.
2. The case for CEST MRI as a molecular imaging technique
To perform CEST MRI, a radio frequency (RF) pulse is applied at the MR frequency of a proton (the nucleus of a hydrogen atom) on an exogenous agent or endogenous biomolecule that can exchange with the protons on water molecules (Fig. 1a). The RF pulse saturates the net magnetic signal from the population of the exchangeable proton, which reduces the net signal detected by MRI. The saturated protons then exchange with water protons, resulting in a partial loss of net water signal. The RF saturation pulse is typically applied in the clinic at a low saturation power of 0.5–6 μT to improve the selectivity of saturating only the MR signal of the intended proton of a specific agent or biomolecule, hopefully without also saturating the MR signals of other protons, including water protons. In addition, the RF saturation is typically applied for a long duration of ~1–5 seconds to allow saturation to reach steady state [3,4]. During this saturation period, the exchange of protons between water and the agent or biomolecule can occur at a chemical exchange rate of ~30–1,000 Hz, thereby resulting in ~30–5,000 saturated protons transferred to water from each agent or biomolecule (ignoring the effects of T1 relaxation). With sufficient saturation and chemical exchange rate, as little as ~2 mM of exchangeable protons on an exogenous agent or endogenous biomolecule can generate a ~2% decrease in water signal, which can be quantitatively detected with standard MR acquisition methods (this evaluation is based on an estimate of 72% water composition in tissues; an exchange rate of 1,600 Hz; saturation for 1 second; 55.5 M concentration of H2O molecules in pure water; and two protons per H2O molecule). Therefore, CEST MRI has potential to provide image contrast based on specific molecular compositions at relevant millimolar physiological concentrations.
Figure 1.
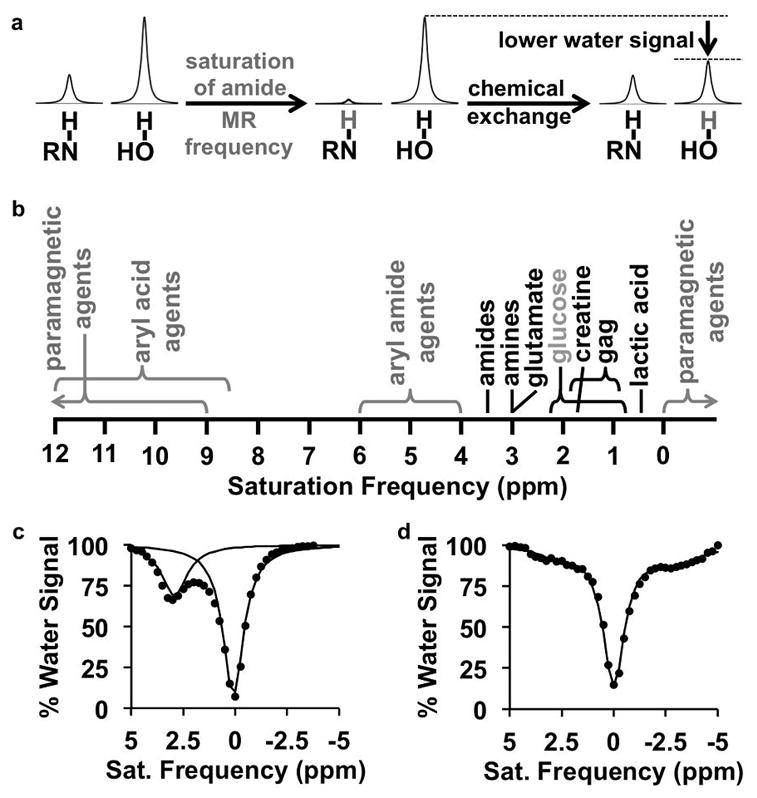
CEST MRI. a: The CEST mechanism consists of selective saturation of a labile hydrogen atom (shown in gray), and chemical exchange of this hydrogen with a hydrogen on a water molecule, which transfers the saturation to water and lowers the net coherent MR signal from water. b: Exogenous agents (gray) and endogenous biomolecules (black) are detected by applying a saturation at a specific MR frequency as listed in the chart. Many paramagnetic agents can have MR frequencies beyond the ends of the chart. c: A CEST spectrum of glutamate with 3.6 μT saturation power applied for 5 sec shows a decrease in % water signal at 3.0 ppm. The spectrum was fit with a sum of two Lorentzian line shapes, and each Lorentzian line shape is shown on the graph. d: An endogenous CEST spectrum of a mouse with 2 μT saturation power applied for 2 sec shows CEST from endogenous biomolecules at 1–3.5 ppm, and magnetization transfer from endogenous biomolecules at -2.5 to -4 ppm. The spectrum was fit with a sum of three Lorentzian line shapes, and the sum of the line shapes is shown as a solid line on the graph.
The CEST spectrum demonstrates the molecular specificity of this imaging technique, whereby exogenous agents or endogenous biomolecules can be selectively detected by their unique MR frequencies in the spectrum (a.k.a. chemical shifts measured in units of ppm; Fig. 1b). To generate a CEST spectrum at each voxel location, standard clinical CEST MRI acquisition methods repeat the selective RF saturation over a range of saturation frequencies to iteratively acquire a series of CEST-weighted images. A CEST spectrum is simply a plot of water signal amplitude of a voxel vs. saturation frequency (Fig. 1c) [1]. A CEST spectrum is also known as a Z-spectrum, because the spectrum represents the remaining net coherent magnetization immediately prior to image signal acquisition along the Z-axis [5]. The CEST spectrum is a convenient representation because one or more CEST effects, as well as the direct saturation of bulk water at 0 ppm, can be viewed in a single graph. The semi-solid molecular components in tissues cause a Magnetization Transfer (MT) effect that transfers saturation either through space or through similar chemical exchange of protons from the semi-solid components [6]. The MT effect creates a broad baseline signal [7] and also causes asymmetric features in the negative ppm range of the CEST spectrum (Fig. 1d) [8–11]. The MT effect must also be evaluated when quantitatively measuring CEST contrast generated from specific agents or biomolecules.
3. Important considerations for a clinical CEST MRI protocol
3.1. The saturation pulse
Using a multisecond saturation RF pulse or a multisecond series of pulses for clinical CEST MRI initially raised concerns regarding tissue heating and patient safety. However, many CEST MRI studies in human brain and torso have been safely performed with long, low-power saturation pulses, so that the safety of CEST saturation is no longer a contentious issue. The use of shaped pulses, most often Gaussian shapes [12,13], adiabatic pulse shapes [14] and other pulse shapes optimized for CEST imaging [15], has been shown to produce almost the same saturation as a square-shaped pulse and with reduced off-resonance saturation effects, especially for protons with slower chemical exchange rates. In some cases, shorter saturation pulses have been interleaved with the MR acquisition scheme, which lowers the duty cycle of saturation power and can accommodate rapid endogenous T2 relaxation, but at the expense of generating less saturation [16,17].
To date, there has been no consensus with regard to the total saturation time or power to be used for clinical CST MRI studies (Fig. 2). In particular, the use of less saturation power can potentially reduce the direct saturation of water when irradiating MR frequencies closer to the water frequency. Yet there has surprisingly been no correlation between saturation power or time with respect to saturation frequency among currently reported studies. Furthermore, the capabilities of the RF amplifier and transmitter coils of clinical MRI instruments can limit the selection of multi-second pulses, and can generate significant B1 inhomogeneity (i.e., spatial variability with regard to pulse power) [18]. Hardware limitations and B1 inhomogeneity need to be addressed to ensure that a consensus of saturation parameters can eventually be employed in multiple radiology clinics.
Figure 2.
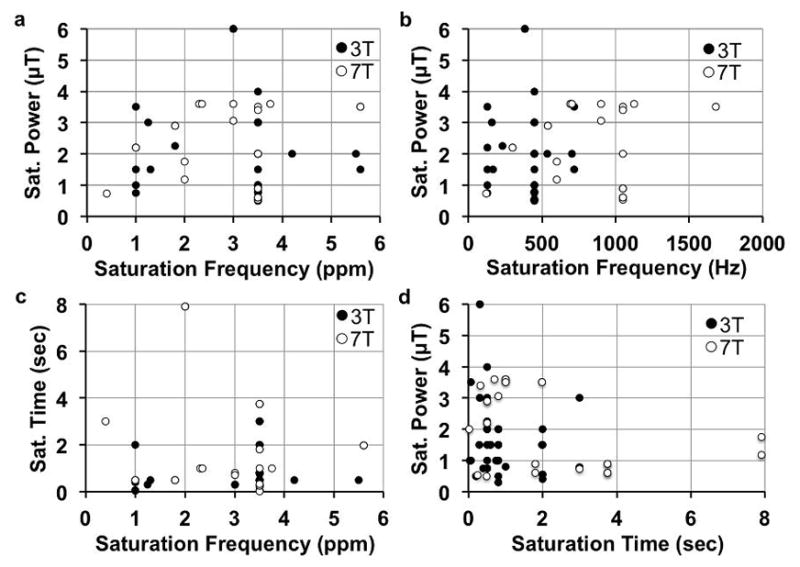
Clinical CEST MRI saturation parameters. A total of 60 published reports were surveyed that listed saturation power, time, magnetic field strength, and single saturation frequency that was analyzed. a,b: The saturation powers used in clinical CEST MRI studies have not been correlated with the investigated saturation frequencies, in units of ppm or Hz (ppm x magnetic field strength). c: The saturation times used in clinical CEST MRI studies have not been correlated with saturation frequency. d: The saturation powers and times used in clinical CEST MRI studies have not been correlated. An additional 10 studies that analyzed a range of saturation frequencies were not included in these graphs. Yet these 10 additional studies also did not show correlations between saturation parameters.
3.2. The MRI acquisition protocol
The acquisition of the CEST-weighted images must be rapid, before T1 relaxation reduces the amplitude of the CEST contrast [16]. As evidence, CEST contrast can decrease after administration of a gadolinium-based T1 contrast gent, which also shows that endogenous CEST MRI should be acquired before the application of a contrast agent [19]. Also, acquiring a series of MR images required for a CEST spectrum must be accomplished in a practical time for clinical throughput, which requires rapid imaging. Gradient echo imaging is often used for 2D image acquisitions [20], although echo planar imaging [21] and rapid acquisition with relaxation enhancement imaging [22] have also been used in the clinic. Gradient echo imaging has most often been used for 3D CEST MRI [23]. Although these acquisition methods provide opportunities for many clinical studies, other methods are under development to improve acquisition speed and detection specificity.
Rapid acquisition methods are being investigated and implemented to accelerate CEST MRI. Radial [24] and spiral [25] acquisition schemes also produce rapid acquisition protocols for clinical CEST MRI that are relatively insensitive to patient motion, although these techniques are still very new and have only been reported as conference proceedings. A clever keyhole imaging method can more rapidly acquire a series of CEST-weighed images that cover a range of MR saturation frequencies [26]. More recently, parallel imaging and compressed sensing have been combined to accelerate acquisition times [27], and MR fingerprinting [28] methods have been developed for fast CEST MRI protocols. The ultrafast CEST MRI method can rapidly perform CEST MRI studies, although this method requires more development for clinical use. Ultrafast CEST MRI applies a magnetic field gradient across the tissue that spatially spreads the MR frequency of the water and the CEST biomolecule or agent, and then applies frequency-selective saturation that generates a spatially encoded CEST spectrum [29,30]. This method is “ultrafast”, because the entire CEST spectrum is generated with only one RF saturation pulse. However, the tissue must be homogenous across the space that is encoded by the magnetic field gradients, which has currently limited clinical applications of this technique to imaging small brain regions. As a final example, CEST MRI contrast can be rapidly generated by selectively irradiating the MR resonance of water, using on-resonance paramagnetic chemical exchange effect (OPARACHEE) MRI [31], Quantifying exchange with saturation power on the water resonance (QUESPOWR) MRI [32], or onVDMP MRI [33]. These methods only require the acquisition of one or two MR images because only the water frequency is irradiated, but these methods lose the specificity for detecting just one endogenous biomolecule or exogenous agent.
A variety of acquisition methods have been developed to improve the specificity of detecting CEST, or to detect CEST from specific sources. Saturation with frequency alternating RF irradiation (SAFARI) only requires the acquisition of three MR images, and a sum of these images can remove symmetrical MT effects [34]. A series of SAFARI acquisitions with a range of saturation powers can measure exchange rates, which may be used to more selectively detect a specific endogenous biomolecule or exogenous agent with a unique chemical exchange rate. Similarly, variable delay multiple pulse train (VDMP) CEST MRI acquires two MR images with different interpulse delays, and the difference between these images detects CEST contrast only from biomolecules or agents with a specific range of chemical exchange rates [35]. A technique that is similar to VDMP, known as Frequency labeled exchange transfer (FLEX) MRI, uses a series of interpulse delays to label exchangeable protons with their chemical shift evolution. Both VDMP and FLEX MRI have been used to remove MT effects and direct saturation of water while detecting CEST effects in the human brain [36, 37]. Chemical Exchange Rotation Transfer (CERT) MRI [38] acquires two images with RF saturation that uses π and 2π radian rotation angles at one frequency, rather than using the same rotation angle for two frequencies as acquired for conventional CEST MRI. By using the same saturation frequency for both images, CERT avoids confounding contributions from B0 inhomogeneities and asymmetric MT effects, which improves the specificity of the results. As a final example, a spin-locking RF pulse can be used rather than a saturation pulse to interrogate chemical exchange [39]. A spin-lock applied on the water resonance is most sensitive to intermediate chemical exchange rates, providing some specificity for detecting hydroxyl and amine protons. A spin-lock applied at a frequency other than the water frequency is most sensitive to slow chemical exchange rates, especially when the spin lock power matches the exchanging rate, which provides specificity for detecting endogenous amide protons.
3.3. CEST MRI analysis methods
The most simplistic analysis method requires an MR image with selective RF saturation at the MR frequency (defined as ω) of the proton on the agent or biomolecule to be interrogated, and a second MR image with RF saturation at a control frequency (-ω). The Magnetization Transfer Ratio asymmetry (MTRasym) analysis method uses this simplistic approach to compare the effects of symmetric RF saturation at frequencies ω and -ω on either side of the water resonance to determine the % CEST signal [40]. However, the CEST spectrum is inherently asymmetric (Fig. 1d) [8,9], so that MTRasym measurements are inaccurate (yet as shown in examples below, even semi-quantitative MTRasym analyses can be used for clinical diagnoses). Furthermore, the B0 inhomogeneity of the static magnetic field causes the entire CEST spectrum to shift by different amounts at each voxel location, which compromises the symmetry-dependent MTRasym analysis method. For these reasons, B0 mapping methods must be incorporated with CEST MRI acquisitions that measure MTRasym, which lengthens total scan times [41,42].
Alternatively, a series of many RF frequencies can be iteratively saturated to generate a full CEST spectrum. Methods to optimize the list of RF saturation frequencies have been developed, which can reduce clinical acquisition times [43]. The acquisition of a full CEST spectrum provides opportunities for more accurate analysis methods. For example, a series of analytical methods can account for “RF spillover”, or unintended direct saturation of the water when the MR frequency of the proton on the agent or biomolecule is close to the MR frequency of water [40,44]. An analysis method that accounts for apparent exchange-dependent relaxation (AREX) can remove the background MT effect when analyzing CEST spectra, while also using a T1 relaxation map to correct for the effects of T1 relaxation on CEST amplitudes, to measure a pure APT signal amplitude [45]. The CEST signals, MT, and direct saturation of water in a full CEST spectrum can be simultaneously analyzed with the Bloch equations modified for chemical exchange (also known as the Bloch-McConnell equations) [7,46]. This fitting method requires extensive computation time and substantial expertise with a matrix exponential in inhomogenous form [47] or homogenous form [48], or by calculating the eigenvalue of the matrix corresponding to slow water signal decay [49]. Alternatively, spectral features in the CEST spectrum can be fit with Lorentzian line shapes, which works best when analyzing the CEST spectrum acquired at low saturation power and with samples or tissues that have long T2 relaxation times [50,51]. Finally, these analysis methods may need to account for significant temporal drift in B0 and B1 field caused by the heating of gradient amplifiers or samples, especially when acquisition methods with high saturation powers or high duty cycles are used [52,53].
4. Amide Proton Transfer
Amide protons typically have a chemical exchange rate of ~30 Hz [54]. Although the amides of semi-solid proteins have a broad range of MR frequencies and short T1 & T2 relaxation time constants that can generate MT effects, mobile proteins and peptides have longer relaxation times and have amide groups that exhibit a more narrow range of MR frequencies centered at approximately 3.5 ppm. The concentration of amide groups in endogenous mobile peptides and proteins is approximately 5 to 8 mM in most tissues [54,55]. These three conditions are appropriate for detection of amide protons with CEST MRI. This important source of CEST MRI contrast is often described as Amide Proton Transfer (APT) MRI.
4A. APT MRI of cerebrovascular stroke
APT MRI has shown excellent success in identifying ischemic regions of brain tissue in patients that have suffered a cerebrovascular stroke. Decreased cerebral blood flow during a stroke causes an increase in ATP hydrolysis and reduced bicarbonate buffering, which causes the intracellular pH to decrease [56]. This decreased pH causes a decrease in the exchange rate of amide protons, because the chemical exchange of amides in proteins is base-catalyzed. This decrease in the exchange rates of amide protons causes ischemic tissue to have decreased APT MRI contrast, which can be detected even with a relatively low 0.5 μT saturation power (Fig. 3) [57]. The ischemic core can show a significant decrease in APT compared to the hypoperfused region surrounding the infarcted tissue that ultimately survives [57,58]. Furthermore, studies with rat models (that have yet to be translated to the clinic) indicate that hemorrhagic vs. ischemic stroke can be distinguished by hyperintense vs. hypointense APT MRI contrast [59]. This strong evidence attests that APT MRI may benefit a MRI stroke protocol at 3 T magnetic field strength to provide diagnostic imaging information that complements anatomical MR imaging, arterial spin labeled imaging, and perfusion- and diffusion-weighted imaging.
Figure 3.
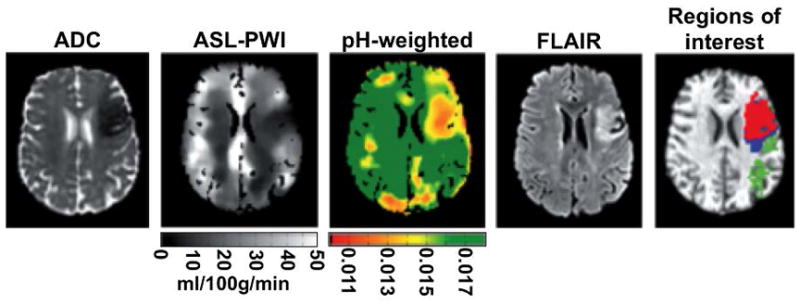
APT MRI of cerebral ischemia. A 53 year old female patient with total anterior circulation stroke was imaged 2:48 hours after onset with diffusion-weighted MRI to obtain a map of apparent diffusion coefficient (ADC), arterial spin labeling-perfusion weighted imaging (ASL-PWI) to generate a map of cerebral blood flow, and APT MRI with saturation at 0.55 μT for 2 s at 3 T to generate a pH-weighted map (scale in arbitrary units). The patient was imaged 34 days later with fluid attenuated inversion recovery (FLAIR) MRI, and regions of interest were identified (green = oligaemia; blue = infarct growth; red = ischaemic core). Adapted with permission from reference 57.
4B. APT MRI of neurological disorders
The biochemical neuropathology of multiple sclerosis (MS) in the brain and spinal cord includes the accumulation of mobile proteins in normal-appearing white matter. This protein accumulation increases the APT MRI contrast, which can be detected at 7 T and a moderate 2–3.5 μT saturation power (Fig. 4) [60]. In addition, analysis of the CEST spectrum shows increased asymmetry around the amide CEST peak in lesions and normal-appearing white matter in the spine of MS patients compared to healthy white matter in healthy subjects [61]. More recently, APT MRI has been suggested as a method to detect reduced mobile protein content related to Alzheimer’s Disease, but this use of APT MRI has not yet been translated to clinical studies [62]. Importantly, the NOE at approximately -3.5 ppm can also change as a consequence of a neurological disorder, causing MTRasym analysis to change even if the APT signal at +3.5 ppm does not change. For this reason, more sophisticated analysis methods described in section 3.3 may be required to improve the diagnostic value of CEST MRI for these pathologies.
Figure 4.
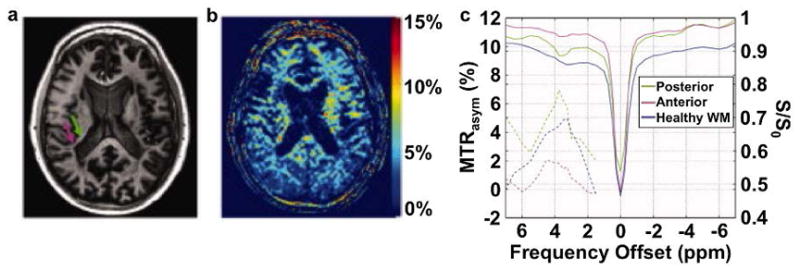
APT MRI of multiple sclerosis. A: A T1-weighted MR image identified the heterogeneous periventricular lesion with an anterior hypointense region (green arrow) and a posterior hyperintense region (magenta arrow). c: The MTRasym map with saturation at 3.5 μT for 1 s at 7 T magnetic field strength showed that the lesion had increased MTRasym. C: CEST spectra (right y-axis) and MTRasym (left y-axis) showed strongest CEST signal in the posterior region. Adapted with permission from reference 60.
4C. APT MRI of lymphedema
Lymphedema is swelling caused by the accumulation of protein-rich lymph fluid in the interstitium when the lymphatic load exceeds the lymphatic transport capacity. In particular, breast cancer treatment-related lymphedema (BCRL) is one of the most frequent complications among patients with breast cancer. This elevated interstitial protein accumulation can be detected in the affected arms of BCRL patients with APT MRI relative to the contralateral arm, while no significant difference between arms of healthy volunteers was detected with APT MRI (Fig. 5) [63]. This study was performed with 1.0 μT saturation power and 3 T magnetic field, which facilitates dissemination of this technique for studying BCRL and other types of lymphedema.
Figure 5.
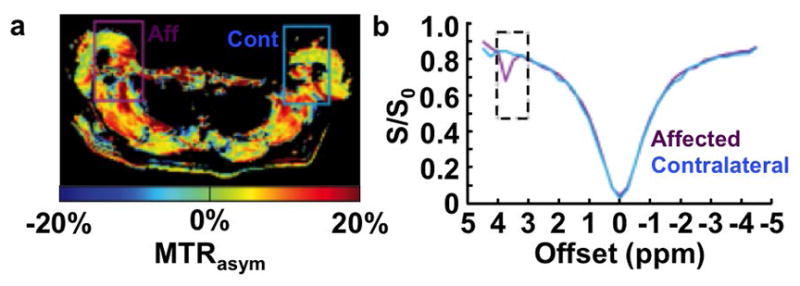
APT MRI of lymphedema. a: A spatial map and b: CEST spectra of MTRasym with saturation at 1 μT for 75 ms at 3 T magnetic field strength shows stronger CEST in the affected lymphedematous arm (Aff) than the contralateral arm (Cont) of a 42 year old female patient previously treated for breast cancer with tamoxiphen chemotherapy. Adapted with permission from reference 63.
4D. APT MRI of solid tumors
APT MRI has been used empirically to analyze solid tumors, although the interpretation of the imaging contrast is still under study. Strong evidence indicates that the concentrations of mobile proteins and peptides are higher in tumors [55], which generate higher APT MRI contrast [64,65]. Metabolically active tumors produce excess lactic acid in the extracellular tumor microenvironment as a consequence of enhanced aerobic glycolysis, known as the Warburg effect [66]. This decrease in tumor pH should generate lower APT MRI contrast due to slower exchange rates from amide groups because the chemical exchange of protons from amides to water is base-catalyzed. These two counteracting conditions can cause the APT MRI contrast from tumors to be only slightly higher or unchanged relative to normal tissues, especially for low-grade tumors (Fig 6a) [67]. Furthermore, the MTRasym analysis of CEST at +3.5 ppm relies on the control MR signal with saturation at -3.5 ppm. Yet tumors have a reduced background MT effect with saturation at -3.5 ppm, which creates a poor control MR signal and causes the APT contrast at +3.5 ppm measured by MTRasym to appear artificially high (see section 3.3 for details about MTRasym analysis) [52]. The background MT effect at +3.5 ppm can also complicate the analysis of the pure APT contrast at this MR frequency [68].
Figure 6.
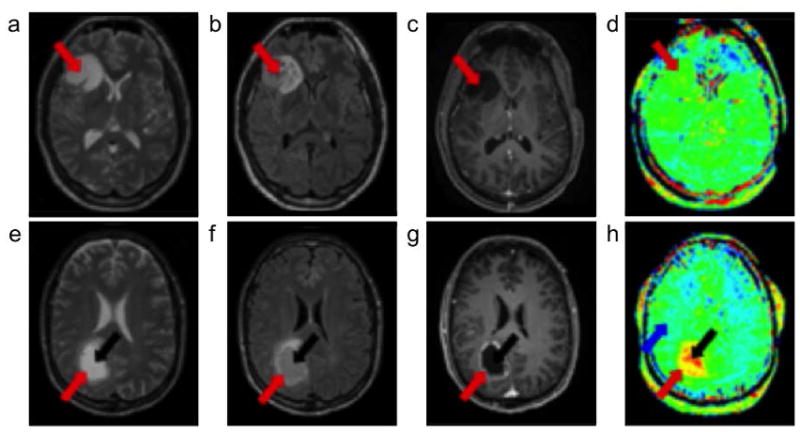
APT MRI of cancer. a–d: A 30 year old female patient with low-grade oligodendroglioma and e–h: a 58 year old male patient with high-grade glioblastoma were scanned. a,e: T2-weighted images and b,f: fluid attenuated inversion recovery images that showed the locations of the tumor rim (red arrow) and core (black arrow). c,g: Gadolinium-enhanced T1-weighted images showed no contrast enhancement for the low-grade tumor, and an enhancing rim with a nonenhancing central area for the high-grade tumor. d,h: APT-weighted images showed isointensity compared with contralateral brain tissue for the low-grade tumor, and hyperintensity compared to normal brain tissue (blue arrow) for the high-grade tumor. Adapted with permission from reference 73.
Despite these complications, clinical APT MRI at 3 T and 7 T magnetic field strengths has shown promising empirical utility to improve assessments of tumors in the breast and brain (Fig. 6b) [23,69–72]. APT MRI contrast has shown a positive correlation with tumor grade as assessed with histopathology [73–75]. Treatment has been shown to reduce APT MRI contrast [76,77]. Correspondingly, APT MRI generated lower contrast in pseudoprogression from post-treatment inflammation compared to recurrent glioma [78]. High APT MRI contrast has been more correlated with high grade gliomas than strongly enhancing imaging regions with gadolinium-based MRI contrast agents. Higher saturation powers have produced stronger CEST contrast in these studies, among the wide range of 0.5 to 4.0 μT saturation powers tested (Fig. 2). Notably, amide protons have a slow ~30 Hz chemical exchange rate that should produce maximum CEST contrast at ~1.0 μT saturation power. Therefore, stronger CEST contrast produced with saturation powers much greater than 1.0 μT may be due to effects other than APT from amide protons. This issue exemplifies how CEST MRI can be complicated to interpret.
Future clinical studies of tumor imaging with APT MRI should take care to avoid misinterpreting cystic, necrotic, or hemorrhagic areas as viable tumor in APT MR images, because tumor necrosis and hemorrhage can also have higher mobile protein concentrations [79]. T1- and T2-weighted MRI scans are typically acquired before CEST scans to delineate these regions. Additionally, the T1 relaxation time constant of gray matter is ~60% longer than for white matter, which allows a stronger CEST effect to be generated in gray matter that can be misinterpreted as a stronger ATP MRI contrast associated with brain tumors [80]. Therefore, normal gray and white matter should be mapped in future clinical APT MRI studies that analyze brain tumors. Similar T1 relaxation maps should be incorporated into APT MRI analyses of other tumor types as well. Alternatively, CEST analysis methods that compensate for T1 relaxation should be used to improve CEST quantification, such as CESTR* analysis with T1 and T2 compensation [45].
5. Amine CEST MRI of solid tumors
Similar to APT MRI arising from endogenous amide protons, the amine protons of endogenous mobile proteins, peptides and amino acids can generate clinical CEST MRI contrast with selective saturation at 3.0 ppm, even at 3 T magnetic field strength [81]. As with amide protons, the chemical exchange of amine protons with water is base-catalyzed. Importantly, the rate of chemical exchange of amine protons with water is faster than with amide protons and can be too fast to generate CEST at high pH greater than 7.0. Therefore, an acidic tumor microenvironment less than pH 7.0 slows the chemical exchange of amide protons, causing an increase in CEST contrast. This pH dependence works synergistically with the higher concentration of mobile proteins and peptides in tumors, causing amine CEST MRI contrast to be higher in acidic tumors (Fig. 7). In addition, the faster chemical exchange rate of amine protons relative to amide protons has potential to generate stronger overall CEST MRI contrast, and can be generated with a shorter saturation pulse that can shorten the total acquisition time. The faster chemical exchange rate of amines requires a high 6 μT saturation power to generate good CEST contrast. A clever combination of APT MRI and amine CEST MRI compares the ratio of CEST contrasts at 3.5 and 2.75 ppm to exploit the opposite pH dependencies of CEST signal amplitudes on the chemical exchange rates of amide and amine protons, known as amine/amide concentration-independent detection (AACID) [82]. This combination method has shown promise for detecting changes in response to antitumor treatment, but has not yet been translated to the clinic [83]. The same concerns regarding the interpretation of APT MRI should be applied to amine CEST MRI and AACID MRI, including consideration for cystic, necrotic, or hemorrhagic areas and the effects of relaxation times, which may lead to lower-than-anticipated differences in CEST contrast in tumor vs. normal tissues in clinical amine CEST maps [84]. Furthermore, the CEST spectra of amides and amines have moderately broad CEST peaks. Saturation at 3.5 ppm may generate some CEST from amines and saturation at 3.0 or 2.75 ppm may generate some CEST from amides. This potential to saturate multiple types of protons should be considered when interpreting endogenous CEST MRI results. Newer acquisition methods that improve the specificity of only detecting amides or amines may improve these types of endogenous CEST MRI studies.
Figure 7.
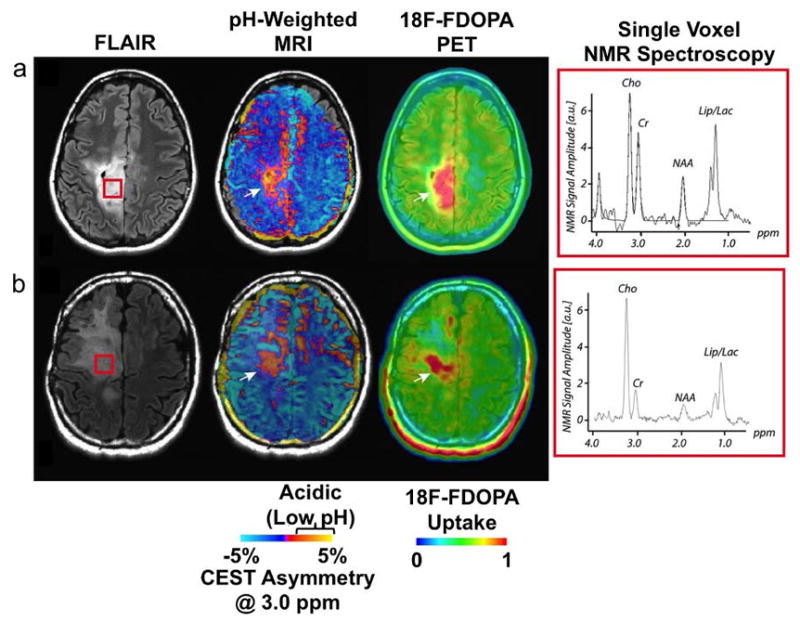
Amine CEST MRI of cancer. a,b: Two patients with anaplastic astrocytomas localized with fluid attenuated inversion recovery (FLAIR) imaging (left) showed CEST asymmetry at 3.0 ppm, which was interpreted to arise from low pH areas (center). These regions of low pH matched 18F-FDOPA uptake measured with positron emission tomography (right) and c: lactate measured from NMR spectroscopy taken from the brain area shown in the red box in the anatomical FLAIR images. Cho = choline; Cr = creatine; NAA = N-acetyl aspartate; Lip/Lac = mobile lipids and/or lactate. Adapted with permission from reference 81.
6. gagCEST MRI of osteoarthritis
Glycosaminoglycans (GAGs) serve an important role in cartilage of the knee and intervertebral discs, and the loss of GAG is an early indicator of osteoarthritis in the knee and spine [85]. GAGs have amide protons with a MR frequency of 3.2 ppm and hydroxyl protons with MR frequencies ranging from 0.9 to 1.9 ppm (detection ranges between 0 and 2.0 ppm have also been reported). Although both types of exchangeable protons generate CEST contrast, the hydroxyl protons have a faster average chemical exchange rate (>1000 Hz vs. 10–30 Hz) and higher concentration (350–400 mM vs. 100–125 mM) than the amide protons in vivo [86,87]. Therefore, gagCEST MRI focuses on the greater CEST contrast generated from the hydroxyl protons of GAGs. GagCEST MRI studies show better performance at 7 T magnetic field strength due to the close proximities of the MR frequencies of the hydroxyl protons and water [88], although many recent studies at 3 T magnetic fields have also been performed. A wide range of saturation powers of 0.5 to 3.5 μT have been tested, and consensus regarding the best saturation power has yet to be reached.
GagCEST MRI has shown promise for diagnosing osteoarthritis in the knee (Fig. 8a). Low MTRasym values suggest low GAG concentrations in the patellar facet and the femoral trochlea in patients with high knee pain scores [89], in the trochlear groove and tibial cartilage of normal volunteers [14], and in surgically repaired cartilage [90]. GagCEST MTRasym values showed a greater correlation with pain scores than quantitative measurements made with conventional MR images [91]. To confirm these results, gagCEST MRI has shown diagnostic performance that was similar to delayed Gadolinium Enhanced MRI Contrast (dGEMRIC), T2-weighted MRI, and 23Na MRI [90,92].
Figure 8.
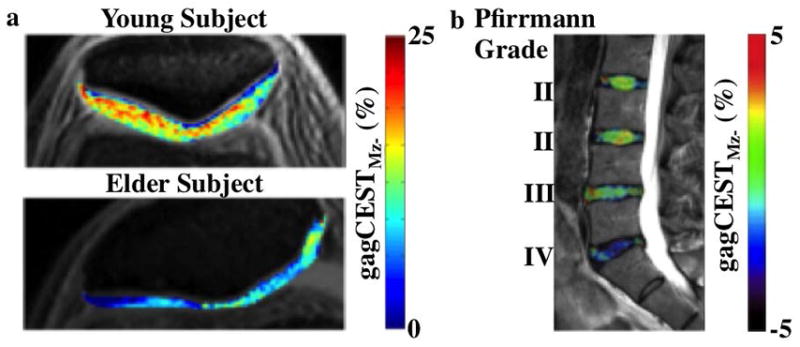
GagCEST MRI of knee and spine. a: maps of patallar cartilage in a young volunteer and an elderly 65 year old male patient with knee pain showed differences in gagCEST signal, after applying 2.2 μT saturation for 0.5 s at 7 T magnetic field strength. b: gagCEST signal at 0.5–1.5 ppm was measured with 0.8 μT saturation power applied for 1 sec at 3 T magnetic field strength, which was overlayed on a saggital T2-weighted MR image of lumbar intervertebral disks of a 41-year-old male patient. Decreased gagCEST contrast was observed with increasing Pfirrmann grade that scores intervertebral disk degeneration. Adapted with permission from references 97 and 99.
GagCEST MRI has also shown promise for analyzing the GAG composition of intervertebral disks (Fig. 8b). Lower MTRasym values from gagCEST studies showed a moderate correlation with the severity of lumbar degenerative disc disease [92–94]. GagCEST MRI contrast was significantly lower in patients with spondyloarthritis [95] and facet tropism [96], and was correlated with the degree of reported back pain [97]. However, gagCEST MRI contrast may also decrease with age regardless of symptoms [98,99], suggesting that additional studies are needed to assess the specificity of gagCEST MRI for all patients.
7. gluCEST MRI of neurological disorders
A great number of metabolites have exchangeable protons that can generate a CEST effect. Selectively detecting only a single metabolite amidst the great number of metabolites within tissues is daunting due to the strong overlap of the MR frequencies of these metabolites. Glutamate is a remarkable exception that shows a CEST peak at 3.0 ppm through chemical exchange from the amine group. As another advantage, glutamate is often present at higher concentrations than other metabolites in the brain, which facilitates the CEST detection of glutamate. The imaging of glutamate with CEST MRI, known as gluCEST MRI, has been successfully performed in healthy brain tissue and the spinal cord [100–103]. A 3.6 μT saturation power is used to generate strong CEST contrast, and this relatively high saturation power is reasonable considering the separation of the MR frequencies of glutamate and water, and the fast exchange rate of the labile protons on glutamate. As a limitation, clinical gluCEST MRI studies have only been performed at 7 T magnetic field strength, which offers more selective saturation of glutamate than at 3 T.
GluCEST MRI has shown strong potential for improving clinical diagnoses. First, to validate that gluCEST MRI is specific for glutamate, MTRasym analysis showed that the glutamate distribution between gray and white matter was similar to PET maps that used a radionuclide agent that targeted the glutamate receptor [101]. Additionally, the gluCEST ratio from gray and white matter is strongly correlated with the ratio of glutamate concentration measured with 1H MR spectroscopy [100,101]. A gluCEST MRI brain study correctly lateralized the temporal lobe seizure focus in patients with epilepsy, which was corroborated with MR spectroscopy (Fig. 9) [102]. Relative glutamate concentrations in the spinal cord may serve as an additional biomarker for multiple sclerosis, which may complement the mobile protein content measurements made with APT MRI [103].
Figure 9.

GluCEST MRI of temporal lobe epilepsy (TLE). Two epilepsy patients with a,b: nonlesional right TLE showed a visible increase in the GluCEST signal in the right hippocampus, while c,d: two patients with nonlesional left TLE showed increased GluCEST signal in the left hippocampus. Images were acquired with a: a 40 year old female patient; b: a 47 year old female patient; c: a 25 year old female patient; d: and a 47 year old male patient, with 3.06 μT saturation power applied for 0.8 s at 7 T magnetic field strength. Adapted with permission from reference 102.
8. CrCEST MRI and LATEST MRI of muscle physiology
The specificity of metabolite detection can be improved by changing a metabolite’s concentration while other metabolite concentrations are unchanged, and then obtaining the difference in CEST MRI results before and after the change in concentration. This strategy has been successfully employed to detect a change in creatine [104–106] and lactate [107] concentrations in human leg muscle before and after 2–3 minutes of mild-to-moderate exercise (Fig. 10). Importantly, these CEST MRI results are not affected by increased blood perfusion in muscle after exercise [108]. Validation with MR spectroscopy at lower spatial resolution showed that CEST MRI was correlated with changes in concentration for each metabolite. In addition, an increase in lactate concentration can be detected in solid tumors after intravenously administered pyruvate is metabolized to lactate due to enhanced aerobic glycolysis in cancer cells, although this technique has not yet been translated to the clinic [107].
Figure 10.
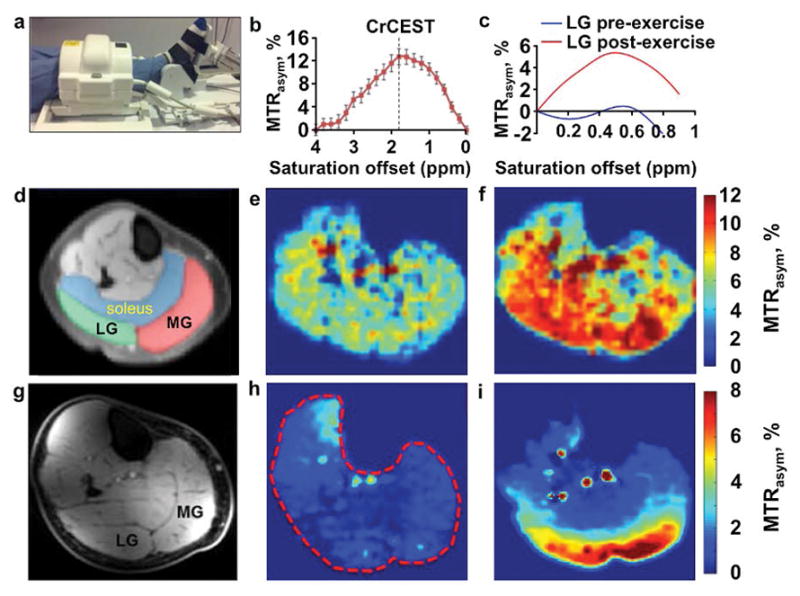
CrCEST and LATEST MRI of muscle metabolism. a: A volunteer used a foot pedal in the magnet for mild plantar flexion exercise, and the lower leg was imaged with a 28-channel knee coil. MTRasym plots of b: crCEST after exercise, and c: LATEST in the later gastrocnemius muscle before and after exercise, showed strong CEST signals at 1.9 ppm and 0.5 ppm, respectively. d,g: Anatomical images of human calf muscle showed the locations of the soleus, medial gastrocnemius (MG) and lateral gastrocnemius (LG). e,h: MTRasym maps before and f,i: after exercise show a signal increase the MG and LG muscles that indicated accumulation of e,f: creatine and h,i: lactic acid. CrCEST images were acquired with saturation applied at 2.9 μT power for 1 s, and LATEST images were acquired with 0.73 μT power for 3 s. Both image sets were corrected for corrected for B0 and B1 inhomogeneities. CrCEST and LATEST studies were performed at 3 T and 7 T magnetic field strengths, respectively. Adapted with permission from references 104, 105 and 107.
Creatine CEST (CrCEST) MRI detects a change in the CEST effect at 1.8 ppm from the guanidinium group of creatine, while lactate CEST (LATEST) MRI detects a change in CEST at 0.4 ppm from the hydroxyl group of lactate [107]. As an example of the importance of optimizing an MRI protocol to detect a specific biomarker, clinical CrCEST MRI has been performed at 3 T and 7 T magnetic strengths, while clinical LATEST MRI after exercise has only been demonstrated at 7 T due to the close proximity of the MR frequencies of lactate and water. Also, CrCEST MRI has been performed with higher 1.75–2.9 μT saturation power to accommodate the fast chemical exchange rate of creatine’s guanidinium group, while LATEST MRI was performed with lower 0.73–1.17 μT saturation power again due to the proximities of the MR frequencies of lactate and water. Despite the use of low saturation powers, the CrCEST and LATEST CEST spectra have broad, overlapping CEST signals, raising a concern that CrCEST may be affected by lactate and LATEST may be influenced by creatine, potentially compromising the specificity of each CEST technique. This issue of specificity is a common issue among many CEST MRI methods that are designed to detect a single endogenous metabolite, which must be considered when interpreting the results from clinical studies or when selecting an acquisition method that may have improved specificity.
9. Exogenous CEST agents
Similar to CrCEST and LATEST MRI, the use of an exogenous CEST agent has the powerful advantage of acquiring CEST MRI images before and after administration of the agent, so that the difference between the images can isolate the CEST effect from the agent (assuming that all other CEST sources are static). However, potential safety issues must be thoroughly evaluated to obtain clinical approval to use an exogenous agent, which is a lengthy and expensive process [109]. Current clinical studies with exogenous CEST agents have been limited to molecules that are already approved for clinical use.
Exogenous CEST agents pose unique challenges for MRI acquisition and analysis. Small molecule agents often have rapid uptake and clearance in pathologic and normal tissues, typically providing only a ~30-minute window after administration to detect the agent [110]. Furthermore, the concentration of the agent changes throughout this ~30-minute detection window. Therefore, very fast CEST MR imaging methods are critical for rapidly measuring the exogenous CEST agent within in vivo tissue at static or negligibly varying concentration, so that the CEST properties of the agent can be accurately quantified. With regard to analysis, spectral features in the CEST spectrum of an exogenous agent can more easily be fit with Lorentzian line shapes when the MR frequency of the CEST agent does not overlap with other CEST signals or the direct saturation of water [46,50]. Avoiding CEST signal overlap also allows higher saturation powers to be used during the CEST study, which also more rapidly saturates the exogenous agent. Rapid saturation relative to T2 relaxation time subsequently improves Lorentzian line shape fitting because CEST spectral features are approximately Lorentzian in shape based on the assumption that saturation has reached steady state [46,51].
Most importantly, CEST MRI is a relatively insensitive molecular imaging technique, requiring a minimum ~10 mM agent concentration within the in vivo tissue for adequate detection. The minimum concentration threshold for detecting an exogenous agent may be higher than for endogenous biomolecules, because the need for fast imaging methods often precludes signal averaging that can improve SNR. Furthermore, calculating the difference between images acquired before and after injection combines noise from both images, inherently decreasing CNR by √2. This level of CEST sensitivity has limited the detection of exogenous CEST agents to the kidney and well-vascularized solid tumors. CEST agents have been administered to patients in high amounts of 0.5 to 4.4 mmol/kg to provide adequate CEST MRI signals for in vivo detection [111,112]. For comparison, clinically approved Gd(III)-based T1 MRI contrast agents have better detection sensitivity than CEST agents, and are administered to patients at lower 0.1 mmol/kg.
9A. GlucoCEST MRI of cancer
D-glucose generates a broad CEST effect between 0.8 and 2.2 ppm from the five hydroxyl groups of this sugar (a range of 1–5 ppm and a single frequency of 1.2 ppm have also been used to detect CEST from glucose, at magnetic field strengths of 3 T to 11.7 T) [111,113–115]. Dynamic glucoCEST MRI can be used to temporally track the CEST signal to monitor exogenous glucose uptake and wash-out in tissues by intravenously administering an injection of 0.5–1.7 mmol/kg of glucose in patients, followed by the acquisition of a series of dynamically acquired CEST MR images acquired with 1.6–2 μT saturation power (Fig. 11). The proximity of the MR frequencies of the CEST signal of glucose and water, especially at 3 T magnetic field strength, requires careful analysis of B0 inhomogeneity to improve MTRasym measurements with glucoCEST MRI.
Figure 11.
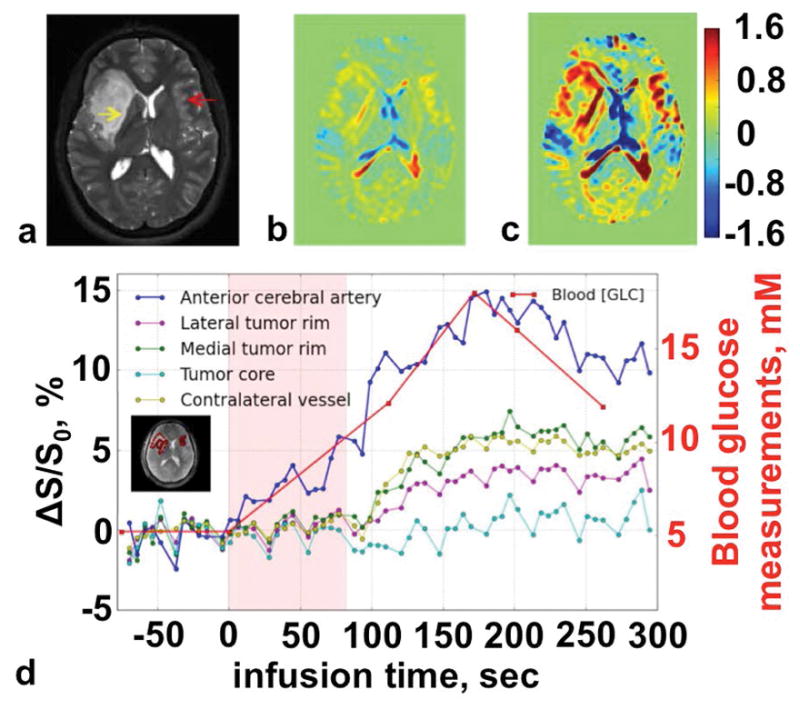
GlucoCEST MRI of cancer. a: An anatomical T2-weighted MR image showed the location of the tumor (yellow arrow). b: The increase in CEST signal after saturation was applied at 1.96 μT power for 2.4 s at 1.2 ppm between 0 and 110 seconds after starting the infusion, and c: between 110 and 295 seconds after starting the infusion, showed the glucose accumulation in the tumor rim. d: The dynamic changes in MTRasym signal showed the rate of glucose uptake in various tumor regions. Adapted with permission from reference 115.
Clinical glucoCEST MRI has shown strong enhancement in glioma vs. normal brain tissue, which was comparable to dynamic contrast enhancement (DCE) MRI studies with a gadolinium-based contrast agent [111]. GlucoCEST MRI also demonstrated increased signal in head and neck tumors and a general (but not exact) correlation with 18F-fluorodeoxyglucose (18FDG) uptake by positron emission tomography (PET) [115]. This study of head and neck cancer demonstrated the need to reduce or compensate for patient motion (i.e., from swallowing motion) to obtain adequate CEST MRI data sets before and after injection of the exogenous agent.
In practice, glucoCEST MRI contrast likely arises from a mixture of the extracellular and intracellular hydroxyl groups of glucose and its metabolic products, so that glucoCEST MRI reports on a combination of tumor metabolism and perfusion [113]. Initial glucoCEST MRI studies were assumed to track cell-internalized glucose in tumors, because 18FDG is rapidly transported into cells within glucose-avid tumor tissues [114]. However, a high ~15 mM concentration of blood glucose level has been used to generate glucoCEST MRI detection in tumors [115], while the 100 nmol/kg injection of 18FDG for PET detection in tumors is negligible relative to the standard blood glucose level of 4–8 mM. Only a small fraction of glucose is expected to be intracellular during the CEST MRI saturation pulse period, and the intracellular glucose is rapidly metabolized. Therefore, the majority of glucoCEST MRI signal may arise from extracellular glucose in tumor tissue, which effectively acts as a non-specific tracer agent that reports on the higher vascular perfusion of tumors, similar to other small molecule MRI contrast agents that are approved for clinical use. The general yet inexact correlation between glucoCEST MRI and 18FDG PET supports this interpretation.
Other sugars have been tested as exogenous CEST MRI contrast agents that may mitigate the disappearance of in vivo glucoCEST MRI signals 30 minutes after administration. Nonradioactive 19FDG and 2-deoxyglucose generate dynamic CEST signals at 0.5–2 ppm that can be detected in tumor tissues for more than 30 minutes after administration, presumably because these sugars accumulate in cells and are not metabolized during the MRI scan session [116]. However, these derivatives of glucose are potentially toxic at high concentrations, and are therefore limited to studies of small animal models of human cancers. More recently, 3-O-methyl-glucose, glucosamine and N-acetyl glucosamine have shown similar dynamic CEST MRI detection for longer than 30 minutes, and have shown good in vivo tolerability during small animal studies, providing promise for clinical translation as a more durable exogenous CEST agent for tumor imaging [117,118]. Furthermore, these new agents have been administered orally during small animal studies, providing hope that patients can simply drink a solution of sugar prior to a CEST MRI scan, which could increase patient acceptance and comfort.
9B. CT agents that measure tumor pH with CEST MRI
Exogenous agents for computed tomography (CT) are approved to be clinically administered intravenously at high 972 mM concentrations and volumes as large as 200 mL [119]. These small molecule agents are hydrophilic and remain in the extracellular environment, which avoids potential intracellular toxicities. The chemical structures of these CT agents often have an amide group that is adjacent to an aromatic ring (known as an aryl amide), which causes the amide proton to have a unique MR frequency that does not overlap with endogenous biomolecules. The unique MR frequency greatly facilitates selective detection of the CT agent during in vivo CEST MRI studies. Some CT agents carry two unique aryl amides, and can produce CEST signals at two unique MR frequencies of 4.2 and 5.6 ppm [120]. The chemical exchange rate of an amide proton is base-catalyzed, and the CEST signal amplitude of each aryl amide has a different dependency on pH, so that the ratio of these two CEST signals from a CT agent can be used to measure pH [121,122]. Iopromide (Ultravist™) has shown the best precision for measuring pH, although iopamidol (Isovue™) is generally preferred due to its superior detection sensitivity [123]. A ratio of the CEST signals from a single agent is inherently independent of concentration, and a CEST signal ratio has also been shown to be independent of the endogenous T1 relaxation time and B1 inhomogeneity, and largely independent of fluctuations in the physiological temperature range, which improves the accuracy of pH measurements [124].
Iopamidol has been employed to measure extracellular pH and assess tumor acidosis, and thus this method has been termed acidoCEST MRI [125]. Studies with small animal models of solid tumors have shown that acidoCEST MRI results are correlated with tumor growth rate, upregulation of biomarkers associated with aerobic glycolysis and acid transport, and decreased metabolism in rapid response to treatment [126]. More recently, acidoCEST MRI has been translated to the clinic at 3 T magnetic field strength and low 1.5 μT saturation power, and has successfully measured the extracellular pH in kidney and metastatic ovarian tumors (Fig. 12) [112,127]. Despite this success, these studies have also shown that tumors must have high vascularity to generate high uptake of the agent for adequate CEST MRI detection. Further clinical studies are needed to evaluate pre-test measurements of vascularity, or to determine the types of solid tumors that may be reliably interrogated with acidoCEST MRI.
Figure 12.
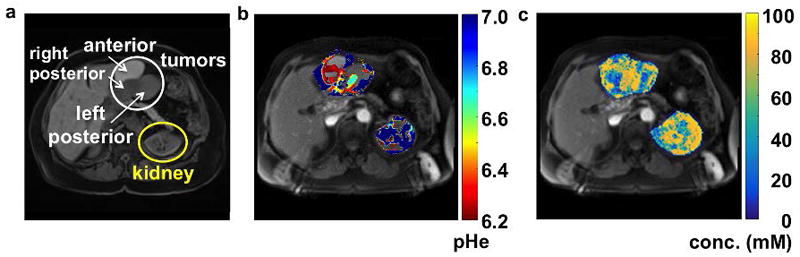
AcidoCEST MRI of cancer. a: An anatomical image of a 69-year-old patient with a high-grade serous carcinoma showed the location of three tumors that were metastases from a prior ovarian tumor. b: The parametric map of extracellular pH showed regions of the tumors that were acidic. c: The parametric map of agent concentration showed a range from 56 to 84 mM in the tumors and 69 to 80 mM in the kidney. AcidoCEST MR images were acquired with saturation applied between 3.0 and 6.9 ppm with 1.5 μT power for 2 s, using a 3 T MRI scanner. 120 mL of 976 mM iopamidol (Isovue™) was administered to the patient. Images were analyzed with the Bloch-McConnell equations. Adapted with permission from reference 112.
For comparison, paramagnetic CEST (paraCEST) agents have not yet been translated to the radiology clinic due to this same requirement of high agent uptake for adequate CEST MRI detection. Most of these paraCEST agents incorporate lanthanide ions that are potentially toxic [128], limiting intravenous administration to concentrations below their CEST detection limit within in vivo tissues [129]. Some paraCEST agents incorporate nontoxic metals, but their oxidation state for CEST MRI are relatively unstable which may compromise their practical utility [130]. Yet many of the 42 paraCEST agents that have been reported have shown good utility for molecular imaging studies of small animal models [131,132].
9C. Future diamagnetic CEST agents
Building on the success of aryl amide-based CT agents, a new class of CEST agents has been developed that incorporate a carboxylic acid and hydroxyl group on an aromatic ring, known as an aryl acid [133,134]. An intramolecular hydrogen bond that involves the proton of the hydroxyl group causes this proton to have a very high MR frequency of 8.5–12 ppm and an unusually slow chemical exchange rate of 220–7100 Hz that are appropriate for generating detectable CEST. Anthranylic acids [135] and imidazoles [136] have also shown similar 300–2000 Hz chemical exchange rates and high 4.0–9.3 ppm MR frequencies that can generate unique CEST signals. Similar to aryl amide CT agents, these agents can have CEST signals that are pH-dependent, and thus can be designed to measure extracellular pH [136]. Derivatives of these agents can undergo enzyme-catalyzed modification of a ligand, so that the comparison of enzyme-responsive and unresponsive CEST signals of the agent can then robustly detect enzyme catalysis, which is known as catalyCEST MRI [137,138]. Some drugs have been shown to generate similar CEST effects, providing potential to directly detect drug delivery with theranostic CEST MRI [139]. Although the toxicity of these agents must be thoroughly evaluated to gain approval for clinical use [140], high concentrations of these agents have been administered to small animal models of human cancers without acute effects [141], hinting that these agents may be safe. These new diamagnetic CEST agents show the versatility offered by CEST MRI for molecular imaging.
10. Conclusions
CEST MRI provides new opportunities for clinical molecular imaging. Basic protocols that use a selective saturation pulse followed by a rapid acquisition method are now established in clinical radiology centers, which can provide semi-quantitative MTRasym measurements of CEST contrast. Faster MRI acquisition methods and advanced analytic methods continue to be developed to improve this imaging technique. Useful CEST MRI contrast for clinical imaging can be generated from amide, amine, and hydroxyl protons of mobile proteins and peptides, GAG, and glutamate, and from changes in creatine and lactate concentrations. Glucose and iopamidol are exogenous CEST agents that have been administered to patients, and additional diamagnetic CEST agents are under development for clinical translation. Initial clinical CEST MRI studies have shown promising practical utility for evaluating cerebrovascular stroke, cancer, osteoarthritis, muscle physiology, lymphedema, multiple sclerosis and other neurological disorders.
Acknowledgments
The authors thank Drs. Phillip Kuo, Julio Cárdenas-Rodríguez, and Edward Randtke of the Department of Medical Imaging at the University of Arizona for helpful discussions. The authors were supported by NIH grants R01CA167183, R01CA169774, R01CA197029, P50 CA95060, T32HL007955 and T32HL066988.
References
- 1.Ward KM, Aletras AH, Balaban RS. A new class of contrast agents for MRI based on proton chemical exchange dependent saturation transfer (CEST) J Magn Reson. 2000;143:79–87. doi: 10.1006/jmre.1999.1956. [DOI] [PubMed] [Google Scholar]
- 2.van Zijl PCM, Yadav NN. Chemical Exchange Saturation Transfer (CEST): what is in a name and what isn’t? Magn Reson Med. 2011;65:927–948. doi: 10.1002/mrm.22761. [DOI] [PMC free article] [PubMed] [Google Scholar]
- 3.Wada T, Togao O, Tokunaga C, Funatsu R, Kobayashi K, Nakamura Y. Effect of the saturation pulse duration on chemical exchange saturation transfer in amide proton transfer MR imaging: a phantom study. Radiol Phys Technol. 2016;9:15–21. doi: 10.1007/s12194-015-0326-1. [DOI] [PubMed] [Google Scholar]
- 4.Zhou J, Wilson DA, Sun PZ, Klaus JA, van Zijl PCM. Quantitative description of proton exchange processes between water and endogenous and exogenous agents for WEX, CEST, and APT experiments. Magn Reson Med. 2004;51:945–952. doi: 10.1002/mrm.20048. [DOI] [PubMed] [Google Scholar]
- 5.Bryant RG. The dynamics of water-protein interactions. Annu Rev Biophys Biomol Struct. 1996;25:29–53. doi: 10.1146/annurev.bb.25.060196.000333. [DOI] [PubMed] [Google Scholar]
- 6.Morrison C, Stanisz G, Henkelman RM. Modeling magnetization transfer for biological-like systems using a semi-solid pool with a super-Lorentzian line shape and dipolar reservoir. J Magn Reson Series B. 1995;108:103–113. doi: 10.1006/jmrb.1995.1111. [DOI] [PubMed] [Google Scholar]
- 7.Li AX, Hudson RHE, Barrett JW, Jones CK, Pasternak SH, Bartha R. Four-pool modeling of proton exchange processes in biological systems in the presence of MRI–paramagnetic chemical exchange saturation transfer (PARACEST) agents. Magn Reson Med. 2008;60:1197–1206. doi: 10.1002/mrm.21752. [DOI] [PubMed] [Google Scholar]
- 8.Zaiss M, Windschuh J, Paech D, et al. Relaxation-compensated CEST MRI of the human brain at 7 T: Unbiased insight into NOE and amide signal changes in human glioblastoma. Neuroimage. 2015;112:180–188. doi: 10.1016/j.neuroimage.2015.02.040. [DOI] [PubMed] [Google Scholar]
- 9.Scheidegger R, Wong ET, Alsop DC. Contributors to contrast between glioma and brain tissue in chemical exchange saturation transfer sensitive imaging at 3 Tesla. Neuroimage. 2014;99:256–68. doi: 10.1016/j.neuroimage.2014.05.036. [DOI] [PMC free article] [PubMed] [Google Scholar]
- 10.Pekar J, Jezzard P, Roberts DA, Leigh JS, Frank JA, McLaughlin AC. Perfusion imaging with compensation for asymmetric magnetization transfer effects. Magn Reson Med. 1996;35:70–79. doi: 10.1002/mrm.1910350110. [DOI] [PubMed] [Google Scholar]
- 11.Hua J, Jones CK, Blakeley J, Smith SA, van Zijl PCM, Zhou J. Quantitative description of the asymmetry in magnetization transfer effects around the water resonance in the human brain. Magn Reson Med. 2007;58:786–793. doi: 10.1002/mrm.21387. [DOI] [PMC free article] [PubMed] [Google Scholar]
- 12.Xiao G, Sun PZ, Wu R. Fast simulation and optimization of pulse-train chemical exchange saturation transfer (CEST) imaging. Physics Med Biol. 2015;60:4719–4730. doi: 10.1088/0031-9155/60/12/4719. [DOI] [PMC free article] [PubMed] [Google Scholar]
- 13.Sun PZ, Wang E, Cheung JS, Zhang X, Benner T, Sorensen AG. Simulation and optimization of pulsed radio frequency irradiation scheme for chemical exchange saturation transfer (CEST) MRI-demonstration of pH-weighted pulsed-amide proton CEST MRI in an animal model of acute cerebral ischemia. Magn Reson Med. 2011;66:1042–1048. doi: 10.1002/mrm.22894. [DOI] [PMC free article] [PubMed] [Google Scholar]
- 14.Schreiner MM, Zbyn S, Schmitt B, et al. Reproducibility and regional variations of an improved gagCEST protocol for the in vivo evaluation of knee cartilage at 7 T. Magn Reson Mat Physics Biol Med. 2016;29:513–521. doi: 10.1007/s10334-016-0544-5. [DOI] [PubMed] [Google Scholar]
- 15.Yoshimaru ES, Randtke EA, Pagel MD, Cárdenas-Rodríguez J. Design and optimization of pulsed chemical exchange saturation transfer MRI using a multiobjective genetic algorithm. J Magn Reson. 2016;263:184–192. doi: 10.1016/j.jmr.2015.11.006. [DOI] [PMC free article] [PubMed] [Google Scholar]
- 16.Liu G, Ali MM, Yoo B, Griswold MA, Tkach JA, Pagel MD. PARACEST MRI with improved temporal resolution. Magn Reson Med. 2009;61:399–408. doi: 10.1002/mrm.21863. [DOI] [PMC free article] [PubMed] [Google Scholar]
- 17.Sun PZ, Cheung JS, Wang E, Benner T, Sorensen AG. Fast multislice pH-weighted chemical exchange saturation transfer (CEST) MRI with unevenly segmented RF irradiation. Magn Reson Med. 2011;65:588–594. doi: 10.1002/mrm.22628. [DOI] [PMC free article] [PubMed] [Google Scholar]
- 18.Singh A, Cai K, Haris M, Hariharan H, Reddy R. On B1 inhomogeneoty correction of in vivo human brain glutamate chemical exchange saturation transfer contrast at 7T. Magn Reson Imaging. 2013;69:818–824. doi: 10.1002/mrm.24290. [DOI] [PMC free article] [PubMed] [Google Scholar]
- 19.Tee YK, Donahue MJ, Harston GW, Payne SJ, Chappell MA. Quantification of amide proton transfer effect pre-and post-gadolinium contrast agent administration. J Magn Reson Imaging. 2014;40:832–8. doi: 10.1002/jmri.24441. [DOI] [PMC free article] [PubMed] [Google Scholar]
- 20.Dai Z, Ji J, Xiao G, et al. Magnetization transfer prepared gradient echo MRI for CEST imaging. Plos One. 2014;9:e112219/1–e112219/7. doi: 10.1371/journal.pone.0112219. [DOI] [PMC free article] [PubMed] [Google Scholar]
- 21.Jiang W, Zhou IY, Wen L, Zhou X, Sun PZ. A theoretical analysis of chemical exchange saturation transfer echo planar imaging (CEST-EPI) steady state solution and the CEST sensitivity efficiency-based optimization approach. Contrast Media Mol Imaging. 2016;11:415–423. doi: 10.1002/cmmi.1699. [DOI] [PMC free article] [PubMed] [Google Scholar]
- 22.Deng M, Chen SZ, Yuan J, Chan Q, Zhou J, Wang YX. Chemical exchange saturation transfer (CEST) MR technique for liver imaging at 3. 0 Tesla: an evaluation of different offset number and an after-meal and over-night-fast comparison. Molec Imaging Biol. 2016;18:274–282. doi: 10.1007/s11307-015-0887-8. [DOI] [PMC free article] [PubMed] [Google Scholar]
- 23.Schmitt B, Zamecnik P, Zaiss M, et al. A new contrast in MR mammography by means of chemical exchange saturation transfer (CEST) imaging at 3 Tesla: preliminary results. RoFo. 2011;183:1030–1036. doi: 10.1055/s-0031-1281764. [DOI] [PubMed] [Google Scholar]
- 24.Kim J, Johnson CP, Wang D, Sun PZ. Accelerated CEST MRI using parallel imaging acquisition of golden-angle radial ordering scheme and compressed sensing reconstruction. Proc ISMRM. 2015:3621. [Google Scholar]
- 25.Wu B, Li R, Lin CH, Lin M, Zhou Z. Rapid 3D spiral CEST. Proc ISMRM. 2016:1517. [Google Scholar]
- 26.Varma G, Lenkinski RE, Vingradov E. Keyhole chemical exchange saturation transfer. Magn Reson Med. 2012;68(4):1228–1233. doi: 10.1002/mrm.23310. [DOI] [PMC free article] [PubMed] [Google Scholar]
- 27.Heo HY, Zhang Y, Lee DH, Jiang S, Zhao X, Zhou J. Accelerating chemical exchange saturation transfer (CEST) MRI by combining compressed sensing and sensitivity encoding techniques. Magn Reson Med. 2016;77:779–788. doi: 10.1002/mrm.26141. [DOI] [PMC free article] [PubMed] [Google Scholar]
- 28.Geades N, Gowland P, Mougin O. CEST analysis via MR fingerprinting. Proc ISMRM. 2015:780. [Google Scholar]
- 29.Xu X, Lee JS, Jerschow A. Ultrafast scanning of exchangeable sites by NMR spectroscopy. Angew Chem Int Ed. 2013;52:8281–8284. doi: 10.1002/anie.201303255. [DOI] [PMC free article] [PubMed] [Google Scholar]
- 30.Liu Z, Dimitrov IE, Lenkinski RE, Hajibeigi A, Vinogradov E. UCEPR: Ultrafast localized CEST-spectroscopy with PRESS in phantoms and in vivo. Magn Reson Med. 2016;75:1875–1885. doi: 10.1002/mrm.25780. [DOI] [PMC free article] [PubMed] [Google Scholar]
- 31.Vinogradov E, Zhang S, Lubag A, Balschi JA, Sherry AD, Lenkinski RE. On resonance low B1 pulses for imaging of the effects of PARACEST agents. J Magn Reson. 2005;176:54–63. doi: 10.1016/j.jmr.2005.05.016. [DOI] [PubMed] [Google Scholar]
- 32.Randtke EA, Pagel MD, Cárdenas-Rodríguez J. QUESPOWR MRI: Quantification of Exchange as a function of Saturation Power On the Water Resonance. J Magn Reson. 2016;270:56–70. doi: 10.1016/j.jmr.2016.06.022. [DOI] [PMC free article] [PubMed] [Google Scholar]
- 33.Xu J, Chan KWY, Xu X, Yadav N, Liu G, van Zijl PCM. On-resonance variable delay multipulse scheme for imaging of fast-exchanging protons and semisolid macromolecules. Magn Reson Med. 2017;77:730–739. doi: 10.1002/mrm.26165. [DOI] [PMC free article] [PubMed] [Google Scholar]
- 34.Scheidegger R, Vinogradov E, Alsop DC. Amide proton transfer imaging with improved robustness to magnetic field inhomogeneity and magnetization transfer asymmetry using saturation with frequency alternating RF irradiation. Magn Reson Med. 2011;66:1275–1285. doi: 10.1002/mrm.22912. [DOI] [PMC free article] [PubMed] [Google Scholar]
- 35.Jiadi X, Yadav NN, Bar-Shir A, et al. Variable delay multi-pulse train for fast chemical exchange saturation transfer and relayed-nuclear overhauser enhancement MRI. Magn Reson Med. 2014;71:1798–1812. doi: 10.1002/mrm.24850. [DOI] [PMC free article] [PubMed] [Google Scholar]
- 36.Xian X, Yadav NN, Zeng H, et al. Magnetization Transfer contrast suppressed amide proton transfer and relayed nuclear overhauser enhancement chemical exchange saturation transfer of the human brain at 7 T. Magn Reson Med. 2016;75:88–96. doi: 10.1002/mrm.25990. [DOI] [PMC free article] [PubMed] [Google Scholar]
- 37.Yadav NN, Jones CA, Hua J, Xu J, van Zijl PCM. Imaging of endogenous exchangeable proton signals in the human brain using frequency labeled exchange transfer imaging. Magn Reson Med. 2013;69:966–973. doi: 10.1002/mrm.24655. [DOI] [PMC free article] [PubMed] [Google Scholar]
- 38.Jin T, Autio J, Obata T, Kim SG. Spin-locking vs. chemical exchange saturation transfer MRI for investigating chemical exchange process between water and labile metabolite protons. Magn Reson Med. 2011;65:1448–1460. doi: 10.1002/mrm.22721. [DOI] [PMC free article] [PubMed] [Google Scholar]
- 39.Zu Z, Janve VA, Xu J, Does MD, Gore JC, Gochberg DF. A new method for detecting exchanging amide protons using chemical exchange rotation transfer. Magn Reson Med. 2013;69:637–647. doi: 10.1002/mrm.24284. [DOI] [PMC free article] [PubMed] [Google Scholar]
- 40.Sun PZ, van Zijl PC, Zhou J. Optimization of the irradiation power in chemical exchange dependent saturation transfer experiments. J Magn Reson. 2005;175:193–200. doi: 10.1016/j.jmr.2005.04.005. [DOI] [PubMed] [Google Scholar]
- 41.Kim M, Gillen J, Landman BA, Zhou J, van Zijl PCM. Water saturation shift referencing (WASSR) for chemical exchange saturation transfer (CEST) experiments. Magn Reson Med. 2009;61:1441–50. doi: 10.1002/mrm.21873. [DOI] [PMC free article] [PubMed] [Google Scholar]
- 42.Sun PZ, Farrar CT, Sorensen AG. Correction for artifacts induced by B(0) and B(1) field inhomogeneities in pH-sensitive chemical exchange saturation transfer (CEST) imaging. Magn Reson Med. 2007;58:1207–1215. doi: 10.1002/mrm.21398. [DOI] [PubMed] [Google Scholar]
- 43.Yang S, Wu Y. Investigation of the performance of variable-density Z-spectrum acquisition scheme in MR chemical exchange saturation transfer effect quantification. Conf Proc IEEE Eng Med Biol Soc. 2015;2015:7929–32. doi: 10.1109/EMBC.2015.7320231. [DOI] [PubMed] [Google Scholar]
- 44.Kim J, Wu Y, Guo Y, Zheng H, Sun PZ. A review of optimization and quantification techniques for chemical exchange saturation transfer MRI toward sensitive in vivo imaging. Contrast Media Mol Imaging. 2015;10:163–178. doi: 10.1002/cmmi.1628. [DOI] [PMC free article] [PubMed] [Google Scholar]
- 45.Zaiss M, Xu J, Goerke S, et al. Inverse Z-spectrum analysis for spillover-, MT-, and T1-corrected steady-state pulsed CEST MRI – application to pH-weighted MRI of acute stroke. NMR Biomed. 2014;27:240–252. doi: 10.1002/nbm.3054. [DOI] [PMC free article] [PubMed] [Google Scholar]
- 46.Woessner DE, Zhang S, Merritt ME, Sherry AD. Numerical solution of the Bloch equations provides insights into the optimum design of PARACEST agents for MRI. Magn Reson Med. 2005;53:790–799. doi: 10.1002/mrm.20408. [DOI] [PubMed] [Google Scholar]
- 47.Tee YK, Harston GW, Blockley N, et al. Comparing different analysis methods for quantifying the MRI amide proton transfer (APT) effect in hyperacute stroke patients. NMR Biomed. 2014;9:1019–1029. doi: 10.1002/nbm.3147. [DOI] [PMC free article] [PubMed] [Google Scholar]
- 48.Murase K, Tanki N. Numerical solutions to the time-dependent Bloch equations revisited. Magn Reson Imaging. 2011;1:126–131. doi: 10.1016/j.mri.2010.07.003. [DOI] [PubMed] [Google Scholar]
- 49.Zaiss M, Zu Z, Xu J, et al. A combined analytical solution for chemical exchange saturation transfer and semi-solid magnetization transfer. NMR Biomed. 2015;28:217–230. doi: 10.1002/nbm.3237. [DOI] [PMC free article] [PubMed] [Google Scholar]
- 50.Hingorani DV, Randtke EA, Pagel MD. A catalyCEST MRI contrast agent that detects the enzyme- catalyzed creation of a covalent bond. J Am Chem Soc. 2013;135:6396–6398. doi: 10.1021/ja400254e. [DOI] [PMC free article] [PubMed] [Google Scholar]
- 51.Mulkern RV, Williams ML. The general solution to the Bloch equations with constant rf and relaxation terms: application to saturation and slide selection. Med Phys. 1993;20:5–13. doi: 10.1118/1.597063. [DOI] [PubMed] [Google Scholar]
- 52.Jones CK, Huang A, Xu J, et al. Nuclear Overhauser (NOE) imaging in the human brain at 7T. Neuroimage. 2013;77:114–124. doi: 10.1016/j.neuroimage.2013.03.047. [DOI] [PMC free article] [PubMed] [Google Scholar]
- 53.Heo HY, Jones CK, Hua J, et al. Whole-brain amide proton transfer (APT) and nuclear overhauser enhancement (NOE) imaging in glioma patients using low-power steady-state pulsed chemical exchange saturation transfer (CEST) imaging at 7T. J Magn Reson Imaging. 2016;44:41–50. doi: 10.1002/jmri.25108. [DOI] [PMC free article] [PubMed] [Google Scholar]
- 54.Zhou J, Payen JF, Wilson DA, Traystman RJ, van Zijl PC. Using the amide proton signals of intracellular proteins and peptides to detect pH effects in MRI. Nat Med. 2003;9:1085–1090. doi: 10.1038/nm907. [DOI] [PubMed] [Google Scholar]
- 55.Yan K, Fu Z, Yang C, et al. Assessing amide proton transfer (APT) MRI contrast origins in 9 L gliosarcoma in the rat brain using proteomic analysis. Molec Imaging Biol. 2015;17:479–487. doi: 10.1007/s11307-015-0828-6. [DOI] [PMC free article] [PubMed] [Google Scholar]
- 56.Sun PZ, Cheung JS, Wang E, Lo EH. Association between pH-weighted endogenous amide proton chemical exchange saturation transfer MRI and tissue lactic acidosis during acute ischemic stroke. J Cereb Blood Flow Metab. 2011;31:1743–1750. doi: 10.1038/jcbfm.2011.23. [DOI] [PMC free article] [PubMed] [Google Scholar]
- 57.Harston GW, Tee YK, Blockley N, et al. Identifying the ischaemic penumbra using pH-weighted magnetic resonance imaging. Brain. 2015;138:36–42. doi: 10.1093/brain/awu374. [DOI] [PMC free article] [PubMed] [Google Scholar]
- 58.Tietze A, Blicher J, Mikkelsen IK, et al. Assessment of ischemic penumbra in patients with hyperacute stroke using amide proton transfer (APT) chemical exchange saturation transfer (CEST) MRI. NMR Biomed. 2014;27:163–174. doi: 10.1002/nbm.3048. [DOI] [PMC free article] [PubMed] [Google Scholar]
- 59.Wang M, Hong X, Chang CF, et al. Simultaneous detection and separation of hyperacute intracerebral hemorrhage and cerebral ischemia using amide proton transfer MRI. Magn Reson Med. 2015;74:42–50. doi: 10.1002/mrm.25690. [DOI] [PMC free article] [PubMed] [Google Scholar]
- 60.Dula AN, Asche EM, Landman BA, et al. Development of chemical exchange saturation transfer at 7T. Magn Reson Med. 2011;66:831–838. doi: 10.1002/mrm.22862. [DOI] [PMC free article] [PubMed] [Google Scholar]
- 61.Dula AN, Pawate S, Dethrage LM, et al. Chemical exchange saturation transfer of the cervical spinal cord at 7 T. NMR Biomed. 2016;29:1249–1257. doi: 10.1002/nbm.3581. [DOI] [PMC free article] [PubMed] [Google Scholar]
- 62.Wells JA, O’Callaghan JM, Holmes HE, et al. In vivo imaging of tau pathology using multi-parametric quantitative MRI. NeuroImage. 2015;111:369–378. doi: 10.1016/j.neuroimage.2015.02.023. [DOI] [PMC free article] [PubMed] [Google Scholar]
- 63.Donahue MJ, Donahue PCM, Rane S, et al. Assessment of lymphatic impairment and interstitial protein accumulation in patients with breast cancer treatment-related lymphedema using CEST MRI. Magn Reson Med. 2016;75:345–355. doi: 10.1002/mrm.25649. [DOI] [PMC free article] [PubMed] [Google Scholar]
- 64.Zhou J, Yan K, Zhu H. A simple model for understanding the origin of the amide proton transfer MRI signal in tissue. Applied Magn Reson. 2012;42:393–402. doi: 10.1007/s00723-011-0306-5. [DOI] [PMC free article] [PubMed] [Google Scholar]
- 65.Goerke S, Milde KS, Bukowiecki R, et al. Aggregation-induced changes in the chemical exchange saturation transfer (CEST) signals of proteins. NMR Biomed. 2016 doi: 10.1002/nbm.3665. [Epub ahead of print] [DOI] [PubMed] [Google Scholar]
- 66.Warburg O. On the origin of cancer cells. Science. 1956;123:309–314. doi: 10.1126/science.123.3191.309. [DOI] [PubMed] [Google Scholar]
- 67.Windschuh J, Zaiss M, Meissner JE, et al. Correction of B1 inhomogeneities relaxation-compensated CEST imaging. NMR Biomed. 2015;28:529–537. doi: 10.1002/nbm.3283. [DOI] [PubMed] [Google Scholar]
- 68.Zaiss M, Windschuh J, Goerke S, et al. Downfield-NOE-suppressed amide-CEST MRI at 7 Tesla provides a unique contrast in human glioblastoma. Magn Reson Med. 2017;77:196–208. doi: 10.1002/mrm.26100. [DOI] [PubMed] [Google Scholar]
- 69.Wen Z, Hu S, Huang F, et al. MR imaging of high-grade brain tumors using endogenous protein and peptide-based contrast. NeuroImage. 2010;51:616–622. doi: 10.1016/j.neuroimage.2010.02.050. [DOI] [PMC free article] [PubMed] [Google Scholar]
- 70.Zhao X, Wen Z, Huang F, et al. Saturation power dependence of amide proton transfer image contrasts in human brain tumors and strokes at 3 T. Magn Reson Med. 2011;66:1033–1041. doi: 10.1002/mrm.22891. [DOI] [PMC free article] [PubMed] [Google Scholar]
- 71.Jones CK, Schlosser MJ, van Zijl PC, Pomper MG, Golay X, Zhou J. Amide proton transfer imaging of human brain tumors at 3T. Magn Reson Med. 2006;56:585–592. doi: 10.1002/mrm.20989. [DOI] [PubMed] [Google Scholar]
- 72.Zhou J, Blakeley JO, Hua J, et al. Practical data acquisition method for human brain tumor amide proton transfer (APT) imaging. Magn Reson Med. 2008;60:842–849. doi: 10.1002/mrm.21712. [DOI] [PMC free article] [PubMed] [Google Scholar]
- 73.Zhou J, Zhu H, Lim M, et al. Three-dimensional amide proton transfer MR imaging of gliomas: initial experience and comparison with gadolinium enhancement. J Magn Reson Imaging. 2013;38:1119–1128. doi: 10.1002/jmri.24067. [DOI] [PMC free article] [PubMed] [Google Scholar]
- 74.Togao O, Yoshiura T, Keupp J, et al. Amide proton transfer imaging of adult diffuse gliomas: correlation with histopathological grades. Neuro Oncol. 2014;16:441–448. doi: 10.1093/neuonc/not158. [DOI] [PMC free article] [PubMed] [Google Scholar]
- 75.Blakeley JO, Ye X, Lim M, et al. The role of amide proton transfer imaging in detecting active malignant glioma. J Clin Oncol. 2011;29:2024. [Google Scholar]
- 76.Zhou J, Tryggestad E, Wen Z, et al. Differentiation between glioma and radiation necrosis using molecular magnetic resonance imaging of endogenous proteins and peptides. Nature Med. 2011;17:130–134. doi: 10.1038/nm.2268. [DOI] [PMC free article] [PubMed] [Google Scholar]
- 77.Park KJ, Kim HS, Park JE, et al. Added value of amide proton transfer imaging to conventional and perfusion MR imaging for evaluating the treatment response of newly diagnosed glioblastoma. Euro Radiol. 2016;26:4390–4403. doi: 10.1007/s00330-016-4261-2. [DOI] [PubMed] [Google Scholar]
- 78.Ma B, Blakeley JO, Hong X, et al. Applying amide proton transfer-weighted MRI to distinguish pseudoprogression from true progression in malignant gliomas. J Magn Reson Imaging. 2016;44:456–462. doi: 10.1002/jmri.25159. [DOI] [PMC free article] [PubMed] [Google Scholar]
- 79.Gerigk L, Schmitt B, Stieltjes B, et al. 7 Tesla imaging of cerebral radiation necrosis after arteriovenous malformations treatment using amide proton transfer (APT) imaging. J Magn Reson Imaging. 2012;35:1207–1209. doi: 10.1002/jmri.23534. [DOI] [PubMed] [Google Scholar]
- 80.Wansapura JP, Holland SK, Dunn RS, Ball WS. NMR relaxation times in the human brain at 3.0 Tesla. J Magn Reson Imaging. 1999;9:531–8. doi: 10.1002/(sici)1522-2586(199904)9:4<531::aid-jmri4>3.0.co;2-l. [DOI] [PubMed] [Google Scholar]
- 81.Harris RJ, Cloughesy TF, Liau LM, et al. pH-weighted molecular imaging of gliomas using amine chemical exchange saturation transfer MRI. Neuro-Oncology. 2015;17:1514–1524. doi: 10.1093/neuonc/nov106. [DOI] [PMC free article] [PubMed] [Google Scholar]
- 82.McVicar N, Li AX, Goncalves DF, et al. Quantitative tissue pH measurement during cerebral ischemia using amine and amide concentration-independent detection (AACID) with MRI. J Cerebral Blood Flow Metab. 2014;34:690–698. doi: 10.1038/jcbfm.2014.12. [DOI] [PMC free article] [PubMed] [Google Scholar]
- 83.Marathe K, McVicar N, Li A, Bellyou M, Meakin S, Bartha R. Topiramate induces acute intracellular acidification in glioblastoma. J Neuro-Oncology. 2016;130:465–472. doi: 10.1007/s11060-016-2258-y. [DOI] [PubMed] [Google Scholar]
- 84.Harris RJ, Cloughesy TF, Liau LM, et al. Simulation, phantom validation, and clinical evaluation of fast pH-weighted molecular imaging using amine chemical exchange saturation transfer echo planar imaging (CEST-EPI) in glioma at 3 T. NMR Biomed. 2016;29:1563–1576. doi: 10.1002/nbm.3611. [DOI] [PubMed] [Google Scholar]
- 85.Ling W, Regatte RR, Navon G, Jerschow A. Assessment of glycosaminoglycan concentration in vivo by chemical exchange-dependent saturation transfer (gagCEST) Proc Natl Acad Sci USA. 2008;105:2266–2270. doi: 10.1073/pnas.0707666105. [DOI] [PMC free article] [PubMed] [Google Scholar]
- 86.Zhou J, van Zijl PCM. Chemical exchange saturation transfer imaging and spectroscopy. Prog NMR Spectrosc. 2006;48:109–136. [Google Scholar]
- 87.Hills BP, Cano C, Belton PS. Proton NMR relaxation studies of aqueous polysaccharide systems. Macromolecules. 1991;24:2944–2950. [Google Scholar]
- 88.Singh A, Haris M, Cai K, et al. Chemical exchange saturation transfer magnetic resonance imaging of human knee cartilage at 3 T and 7 T. Magn Reson Med. 2012;68:588–594. doi: 10.1002/mrm.23250. [DOI] [PMC free article] [PubMed] [Google Scholar]
- 89.Lee YH, Yang J, Jeong HK, Suh JS. Assessment of the patellofemoral cartilage: Correlation of knee pain score with magnetic resonance cartilage grading and magnetization transfer ratio asymmetry of glycosaminoglycan chemical exchange saturation transfer. Magn Reson Imaging. 2016;35:61–68. doi: 10.1016/j.mri.2016.08.014. [DOI] [PubMed] [Google Scholar]
- 90.Schmitt B, Zbyn S, Steizeneder D, et al. Cartilage quality assessment by using glycosaminoglycan chemical exchange saturation transfer and (23)Na MR imaging at 7T. Radiology. 2011;260:257–264. doi: 10.1148/radiol.11101841. [DOI] [PubMed] [Google Scholar]
- 91.Rehnitz C, Kupfer J, Streich NA, et al. Comparison of biochemical cartilage imaging techniques at 3 T MRI. Osteo Cart. 2014;22:1732–1742. doi: 10.1016/j.joca.2014.04.020. [DOI] [PubMed] [Google Scholar]
- 92.Schleich C, Muller-Lutz A, Zimmermann L, et al. Biochemical imaging of cervical intervertebral discs with glycosaminoglycan chemical exchange saturation transfer magnetic resonance imaging: feasibility and initial results. Skeletal Radiol. 2016;45:79–85. doi: 10.1007/s00256-015-2251-0. [DOI] [PubMed] [Google Scholar]
- 93.Kim M, Chan Q, Anthony MP, Cheung KMC, Samartzis D, Khong PL. Assessment of glycosaminoglycan distribution in human lumbar intervertebral discs using chemical exchange saturation transfer at 3 T: feasibility and initial experience. NMR Biomed. 2011;24:1137–1144. doi: 10.1002/nbm.1671. [DOI] [PubMed] [Google Scholar]
- 94.Schleich C, Muller-Lutz A, Eichner M, et al. Glycosaminoglycan Chemical exchange saturation transfer of lumbar intervertebral discs in healthy volunteers. Spine. 2016;41:146–152. doi: 10.1097/BRS.0000000000001144. [DOI] [PubMed] [Google Scholar]
- 95.Schleich C, Muller-Lutz A, Matuschke F, et al. Glycosaminoglycan chemical exchange saturation transfer of lumbar intervertebral discs in patients with spondyloarthritis. J Magn Reson Imaging. 2015;42:1057–1063. doi: 10.1002/jmri.24877. [DOI] [PubMed] [Google Scholar]
- 96.Schleich C, Muller-Lutz A, Blum K, et al. Facet tropism and facet joint orientation: risk factors for the development of early biochemical alterations of lumbar intervertebral discs. Osteo Cart. 2016;10:1761–1768. doi: 10.1016/j.joca.2016.05.004. [DOI] [PubMed] [Google Scholar]
- 97.Wada T, Togao O, Tokunaga C, et al. Glycosaminoglycan chemical exchange saturation transfer in human lumbar intervertebral discs: Effect of saturation pulse and relationship with low back pain. J Magn Reson Imaging. 2017;45:863–871. doi: 10.1002/jmri.25397. [DOI] [PubMed] [Google Scholar]
- 98.Mueller-Lutz A, Schleich C, Schmitt B, et al. Gender, BMI and T2 dependencies of glycosaminoglycan chemical exchange saturation transfer in intervertebral discs. Magn Reson Imaging. 2016;34:271–275. doi: 10.1016/j.mri.2015.10.024. [DOI] [PubMed] [Google Scholar]
- 99.Krishnamoorthy G, Nanga RP, Bagga P, Hariharan H, Reddy R. High quality three-dimensional gagCEST imaging of in vivo human knee cartilage at 7 tesla. Magn Reson Med. 2017;77:1866–1873. doi: 10.1002/mrm.26265. [DOI] [PMC free article] [PubMed] [Google Scholar]
- 100.Cai K, Haris M, Singh A, et al. Magnetic resonance imaging of glutamate. Nat Med. 2012;18:302–306. doi: 10.1038/nm.2615. [DOI] [PMC free article] [PubMed] [Google Scholar]
- 101.Cai K, Singh A, Roalf DR, et al. Mapping glutamate in subcortical brain structures using high-resolution GluCEST MRI. NMR Biomed. 2013;26:1278–1284. doi: 10.1002/nbm.2949. [DOI] [PMC free article] [PubMed] [Google Scholar]
- 102.Davis KA, Nanga RP, Das S, et al. Glutamate imaging (GluCEST) lateralizes epileptic foci in nonlesional temporal lobe epilepsy. Sci Transl Med. 2015;7:309ra161. doi: 10.1126/scitranslmed.aaa7095. [DOI] [PMC free article] [PubMed] [Google Scholar]
- 103.Kogan F, Sigh A, Debrosse C, et al. Imaging of glutamate in the spinal cord using GluCEST. NeuroImage. 2013;77:262–267. doi: 10.1016/j.neuroimage.2013.03.072. [DOI] [PMC free article] [PubMed] [Google Scholar]
- 104.Kogan F, Haris M, Singh A, et al. Method for high-resolution imaging of creatine in vivo using chemical exchange saturation transfer. Magn Reson Med. 2014;71:164–172. doi: 10.1002/mrm.24641. [DOI] [PMC free article] [PubMed] [Google Scholar]
- 105.Kogan F, Haris M, Debrosse C, et al. In vivo chemical exchange saturation transfer of creatine (CrCEST) in skeletal muscle at 3 T. J Magn Reson Imaging. 2014;40:596–602. doi: 10.1002/jmri.24412. [DOI] [PMC free article] [PubMed] [Google Scholar]
- 106.Rerich E, Zaiss M, Korzowski A, Ladd ME, Bachert P. Relaxation-compensated CEST-MRI at 7 T for mapping of creatine content and pH – preliminary application in human muscle tissue in vivo. NMR Biomed. 2015;28:1402–1412. doi: 10.1002/nbm.3367. [DOI] [PubMed] [Google Scholar]
- 107.DeBrosse C, Prakash R, Nanga R, et al. Lactate chemical exchange saturation transfer (LATEST) Imaging in vivo: A biomarker for LDH activity. Sci Reports. 2016;6:19517. doi: 10.1038/srep19517. [DOI] [PMC free article] [PubMed] [Google Scholar]
- 108.Kogan F, Stafford RB, Englund EK, et al. Perfusion has no effect on the in vivo CEST effect from Cr(CrCEST) in skeletal muscle. NMR Biomed. 2017 doi: 10.1002/nbm.3673. [Epub ahead of print] [DOI] [PMC free article] [PubMed] [Google Scholar]
- 109.Agdeppa ED, Spilker ME. A review of imaging agent development. AAPS J. 2009;11:286–299. doi: 10.1208/s12248-009-9104-5. [DOI] [PMC free article] [PubMed] [Google Scholar]
- 110.Barnes SL, Whisenant JG, Loveless ME, Yankeelov TE. Practical dynamic contrast enhanced MRI in small animal models of cancer: Data acquisition, data analysis, and interpretation. Pharmaceutics. 2012;4:442–478. doi: 10.3390/pharmaceutics4030442. [DOI] [PMC free article] [PubMed] [Google Scholar]
- 111.Wang J, Weygand J, Hwang K, et al. Magnetic resonance imaging of glucose uptake and metabolism in patients with head and neck cancer. Sci Reports. 2016;6:30618. doi: 10.1038/srep30618. [DOI] [PMC free article] [PubMed] [Google Scholar]
- 112.Jones KM, Randtke EA, Yoshimaru E, et al. Clinical translation of acidosis measurements with acidoCEST MRI. Molec Biol Imaging. 2016 doi: 10.1007/s11307-016-1029-7. [Epub ahead of print] [DOI] [PMC free article] [PubMed] [Google Scholar]
- 113.Chan KW, McMahon MT, Kato Y, et al. Natural D-glucose as a biodegradable MRI contrast agent for detecting cancer. Magn Reson Med. 2012;68:1764–1773. doi: 10.1002/mrm.24520. [DOI] [PMC free article] [PubMed] [Google Scholar]
- 114.Walker-Samuel S, Ramasawmy R, Torrealdea F, et al. In vivo imaging of glucose uptake and metabolism in tumors. Nat Med. 2013;19:1067–1072. doi: 10.1038/nm.3252. [DOI] [PMC free article] [PubMed] [Google Scholar]
- 115.Xu X, Yadav NN, Knutsson L, et al. Dynamic Glucose-Enhanced (DGE) MRI: Translation to human scanning and first results in glioma patients. Tomography. 2015;1:105–114. doi: 10.18383/j.tom.2015.00175. [DOI] [PMC free article] [PubMed] [Google Scholar]
- 116.Rivlin M, Horey J, Tsarfaty I, Navon G. Molecular imaging of tumors and metastases using chemical exchange saturation transfer (CEST) MRI. Sci Reports. 2013;3:3045. doi: 10.1038/srep03045. [DOI] [PMC free article] [PubMed] [Google Scholar]
- 117.Rivlin M, Tsarfaty I, Navon G. Functional molecular imaging of tumors by chemical exchange saturation transfer MRI of 3-O-methyl-D-glucose. Magn Reson Med. 2014;72:1375–1380. doi: 10.1002/mrm.25467. [DOI] [PubMed] [Google Scholar]
- 118.Riflin M, Navon G. Glucosamine and N-acetyl glucosamine as new CEST MRI agents for molecular imaging of tumors. Sci Reports. 2016;6:32648. doi: 10.1038/srep32648. [DOI] [PMC free article] [PubMed] [Google Scholar]
- 119.Valentini AL, Tartaglione T, Monti L, Marano P. Iomeprol versus iopamidol in contrast-enhanced computed tomography of thoracic and abdominal organs. Euro J Radiol. 1994;18(Suppl 1):S88–92. doi: 10.1016/0720-048x(94)90100-7. [DOI] [PubMed] [Google Scholar]
- 120.Longo D, Colombo S, Dastru W, et al. Evaluating iopamidol as pH-responsive CEST agent at 3 and 7 T. Contrast Media Mol Imaging. 2009;4:294–295. [Google Scholar]
- 121.Longo DL, Dastru W, Digilio G, et al. Iopamidol as a responsive MRI-chemical exchange saturation transfer contrast agent for pH mapping of kidneys: in vivo studies in mice at 7 T. Magn Reson Med. 2011;65:202–211. doi: 10.1002/mrm.22608. [DOI] [PubMed] [Google Scholar]
- 122.Chen LQ, Randtke EA, Jones KM, Moon BF, Howison CM, Pagel MD. Evaluations of tumor acidosis within in vivo tumor models using parametric maps generated with acidoCEST MRI. Mol Imaging Biol. 2015;17(4):488–496. doi: 10.1007/s11307-014-0816-2. [DOI] [PMC free article] [PubMed] [Google Scholar]
- 123.Moon BF, Jones KM, Chen LQ, et al. A comparison of iopromide and iopamidol, two acidoCEST MRI contrast media that measure tumor extracellular pH. Contrast Media Mol Imaging. 2015;10:446–455. doi: 10.1002/cmmi.1647. [DOI] [PMC free article] [PubMed] [Google Scholar]
- 124.Sheth VR, Liu G, Li Y, Pagel MD. Improved pH measurements with a single PARACEST MRI contrast agent. Contrast Media Mole Imaging. 2012;7:26–34. doi: 10.1002/cmmi.460. [DOI] [PMC free article] [PubMed] [Google Scholar]
- 125.Chen LQ, Howison CM, Jeffery JJ, Robey IF, Kuo PH, Pagel MD. Evaluations of extracellular pH within in vivo tumors using acidoCEST MRI. Magn Reson Med. 2014;72:1408–1417. doi: 10.1002/mrm.25053. [DOI] [PMC free article] [PubMed] [Google Scholar]
- 126.Akhenblit PJ, Hanke NT, Gill A, et al. Assessing metabolic changes in response to mTOR inhibition in a Mantle cell lymphoma xenograft model using acidoCEST MRI. Mol Imaging. 2016;15:1–10. doi: 10.1177/1536012116645439. [DOI] [PMC free article] [PubMed] [Google Scholar]
- 127.Muller-Lutz A, Khalil N, Schmitt B, et al. Pilot study of iopamidol-based quantitative pH imaging on a clinical 3 T MR scanner. Magn Reson Mater Phy. 2014;27:477–485. doi: 10.1007/s10334-014-0433-8. [DOI] [PubMed] [Google Scholar]
- 128.Kuo PH, Kanal E, Abu-Alfa AK, Cowper SE. Gadolinium-based MR contrast agents and nephrogenic systemic fibrosis. Radiology. 2007;243:647–649. doi: 10.1148/radiol.2423061640. [DOI] [PubMed] [Google Scholar]
- 129.Sheth VR, Li Y, Chen LQ, Howison CM, Flask CA, Pagel MD. Measuring in vivo tumor pHe with CEST-FISP MRI. Magn Reson Med. 2012;67:760–768. doi: 10.1002/mrm.23038. [DOI] [PMC free article] [PubMed] [Google Scholar]
- 130.Dorazio SJ, Olatunde AO, Tsitovich PB, Morrow JR. Comparison of divalent transition metal ion paraCEST MRI contrast agents. J Biol Inorg Chem. 2014;19:191–205. doi: 10.1007/s00775-013-1059-4. [DOI] [PMC free article] [PubMed] [Google Scholar]
- 131.Yoo B, Pagel MD. An overview of responsive MRI contrast agents for molecular imaging. Front Biosci. 2008;13:1733–1752. doi: 10.2741/2796. [DOI] [PubMed] [Google Scholar]
- 132.Hingorani DV, Bernstein AS, Pagel MD. A review of responsive MRI contrast agents: 2005–2014. Contrast Media Mol Imaging. 2015;10:245–265. doi: 10.1002/cmmi.1629. [DOI] [PMC free article] [PubMed] [Google Scholar]
- 133.Yang X, Song X, Li Y, et al. Salicylic acid and analogues as diaCEST MRI contrast agents with highly shifted exchangeable proton frequencies. Angew Chemie Int Ed. 2013;52:8116–8119. doi: 10.1002/anie.201302764. [DOI] [PMC free article] [PubMed] [Google Scholar]
- 134.Yang X, Yadav NN, Song X, et al. Tuning phenols with Intra-Molecular bond Shifted HYdrogens (IM-SHY) as diaCESTMRI contrast agents. Chemistry Euro J. 2014;20:15824–15832. doi: 10.1002/chem.201403943. [DOI] [PMC free article] [PubMed] [Google Scholar]
- 135.Song X, Yang X, Ray Banerjee S, Pomper MG, McMahon MT. Anthranilic acid analogs as diamagnetic CEST MRI contrast agents that feature an intramolecular-bond shifted hydrogen. Contrast Media Mol Imaging. 2015;10:74–80. doi: 10.1002/cmmi.1597. [DOI] [PMC free article] [PubMed] [Google Scholar]
- 136.Yang X, Song X, Ray Banerjee S, et al. Developing imidazoles as CEST MRI pH sensors. Contrast Media Mol Imaging. 2016;11:304–312. doi: 10.1002/cmmi.1693. [DOI] [PMC free article] [PubMed] [Google Scholar]
- 137.Hingorani DV, Montano LA, Randtke EA, Lee YS, Cardenas-Rodriguez J, Pagel MD. A single diamagnetic catalyCEST MRI contrast agent that detects cathepsin B enzyme activity by using a ratio of two CEST signals. Contrast Media Mol Imaging. 2016;11:130–138. doi: 10.1002/cmmi.1672. [DOI] [PMC free article] [PubMed] [Google Scholar]
- 138.Sinharay S, Fernández-Cuervo G, Acfalle JP, Pagel MD. Detection of sulfatase enzyme activity with a catalyCEST MRI contrast agent. Chem Euro J. 2016;22:6491–6495. doi: 10.1002/chem.201600685. [DOI] [PMC free article] [PubMed] [Google Scholar]
- 139.Li Y, Chen H, Xu J, et al. CEST theranostics: label-free MR imaging of anticancer drugs. Oncotarget. 2016;7:6369–6378. doi: 10.18632/oncotarget.7141. [DOI] [PMC free article] [PubMed] [Google Scholar]
- 140.Li J, Feng X, Zhu W, et al. Chemical Exchange Saturation Transfer (CEST) agents: Quantum chemistry and MRI. Chemistry Euro J. 2016;22:264–271. doi: 10.1002/chem.201503942. [DOI] [PMC free article] [PubMed] [Google Scholar]
- 141.Sinharay S, Randtke EA, Jones KM, et al. Noninvasive detection of enzyme activity in tumor models of human ovarian cancer using catalyCEST MRI. Magn Reson Med. 2017;77:2005–2014. doi: 10.1002/mrm.26278. [DOI] [PMC free article] [PubMed] [Google Scholar]