

Abstract
Neural activity in medial prefrontal cortex (MPFC), identified as engaging in self-related processing, predicts later health behavior change. However, it is unknown to what extent individual differences in neural representation of content and lived experience influence this brain-behavior relationship. We examined whether the strength of content-specific representations during persuasive messaging relates to later behavior change, and whether these relationships change as a function of individuals’ social network composition. In our study, smokers viewed anti-smoking messages while undergoing fMRI and we measured changes in their smoking behavior one month later. Using representational similarity analyses, we found that the degree to which message content (i.e. health, social, or valence information) was represented in a self-related processing MPFC region was associated with later smoking behavior, with increased representations of negatively valenced (risk) information corresponding to greater message-consistent behavior change. Furthermore, the relationship between representations and behavior change depended on social network composition: smokers who had proportionally fewer smokers in their network showed increases in smoking behavior when social or health content was strongly represented in MPFC, whereas message-consistent behavior (i.e., less smoking) was more likely for those with proportionally more smokers in their social network who represented social or health consequences more strongly. These results highlight the dynamic relationship between representations in MPFC and key outcomes such as health behavior change; a complete understanding of the role of MPFC in motivation and action should take into account individual differences in neural representation of stimulus attributes and social context variables such as social network composition.
Keywords: fMRI, health behavior, RSA, motivation, multivariate analyses, smoking
1 - INTRODUCTION
Activity in MPFC during exposure to persuasive messages can predict later behavior change, and this predictive capacity has been attributed to MPFC’s role in indexing message self-relevance (Cooper et al., 2015; Falk et al., 2010; Falk et al., 2011). Prior neuroscientific research on behavior change has focused on linear mappings between behavior and average activation within the MPFC, but a number of factors can add additional complexity to the relationship between brain and behavior. For example, the same message content may elicit multiple psychological responses which depend on the message recipient’s life experience and social context, and thus have different downstream influences on behavior (Tompson, Lieberman, & Falk, 2015).
In the current investigation, we used representational similarity analysis and social network analysis to examine how brain responses in MPFC are moderated by individual differences in ways that map to later behavior change. To do so, we measured MPFC activity in smokers as they viewed messages that varied in the presence or absence of three key features known to affect health decisions and behavior change: portrayal of risk/negative consequences (Peters, Ruiter, & Kok, 2012; Kim Witte & Allen, 2000); portrayal of social norms/consequences (Cialdini et al., 2006; Mead et al., 2014) and portrayal of health outcomes/consequences (Hammond, 2011) (See section 2.2.1 and Figure 1 for examples). We focused our analyses on a subregion of MPFC involved in self-related processing (hereafter: self-MPFC). Self-relevance is thought to play a large role in the effectiveness of persuasive messages on behavior change (Becker, 1974; Rosenstock, 1974), and a number of researchers have implicated sub-regions of MPFC in self-relevant processing (Amodio & Frith, 2006; Denny et al., 2012; Northoff et al., 2006; Schmitz & Johnson, 2007). Integrating these literatures, a recent report showed that activity in a functionally-defined self-related region of MPFC predicts later behavior change (Cooper et al., 2015). This evidence, along with recent work which shows that multivariate representations of both social and valence content are present within ventral MPFC (Chavez & Heatherton, 2014) suggests that representations of these and similar attributes may exist in MPFC and may be associated with later behavior.
Figure 1.

Diagram of RSA Analysis Method
We implemented representational similarity analyses (RSA; Kriegeskorte, Mur, & Bandettini, 2008; Nili et al., 2014) to test whether individual differences in the representation of message content features related to later behavior change (i.e., smoking reduction). Rather than measuring overall activity for each message in a given brain region, RSA uses the relative similarity of neural activity between items (in our case, messages) to make inferences about the content encoded in that region. Our first hypothesis, therefore, was that individual differences in the degree to which self-MPFC represented message content (information about valence [regardless of consequence type] and information about social and health consequences [regardless of valence]) would be associated with later behavior change. Specifically, we predicted that stronger representations of each type of message content would be associated with greater reductions in smoking behavior.
Even if all viewers were to show similar levels of message content representation in the brain, differences in individual life experiences may modulate the effectiveness of this content in promoting behavior change. Specifically, social context, including social network composition, may change the processing of health information and downstream behaviors (Christakis & Fowler, 2007). In the context of health messaging, this may make social, health and risk information more or less salient to the self or may change the connotations drawn to mind, changing whether the person enacts message-consistent behavior change (O’Donnell & Falk, 2015). Our second hypothesis, therefore, was that individual differences in social network composition moderates the relationship between neural representations of content and smoking behavior, such that an increased proportion of smokers in one’s network would strengthen the impact of neural representations on smoking reduction.
In summary, the fundamental hypotheses of our analyses were 1) that image attribute information relates to message-consistent future behavior by the strength of its representation in the portion of MPFC that engages self-related processing; and 2) that the nature of this relationship will be significantly moderated by the individual’s social environment, as indexed by social network composition.
It should be noted that the current dataset uses the same participants included in Cooper et al., 2015, which examined smoker’s neural responses to a different task, and Falk et al., 2015, which examined aggregate neural responses to the images used in the current task and linked them to population level outcomes. However, no prior reports have used these data to analyze individual differences in representations of image content in MPFC, nor examined social network composition as a moderator of these effects. Hence, the current analyses substantially extend prior reports.
2 - MATERIALS AND METHODS
2.1 - Participants
50 smokers took part in the fMRI study, and all participants were consented in accordance with the procedures of the Institutional Review Board of the University of Michigan. Sample size was based on funding availability. 3 subjects were excluded for excessive head motion (movement exceeding 3mm translation or 1 degree rotation), 5 subjects were excluded for questionable data quality (distorted field maps and recon “features”), 1 subject could not be reached for their final session, and 1 subject was excluded as a behavioral outlier (see section 2.2) leaving us with 40 usable subjects (Females: 15, age mean/SD: 32.9/13.1, age range: 19 to 64 years old). 25 subjects were White/European, 5 were African American, 5 were Hispanic, and 5 reported a mixed ethnicity. 8 participants reported a bachelor’s degree or higher, 3 participants reported an associate’s degree, 10 participants were currently in college, and 19 participants had a high school degree or lower. (See Figure S-1 in supplementary materials for a detailed chart of subject exclusion criteria.1)
Participants were recruited from the general population using Craigslist and UMClinicalStudies.org. Interested participants completed an eligibility screening phone call. To participate in the study, participants should have been a smoker for at least 12 months, reported smoking at least 5 cigarettes per day for the past month, and been between the ages of 18 and 65. Additionally, participants had to meet standard fMRI eligibility criteria, including having no metal in their body, no history of psychiatric or neurological disorders, and not taking any psychiatric or illicit drugs at the time of the study. Additionally, all participants were required to be right-handed.
2.2 - Procedure
Enrolled participants completed three separate appointments. During the intake appointment (session 1), participants received consent and completed baseline self-report surveys over the course of approximately an hour, including questions about the level of their intentions to quit smoking and their smoking behavior. During the second session, subjects completed an hour of tasks in the fMRI scanner as well as pre- and post-scan self-report measures that included the baseline smoking behavior value employed here. The overall session lasted approximately 3 hours, and took place an average of 4.8 days after the first appointment (SD: 3.3 days). The third and final session was a phone appointment, in which participants gave follow-up self-report measures, including endpoint smoking behavior. This appointment took place an average of 38.8 days after the fMRI appointment (SD: 8.4 days). As a standard procedure in preparing data for regression analyses, we checked for outliers in our behavioral measure of proportional change in smoking behavior (see below for information on the calculation of this measure). Out of the 41 scanned subjects for which we had data from all three sessions, only one subject was identified as a behavioral outlier (> 2.5 SD from the mean on behavior change; the participant in question reported smoking 18 cigarettes per day at time points 1 and 2, and then reported smoking 40 cigarettes per day at time point 3, whereas no other subject at any time point reported smoking more than 30 cigarettes per day). We excluded this subject, as we believe the final behavioral report may have been misrecorded and outlying data is known to have a disproportionate weighting when determining linear fit.
For all three appointments, participants reported the number of cigarettes they smoked per day. As a reference, they were told that a pack contains 20 cigarettes. Self-report measures are significantly correlated with physiological metrics such as expired CO (Falk et al., 2011; Vogt et al., 1977) and saliva, urine, and serum cotinine (Etter, Vu Duc, & Perneger, 2000; Klebanoff et al., 1998; Pickett et al., 2005; Pokorski, Chen, & Bertholf, 1994). As such, self-report measures are commonly used to track smoking behavior change (H F Chua et al., 2011; Jasinska et al., 2012).
During each session, participants were asked whether they were currently enrolled in any type of quit-smoking program and/or whether they had a planned quit date. Of the 40 participants, on the day of the scan no participants were enrolled in a quit smoking program nor had a planned quit date. At the follow-up appointment, two participants were enrolled in a quit program, one had stopped smoking, and one other subject had a planned quit date. Given that only two participants were enrolled in quit smoking programs, we inferred that the majority of the change in participants’ smoking behavior was not a result of external professional interventions.
In all of our analyses, our behavioral outcome measure of interest was the proportion change in number of reported cigarettes smoked per day. To calculate this number for each participant, we subtracted the cigarettes smoked per day at baseline (session 2) from the cigarettes smoked per day at the endpoint (session 3), and divided this number by the baseline measure (session 2): [(CigarettesEndpoint – CigarettesBaseline)/CigarettesBaseline].
2.2.1 - fMRI tasks
The main focus of our study was a task in which participants viewed and rated images that were modeled off of proposed graphic warning labels for tobacco by the U.S. Food and Drug Administration (FDA). Each image was shown with the accompanying text: “Stop Smoking. Start Living.” Images were each presented for 4s, after which participants were prompted with the text “This ad makes me want to quit.” Participants had 3 seconds to make a rating on a Likert 5-point scale in response to the prompt (anchors: definitely not, definitely does). A jittered fixation between trials varied between 3–7.5 seconds with a mean of 4.1 seconds. Our analyses focus on the 60 images that were viewed by all subjects across 2 runs. (20 additional images were personalized for each participant, and were not analyzed here.) Each of the two runs for each subject contained a random sample of 15 neutral-valence images and 15 negative-valence images which were selected using the Python random sample function sample() from the standard library random module. ‘Risk’ information in the negative valence images either related to social or health consequences. Negative-valence social images portrayed scenes such as social exclusion from family, co-workers and friends (n =12). Negative-valence health images portrayed scenes such as individuals in the hospital or a casket, smoking related symptoms such as yellow teeth or a neck stoma (n=18). Neutral-valence social images portrayed social scenes with family, co-workers, and friends (n=11). Neutral-valence health images portrayed people being physically active (n = 19). (Figure S-2 shows all images displayed by category.) The neutral images were matched with the negative images on dimensions including the number and general demographics of people in the images, but did not portray smoking behavior and had “neutral” valence. (Valence as “negative” or “neutral” was based on independent data in which 70 smokers participated in an Amazon Mechanical Turk survey where they rated each image on a 5 point Likert scale according to various emotions [negative: depressing, disgusting, frightening, unpleasant; positive: encouraging, hopeful, inspiring, meaningful]. Given that the positivity for the control images was 2.01 for the degree to which the four positive emotions were represented, with 1 = “not at all” and 5 = “very much,” we labeled these images as having “neutral” rather than “positive” valence). During the course of the scan, subjects also completed a self-related processing localizer task used to identify the portion of MPFC most highly associated with self-related processing, and two other tasks which are not the focus of this study (see Cooper et al. 2015 for a description of the banner ads task. Additionally, an “arguments” task presented subjects with statements about what they should do [e.g. “people should eat broccoli”], and subjects were instructed to respond whether they agree with the statement [agree condition], think of reasons in support of doing that task [in favor condition] or think of reasons against doing that task [against condition]).
2.2.2 - Social Network Structure
At the end of Session 1, participants completed a web-based task that measured their social network composition focusing on their friends and the connections between them (i.e. the participant’s ego network; Marsden, 2002). Participants first listed up to twenty individuals with whom they had interacted in the past week through each of the following communication mediums: 1. face-to-face interaction, 2. phone calls, 3. text messages and 4. social media (i.e., Facebook interactions)2, as well as any close friends and family members (who might not have been captured in the previous lists). They then indicated (i) how close they felt to each individual, (ii) whether each individual was a cigarette smoker and (iii) which of those individuals listed knew each other (see O’Donnell and Falk 2015:278–279 for more details). We then calculated the ratio of smokers in each network by dividing the number of smokers in each participant’s network by the number of non-smokers in each participant’s network.
2.2.3 - fMRI Acquisition
Neuroimaging data were acquired using a 3 Tesla GE Signa MRI scanner. Two functional runs for the self-localizer task (288 volumes total) were collected at the start of the scan and two functional runs of the images task (227 volumes each) were also collected. Functional images were recorded using a reverse spiral sequence (TR = 2000 ms, TE = 30 ms, flip angle = 90°, 43 axial slices, FOV = 220 mm, slice thickness = 3mm; sequential descending slice acquisition; voxel size = 3.44 × 3.44 × 3.0 mm). The first 5 TRs were not recorded to account for stabilization of the BOLD signal. We also acquired in-plane T1- weighted images (43 slices; slice thickness = 3 mm; voxel size = .86 × .86 × 3.0mm) and high-resolution T1-weighted images (SPGR; 124 slices; slice thickness = 1.02 × 1.02 × 1.2 mm) for use in co-registration and normalization.
2.3 - Imaging Data Analysis
Preprocessing and data analysis for individual participants was performed using the FMRIB Software Library (Jenkinson et al., 2012). Functional images were pre-processed using FEAT (v6.0.0). Volumes were slice-time corrected, and motion correction (MCFLIRT) was applied by spatially realigning each image with the central image in the run, and these images were then registered to the subject-specific T1-weighted image using Boundary-Based Registration (Greve & Fischl, 2009). High-pass filtering was applied to remove temporal frequencies below 0.02 Hz. Given the nature of our pattern-based analyses, no smoothing was applied.
General linear modeling (GLM) was used to estimate the neural response to each individual image. For each image, we constructed a separate GLM (see Mumford, Turner, Ashby, & Poldrack, 2012) with the following predictors: 1) a predictor for the 4-second image presentation, 2) a complementing predictor representing all other image presentations in that run, and 3) a predictor representing all feedback periods. Nuisance predictors for global and motion outliers were also included. These outliers were calculated using the Gabrieli Lab’s Artifact Detection Tools scripts (global signal threshold: 3 SD, movement threshold: 2mm; www.nitrc.org/projects/artifact_detect/). All predictors were convolved with FSL’s canonical double-gamma HRF.
Unsmoothed parameter estimates for each individual image contrast were registered to the cortical surface using surface templates that had been derived from each participants’ T1-weighted anatomical image using Freesurfer’s segmentation function (recon-all). The data were then spherically registered to a standard “Buckner40” brain (fsaverage).
2.3.1 - ROI Definition
In our analyses we were specifically interested in message content within medial prefrontal cortex (MPFC). We used a self-localizer task to define a group-level MPFC ROI. In this task, participants judged trait words in relation to themselves (e.g., does the participant view herself as “funny”?) and in relation to the word’s valence (e.g., is “funny” a positive word?). The same 36 (18 negative and 18 positive) trait words were shown in each condition and were selected from the Anderson trait word list (Anderson, 1968). The task included blocks of six trials with three positive and three negative words in each block, with each block preceded by a three second orientation screen and followed by a two second fixation screen. To maintain a consistent ROI with previous analyses from this dataset, we derived our ROI directly from the ROI reported in Cooper et al. 2015. Therefore, for this contrast, analyses were conducted in SPM and 45 subjects were used in the group contrast of self-related judgments > control judgments. In that analysis, subject level maps were smoothed (8mm Gaussian kernel) and registered to standard space. The statistical map from the second-level group GLM was corrected with a family-wise error correction at p<0.05, and the resulting ROI was defined as that region that survived correction within the larger anatomical region of MPFC (MNI coordinates: −6, 56, −5; max t-value: 7.23; # voxels: 53). The only difference from Cooper et al. was that we then registered this ROI to to standard surface space (fsaverage). This resulting ROI mapped entirely to the left hemisphere (See Figure 1).
2.3.2 - Representational Similarity Analyses
Our analyses tested two primary hypotheses: 1) that image characteristics are represented in MPFC in a way that relates to future behavior; and 2) that social network composition modulates this relationship. Representational similarity analyses (RSA) have the potential to explore the nature of a region’s representational space by using open-ended exploratory techniques and by testing hypothesis-driven models (Kriegeskorte et al., 2008; Mur, Bandettini, & Kriegeskorte, 2009). Here, our analyses centered on three types of content in the messages: social information, health information, and valence information.
All of our analyses initially required the construction of “model” and neural representational dissimilarity matrices (RDMs). RDMs are matrices that summarize the pairwise similarities between all stimuli in the experiment (in our case, anti-smoking messages). Similarity can be measured by comparing neural activity or the presence or absence of certain types of content. RDMs themselves can be compared to each other in informative ways. Broadly, in our study, we had predictions about what kind of message content would be most relevant to behavior change (e.g. social consequence information), and so constructing an RDM labeling which pairs of messages were similar/dissimilar in their social content allowed us to then compare this model to the actual neural RDM. From this comparison, we could infer that the greater the similarity between the neural and model RDM, the greater degree to which that ROI represents the modeled content (e.g. social information). Importantly, we could then test whether this strength of representation is predictive of later smoking behavior.
More specifically, we first constructed model matrices to signify what the neural data would look like if they perfectly represented our content of interest (valence, social, and health information). Because these RDMs were coding dissimilarity, cells were coded as “1” if the two message pairs represented different kinds of content, and cells were coded as “0” if the two message pairs represent the same kind of content. Separate RDMs were constructed for valence (negative consequences and controls), social information, and health information (See Figure 1 for a representative subset of these RDMs). Given that subjects viewed 60 messages in total, matrices contained 60 rows by 60 columns, such that all pairwise relationships between messages were represented. Cells in the valence matrix were coded as “0” if both messages reflected either negative or neutral repercussions of smoking. Cells were coded as “1” if one message was negative and the other neutral. For the social information matrix, cells were coded as “0” if both messages reflected social information. Cells were coded as “1” if one message reflected social information and one reflected health information or if both messages reflected health information. For the health information matrix, only pairs of health-related messages were coded as “0”. (Note that the social and health matrices were not exact reflections of each other, given that both matrices coded as “1” cases in which pairs were not matched on content type.)
We then constructed RDMs out of the actual neural response patterns to each message. There were two ways in which we measured neural similarity between messages, resulting in two sets of RDMs. In our “univariate” RDMs, each cell contained the Euclidean distance between the average levels of activity in the ROI for both messages (averaged betas across all vertices3 in MPFC). If this average overall activity for both messages was either low or high, this distance measure would be low, signifying low dissimilarity (i.e. high similarity). In our “multivariate” RDMs, matrix cells were calculated by taking 1 minus the pairwise correlation between patterns of activity (i.e. between two vectors containing all vertex values within MPFC). We used both univariate and multivariate RDMs so that both kinds of content representation (overall ROI activity and vertex-wise patterns of activity) could be used as predictors of later behavior. Most studies using RSA are focused on directly interrogating multivariate patterns of activity contained in specific regions of the brain or relating neural RDMs to item-specific responses, rather than using RSA as a means to measure the relationship between representation of a content set and person-level changes in behavior outside of the scanner. For our purposes, a key benefit in using the RSA method is that we can derive a single number for the degree to which activity within a region of interest reflects specific content features (by correlating RDMs of BOLD activity to each model RDM), and this number can be entered into a regression model to predict behavior. We computed both univariate and multivariate RDMs to bridge the gap between the two research traditions we are bringing together—brain-as-predictor studies that have traditionally focused on univariate activation, and RSA analysis that has traditionally focused on multivariate patterns (See Discussion section 4.4 for an extended discussion of the use of both univariate and multivariate RDMs.)
For both model and neural RDMs, the matrices were symmetric around the diagonal and so subsequent analyses were therefore conducted using only the upper diagonals. All analyses used a combination of scripts from the RSA Toolbox (http://www.mrc-cbu.cam.ac.uk/methods-and-resources/toolboxes/) and custom Matlab scripts.
2.3.3 - Message Content and Behavior Change
Our first major goal was to test whether differences in the strength of neural content representation across subjects predicted differences in later behavior change. To do this, we regressed proportion change in smoking behavior against three predictors: the Spearman4 correlations between the individual’s neural RDM and the three model RDMs valence, social information, health information. (See Figure 1 for a schematic of the analysis steps.) One regression used univariate neural RDMs and a second regression used multivariate neural RDMs. The model used is summarized by the following equation:
| (1) |
Where ΔB is the proportion reduction in smoking behavior, and V, S, and H, are the correlations (Fisher r-to-z transformed) between the neural RDM and valence information, social information, and health information, respectively.
Based on significant findings for certain predictors in our univariate and multivariate models, we ran an additional exploratory regression for each, subdividing content into both valence and content type: negative social information, negative health information, neutral social information, and neutral health information.
| (2) |
Where ΔB is the proportion reduction in smoking behavior, and NS, NH, TS, and TH are the correlations (Fisher r-to-z transformed) between the neural RDM and the negative social, negative health, neutral social, and neutral health models, respectively.
2.3.4 - Social Network Structure and Behavior Change
Our second goal was to test whether the makeup of an individuals’ social network influenced the way content motivated behavior. To do this, we measured, for each subject, the proportion of smokers to non-smokers in their recent social interaction network and added this value as an interaction term to each of the three model predictors from equation 1. The model used is summarized by the following equation:
| (3) |
Where all of the terms are the same as Equation 1, and the additional variable R is the proportion of smokers to non-smokers in each subjects’ social network.
All regressions were run using the software R (Version 3.1.0; R Core Team, 2014). Diagnostic plots were used for all regressions to confirm normality and homoscedasticity.
3 - RESULTS
3.1 - Behavioral Results
The major dependent measure in our study was change in smoking habits before and after a scan session where participants viewed anti-smoking messages. Overall, 27 participants reported reducing their smoking behavior (the number of cigarettes smoked per day at follow-up was less than the number reported during the scan session), 7 participants reported no change in behavior, and 6 participants reported an increase in smoking behavior. The mean proportion change was a 25.3% decrease in smoking behavior (SD: 36.5%).
Participants also completed questionnaires that allowed us to conduct a social network analysis of the ratio of smokers to non-smokers in each participants’ recent interaction network (i.e., people the participant interacted with in the past week). On average, participants reported interacting in the past week with 25.8 friends (SD: 11.44, min: 5, max: 48). Across subjects, the average ratio of smokers to non-smokers was 0.55, meaning that, on average, there were 0.55 smokers in a participants’ recent interaction network for every 1 non-smoker. 4 participants had equal or more smokers than non-smokers in their network, whereas the rest had a greater proportion of non-smokers.
3.2 - Message Content Representations Predicts Behavior Change in MPFC
Our first question asked whether the degree to which specific message content was represented in a functionally localized region of interest defined by self-related processing (self-MPFC) predicted later smoking behavior change. We defined this self-MPFC ROI in a separate localizer task as the region involved in self-related processing (see section 2.3.1). For each image, content-related information could potentially be encoded by either the mean signal across the self-MPFC (i.e., univariate signal) or by a particular pattern of activation within the self-MPFC (i.e., multivariate signal). Therefore, we measured the similarity of neural activity in self-MPFC between all messages by constructing two kinds of representational dissimilarity matrices (RDMs): one comparing univariate activity between all pairwise messages, and one comparing multivariate activity between all pairwise messages. These RDMs were then correlated with RDM models of message content (valence, social, and health information) to determine the degree to which neural activity acted similarly to idealized models of each type of message content (neural RDMs correlated with univariate valence RDM: mean r = −0.001, SD = 0.015; with univariate social RDM: mean r = 0.010, SD = 0.069; with univariate health RDM: mean r = −0.008; SD = 0.081; with multivariate valence RDM: mean r = −0.007, SD = 0.016; with multivariate social RDM: mean r = 0.005, SD = 0.048; with multivariate health RDM: mean r = −0.007, SD = 0.052, see Supplemental Materials S-3 for additional tests and discussion related to these results). These scores were then input into regressions predicting later smoking behavior (See Figure 1 for an overview of the analysis steps).
Our univariate RSA regression model revealed that the degree to which the self-MPFC represented valence information significantly predicted later behavior change (β = −9.69, t(36)= −2.55, p=0.015): Subjects who represented valence information in self-MPFC more strongly during exposure to persuasive messages were more likely to reduce their smoking over the next 30 days (See Figure 2).
Figure 2.
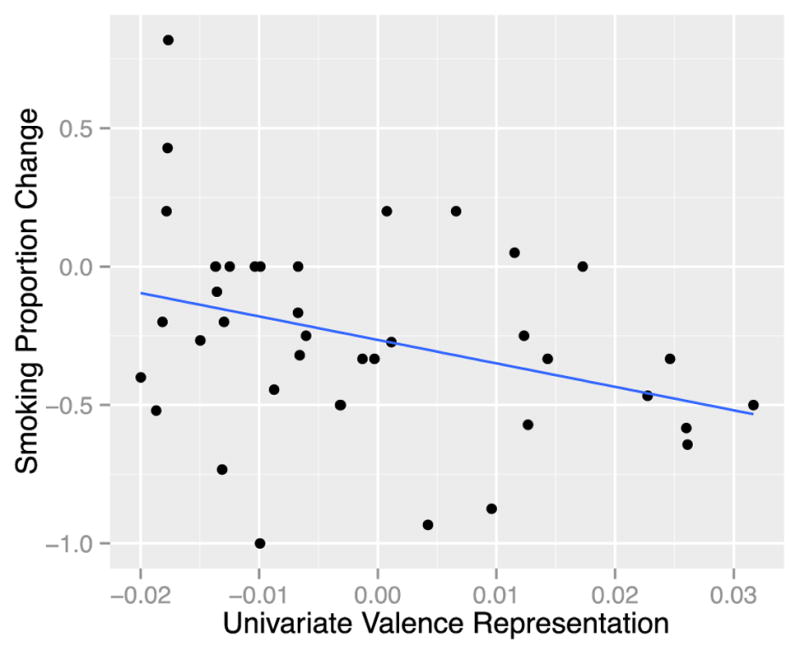
Univariate Valence Representation Predicts Behavior Change. As univariate representations of valence increase, smoking decreases. Each data point represents one subject (n = 40). The x-axis displays the degree to which a subjects’ neural RDM correlated with the valence model RDM (all scores were Fisher r-to-z transformed). The y-axis displays the degree to which a subject changed smoking behavior (negative numbers indicate an overall proportion reduction in smoking.)
Univariate representations of the other two types of content did not significantly predict behavior change. (The overall univariate model significantly predicted behavior: R2 = 0.195, adjusted R2 = 0.128, F(3,36) = 2.91, p = 0.048.) Our multivariate RSA model, on the other hand, revealed that at the pattern level, social information (driven by negative social information, as described below; table 2) significantly predicted later behavior, such that those who showed greater representation of social information in the multivariate pattern of responses within MPFC showed an increase in smoking behavior (β = 6.20, t(36) = 2.17, p=0.007) (Figure 3); In other words, subjects who more strongly represented the (negative) social content of the persuasive messages at the multivariate level were less likely to reduce smoking over the next month. Multivariate representations of valence and health content were not associated with later behavior change. (The overall multivariate model significantly predicted behavior: R2 = 0.242, adjusted R2 = 0.178, F(3,36) = 3.823, p = 0.018.) (See Table 1 for full results of both univariate and multivariate models).
Table 2.
Sub-types of Content Representations Predicts Behavior
| |||||||
|---|---|---|---|---|---|---|---|
| (N=40) | β | Std. Error | t-value | 95% C.I. | P-value | ||
| Using univariate RDMs | |||||||
| β1NH (negative health) | −5.71 | 2.67 | −2.14 | −11.14, −0.28 | 0.040* | ||
| β2NS (negative social) | −4.75 | 2.57 | −1.85 | −9.96, 0.47 | 0.073 | ||
| β3TH (neutral health) | −4.71 | 2.45 | −1.92 | −9.67, 0.26 | 0.063 | ||
| β4TS (neutral social) | −6.77 | 3.02 | −2.24 | −12.91, −0.63 | 0.032* | ||
| Using multivariate RDMs | |||||||
| β1NH (negative health) | 1.04 | 1.82 | 0.57 | −2.66, 4.73 | 0.573 | ||
| β2NS (negative social) | 6.74 | 1.56 | 4.32 | 3.57, 9.91 | 0.000*** | ||
| β3TH (neutral health) | 2.86 | 1.62 | 1.76 | −0.43, 6.15 | 0.086 | ||
| β4TS (neutral social) | 2.28 | 1.74 | 1.31 | −1.25, 5.82 | 0.198 | ||
In self-MPFC, representations of social and health information were sub-divided into valence types and used to predict smoking behavior change (where negative values mean a reduction in smoking). (p<0.05=*, p<0.001=***, β = unstandardized parameter estimate, C.I. = confidence interval).
Figure 3.
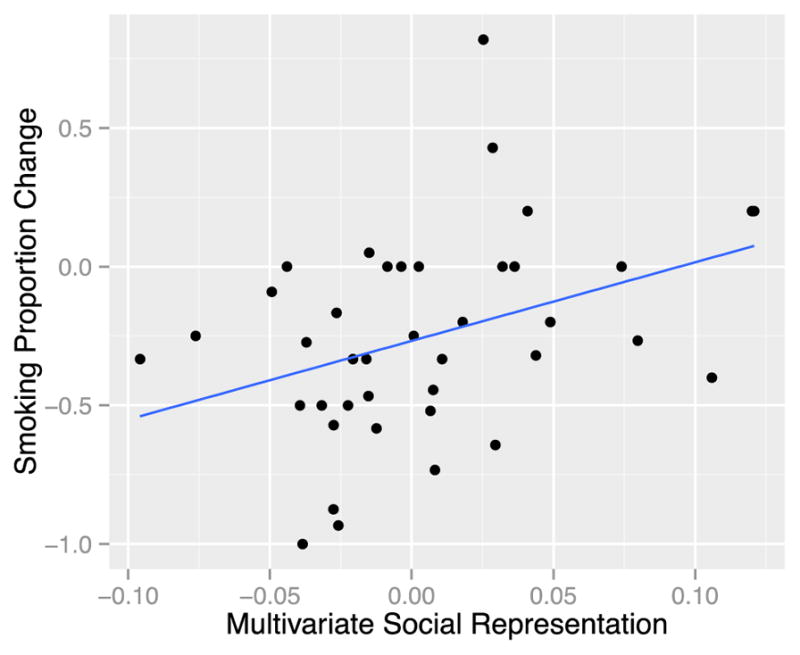
Multivariate Social Representation Predicts Behavior Change. As multivariate representations of social information increase, participants reduce their smoking less. Each data point represents one subject (n = 40). The x-axis displays the degree to which a subjects’ neuralRDM correlated with the social model RDM (all scores were Fisher r-to-z transformed). The y-axis displays the degree to which a subject changed smoking behavior (negative numbers indicate an overall proportion reduction in smoking.)
Table 1.
Content Representations Predict Behavior
| |||||||
|---|---|---|---|---|---|---|---|
| (N=40) | β | Std. Error | t-value | 95% C.I. | P-value | ||
| Using univariate RDMs | |||||||
| β1V (valence) | −9.69 | 3.8 | −2.55 | −17.40, −1.99 | 0.015* | ||
| β2S (social consequences) | −5.73 | 3.16 | −1.81 | −12.14, 0.68 | 0.078 | ||
| β3H (health consequences) | −4.35 | 2.67 | −1.63 | −9.76, 1.07 | 0.112 | ||
| Using multivariate RDMs | |||||||
| β1V (valence) | 5.01 | 3.37 | 1.49 | −1.83, 11.86 | 0.146 | ||
| β2S (social consequences) | 6.18 | 2.17 | 2.84 | 1.77, 10.58 | 0.007** | ||
| β3H (health consequences) | 3.25 | 2.01 | 1.62 | −0.82, 7.32 | 0.114 | ||
In self-MPFC, the degree to which brain activity correlated with models of valence, social, and health representation were used as predictors of smoking behavior change (where negative values indicate a reduction in smoking). (p<0.05=*, β = unstandardized parameter estimate, C.I. = confidence interval).
We explored these results further by looking at whether the predictive valence information at the univariate level was more strongly associated with the valence of social or health information, and whether the predictive social information at the multivariate level was more strongly associated with negative or neutral valence. To do this, we ran another set of regressions, this time encoding for 4 subtypes of content: negative health, negative social, neutral health, and neutral social (See equation 2 in section 2.3.3). Here, for the univariate encoding of valence, it was negative health information (i.e., risk information) and neutral social information that were significantly predictive of later behavior change (negative health: β = −5.71, t(35) = −2.14, p = 0.040; neutral social: β = −6.77, t(35) = −2.24, p = 0.032) (The overall fit of this univariate model was R2 = 0.133, adjusted R2 = 0.034, F(4,35) = 1.338, p = 0.275). Teasing apart the multivariate encoding of social information, we found that negative social information, specifically, was predictive of behavior change (β = 6.74, t(35) = 4.32, p = 0.0001). (The overall fit of this multivariate model was R2 = 0.367, adjusted R2 = 0.295, F(4,35) = 5.07, p = 0.0025). (See Table 2 for the full results of these regressions.)
3.3 - Social Network Structure Moderates MPFC Prediction of Behavior Change
We next examined whether the relationship between the strength of representation of specific image attributes and later behavior change was moderated by individual differences in social context. Given the importance of social networks in setting social norms and experiences of consequences, we examined the interaction between the ratio of smokers to non-smokers in each participant’s social network and brain activity in predicting behavior change.
As a reminder, in our univariate model without the interaction term, stronger valence representation had been associated with greater reductions in smoking behavior. Adding the social network interaction term did not significantly moderate this relationship with valence information (See Table 3). (The overall fit of this univariate model was R2 = 0.245, adjusted R2 = 0.079, F(7,32) = 1.479, p = 0.21.)
Table 3.
Social Network Composition Modulates Brain-Behavior Relationship
| |||||||
|---|---|---|---|---|---|---|---|
| (N=40) | β | Std. Error | t-value | 95% C.I. | P-value | ||
| Using univariate RDMs | |||||||
| β1R (propSmokers) | −0.01 | 0.19 | −0.03 | −0.39, 0.38 | 0.978 | ||
| β2V (valence) | −17.32 | 8.06 | −2.15 | −33.73, −0.90 | 0.039* | ||
| β3S (social consequences) | 0.39 | 5.97 | 0.07 | −11.77, 12.55 | 0.948 | ||
| β4H (health consequences) | 1.26 | 5.57 | 0.23 | −10.09, 12.61 | 0.823 | ||
| β5V*R (valence*propSmokers) | 24.43 | 19.71 | 1.24 | −15.72, 64.59 | 0.224 | ||
| β6S*R (social conseq*propSmokers) | −9.65 | 7.36 | −1.31 | −24.65, 5.35 | 0.199 | ||
| β7H*R (health conseq *propSmokers) | −20.05 | 8.28 | −1.21 | −26.91, 6.81 | 0.234 | ||
| Using multivariate RDMs | |||||||
| β1R (propSmokers) | −0.37 | 0.19 | −1.93 | −0.77, 0.02 | 0.063 | ||
| β2V (valence) | 11.34 | 4.70 | 2.41 | 1.77, 20.90 | 0.022 | ||
| β3S (social consequences) | 12.92 | 3.51 | 3.68 | 5.77, 20.07 | 0.0008*** | ||
| β4H (health consequences) | 7.64 | 2.59 | 2.95 | 2.37, 12.90 | 0.006** | ||
| β5V*R (valence*propSmokers) | −11.71 | 7.36 | −1.59 | −26.71, 3.28 | 0.121 | ||
| β6S*R (social conseq*propSmokers) | −12.26 | 5.48 | −2.24 | −23.42, −1.11 | 0.032* | ||
| β7H*R (health conseq *propSmokers) | −6.01 | 2.30 | −2.61 | −10.69, −1.33 | 0.014* | ||
For self-MPFC, a social network parameter (proportion smokers to non-smokers, where higher values mean more smokers) was added as an interaction term to each Equation 1 predictor. (p<0.05=*, p<.01=**, p<.001=***, β = unstandardized parameter estimate, C.I. = confidence interval)
Our original multivariate model had shown that stronger social representations were associated with message inconsistent behavior change; an interaction analysis suggested that this effect was stronger for those who had a smaller proportion of smokers to non-smokers in their social network (network*social consequences: β = −12.26, t(32) = −2.24, p = 0.032) (See Figure 4b). Next, although we did not observe a main effect of multivariate representations of health consequences on behavior change, adding the social network term revealed a significant interaction between the proportion of smokers in a participant’s network and representations of health information (network*health: β = −6.01, t(32) = −2.61, p=0.014) (See Table 3). In this case, greater proportions of smokers in the social network were associated with increased message-consistent change in smoking as MPFC representation of health information also increased (See Figure 4a). (The overall fit of this multivariate model was R2 = 0.410, adjusted R2 = 0.281, F(7,32) = 3.179, p = 0.011.)
Figure 4.

Interaction Plots for Social Network Analysis (residuals). Low relative proportions of smokers in participant social networks were associated with stronger relationships between multivariate representations of social and health information and smoking change. (For visualization purposes, subjects were divided by network composition into approximately equal groups, though statistics presented in the main paper use continuous variables. Low = less than/equal to 24%; High = greater than 49%)
Conversely, for those who had a smaller proportion of smokers to non-smokers in their network, the more strongly health content was represented in MPFC and the less consistent the participant’s behavior was with the anti-smoking messages. Stated another way, participants with larger numbers of smokers in their social networks were more likely to maintain or reduce smoking when health information was strongly represented in self-MPFC.
4 - DISCUSSION
Our data provide new insight about how neural representations, in combination with social context, may be associated with future action. Broadly, our results demonstrate a novel method for understanding the nuanced relationship between brain and long-term behavior and substantially extend prior investigations that have linked average brain activity in MPFC during persuasive messages to later behavior change (e.g. Chua et al., 2011; Cooper et al., 2015; E. Falk et al., 2015; Wang et al., 2013). First, we show that univariate patterns of message valence predict message-consistent behavior change. Second, we show that social network composition influences the relationship between behavior change and self-MPFC multivariate representations of social and health outcomes. Supplemental results confirmed that representations within self-MPFC of the degree to which each image makes a person want to quit smoking were also predictive of actual later smoking reduction. When controlling for this variable, however, our primary results linking content representations to behavior change still hold, suggesting that message content dimensions such as valence and social consequences may not be directly tied to a conscious perception of motivation to quit, but rather serve as additional factors associated with behavior change (See supplemental analysis S-2 which uses a model RDM representing self-reports of the degree to which each image makes a person want to quit smoking). The fact that heterogeneity in neural representations of message content was associated with later behavior change also highlights that the same message concepts may carry variable influence across individuals. Further, the relationship between neural representations in MPFC and behavioral outcomes depends both on the specific type of content and message recipient’s social context.
4.1 - Message Valence and Behavior Change
During the presentation of persuasive anti-smoking messages, increased univariate representations of valence in a region of MPFC defined by a self-localizer task were associated with decreased smoking behavior over the next 30 days. Stronger representations of negative health content, specifically, were predictive of message consistent behavior change, and the direction of this effect did not depend on individual social context (i.e., social network composition). Prior research has found mixed effects of portraying negative health outcomes and eliciting fear responses (e.g., Earl & Albarracín, 2009 vs. Peters, Ruiter, & Kok, 2013; K Witte & Allen, 2000). Our results offer one piece of evidence to help reconcile these disparate findings by suggesting the possibility that the portrayal of strong negative consequences (e.g., fear appeals) is not uniformly effective, but rather individuals who show the strongest representation of valence, and in particular negative health consequences show the greatest behavior change.
4.2 - Context-Dependent Effects on Behavior Change
We also examined how content representations differentially predicted smoking behavior change for smokers depending on the participant’s broader social environment (i.e., proportions of other smokers in their social networks). We found that MPFC multivariate representations of social and health information were predictive of later behavior change, but this brain-behavior relationship was context-dependent. Smokers who had recently interacted with few other smokers in their social network were less likely to show message consistent behavior when representing social or health content during persuasive messaging. As the proportion of smokers increased, this tendency was attenuated. By contrast, participants who had recently interacted with more smokers than non-smokers were more likely to show message consistent behavior and reduce smoking when social or health information was strongly represented in self-MPFC. Why would this be the case? One possibility is that a greater presence of smokers in one’s daily life offer more vicarious experience of the risks and benefits portrayed in those messages. Another possibility is that smokers who know fewer other smokers show an increased resistance and defensiveness when presented with anti-smoking messages, given a social context in which they may already have built defenses against similar arguments from their non-smoking friends, family and other social contacts. More broadly, these findings are consistent with the idea that persuasive content can affect behavior differently based on sociocultural context and thus how content is interpreted and received (Tompson et al., 2015).
4.3 - The MPFC and self-relevance during health messaging
The current data also advance our understanding of the role of MPFC during decision-making. Numerous studies have shown that subregions of the MPFC are more active when making judgments that require self-knowledge (Amodio & Frith, 2006; Denny et al., 2012; Northoff et al., 2006; Schmitz & Johnson, 2007). Different types of self-related processing also appear in major theories of behavior change (Becker, 1974; Rosenstock, 1974). However, “self-related processing” is an umbrella term that can include a number of distinct processes, and different theories of decision-making and behavior change have focused on separate elements. The current results may provide a platform to integrate prior results. In particular, RSA offers a method to handle complex stimuli (like emotionally laden health messages) and, in our study, suggests that variability in how individuals represent the consequences of smoking to themselves and socially may also predict who will be most likely to enact change.
Although tested here in the context of health communication, this method could also be applied to other types of decisions and actions. For example, financial decisions and consumer choices are motivated by a variety of self-related factors (i.e., how valuable is this to me?) where representations of stimulus properties may be able to complement the types of integrated “decision-signals” captured by the average signal in MPFC. In this way, our data extend neuroeconomic views of MPFC by suggesting ways in which different stimulus properties encoded in MPFC can predict complex behaviors.
4.4 - RSA Methodology
Prior neuroscientific research on behavior change has focused on linear mappings between behavior and average activation within the MPFC, but analyses that take into account additional representational and contextual complexity can additionally enhance our understanding of this brain-behavior relationship. Representational similarity analyses, in particular, offer a suite of methods that uses neural and model relationships between items (representational dissimilarity matrices, RDMs) to derive the informational content of neural signals (Kriegeskorte, Mur, & Bandettini, 2008; Nili et al., 2014). Most studies using RSA focus on using multivariate pattern similarities to directly interrogate information contained in specific regions of the brain or to relate neural RDMs to item-specific behavior (these types of behavior measures can also be represented by RDM). Our approach was to bring together two prior research traditions, multivariate RSA analysis of within-subject effects in the scanner, with brain-as-predictor analyses (Berkman & Falk, 2013) that have traditionally focused on average, univariate BOLD activation. Rather than asking about what kind of content is generally represented in MPFC, we examine whether the degree to which content is represented predicts later behavior. (In fact, using our own data to average across the group as a whole, we found no significant correlations between either of the multivariate or univariate RDMs and the three content models. [See analysis S-3 in supplementary information.]) In this way, we take RSA one step further by entering into a regression these correlations between brain and model RDMs. To do this, we found value not only in the more standard RDMs which are constructed using similarities in multivariate patterns, but also in creating RDMs using similarities in item-wise univariate activity. By deriving single numbers for the degree to which univariate (or multivariate) activity represents each characteristic of message content (by correlating this RDM to each model RDM), these numbers could then be easily entered into a regression model to predict behavior. In traditional brain-as-predictor approaches, deriving a single value from a standard univariate contrast would require averaging across all items in a given category without preserving those item-specific relationships. With this approach, we believe our method offers a conceptual advance and bridge between two previously unconnected methodologies.
In our study, we used RSA to ask how the brain represented message content in MPFC using both overall BOLD response as well as multivariate patterns of activity. The presence of content contained within MPFC multivariate patterns of activity, specifically, has been demonstrated in other recent literature on stimulus evaluation (Kahnt, Heinzle, Park, & Haynes, 2010; Mcnamee, Rangel, & O’Doherty, 2013; Pegors, Kable, Chatterjee, & Epstein, 2015). Measuring similarities in the patterns of neural responses provided additional information beyond just measuring the overall univariate direction of the response. Among other advantages, multivariate methods may better take into account a property of neuronal populations known as “opponent coding,” in which information is coded by some neurons as increased firing and by other neurons as decreased firing. For example, studies in macaques have shown that similar numbers of neurons encode value by either increasing or decreasing their firing rates (Kennerley, Behrens, & Wallis, 2011; Padoa-Schioppa, 2009). This property of encoding means that in may cases, the summed signal across the region may appear similar between conditions, even though information is very much present. Multivariate techniques can uncover some of this information not seen using univariate approaches (for an example, see Kahnt et al. 2010). The goal of our method was not to measure the presence of stimulus characteristics in MPFC at this level of representation per se, but to show that the strength of such representations in this region are meaningfully related to later behavior change.
Our results located meaningful (i.e. associated with relevant later behavior) representations within both univariate and multivariate measures of similarity. This highlights the importance of measuring neural responses to content characteristics at different levels of representation. Although multiple other studies have shown mean-level predictions of behavior (Cooper et al., 2015; Falk et al., 2010; Falk et al., 2011), our current results extend these findings by specifying the types of information contained in messaging which are most strongly associated with later behavior change. More broadly, this work also illustrates the role of content representation in decision-making. In other words, our findings highlight the importance of using methods that consider content-specific responses in understanding how the brain makes important, real-world decisions. Furthermore, these results highlight the fact that the underlying assumption that people share common neural representations during an event on average may obfuscate the fact that it is exactly the differences in content representation across individuals that may contain important information related to behavior change. Task-relevant information may be recruited by MPFC on a subject-specific basis for motivating future behavior, and neural models of behavior change should use methods that take this into account.
Why might valence be represented in MPFC at the univariate level and social/health information at the multivariate level of representation? It may be the case that valence is a more fundamental property related to the evaluation of stimuli, and many studies have shown that MPFC activity scales with stimulus value (Bartra, McGuire, & Kable, 2013). Types of content (e.g. social vs. health information), however, may be less associated with evaluation per se, but this content-specific information may still be located in these regions as a way to inform motivation and action. Other studies have shown a univariate/multivariate distinction between the value of a stimuli (represented by overall MPFC activity) and the stimulus type (represented by multivariate patterns) (Mcnamee, Rangel, & O’Doherty, 2013; Pegors, Kable, Chatterjee, & Epstein, 2015). Our results similarly inform different ways in which different stimulus dimensions might be represented in MPFC.
4.5 - Conclusions
The same stimulus properties (e.g., negative health information) may be more or less strongly represented in brain regions that compute self-relevance. Our results demonstrate the importance of taking into account individual differences in neural representations of specific content attributes. Furthermore, even at the same strength of representation, different stimulus properties may be differentially associated with action (i.e., behavior change) depending on social context. As such, the current findings shed new light on how stimulus properties and social context variables predict effects of persuasive messaging on behavior change, and open up new avenues for research on real-world decision making.
Supplementary Material
Highlights.
Differences in neural representations of message content predict later behavior
Strong neural representations of valence in MPFC reduce later smoking behavior
Subjects’ social network moderates influence of social representations on behavior
Brain representations and social network analysis advance behavioral insight
Acknowledgments
We acknowledge important contributions to the development of this study from Richard Gonzalez, Sonya Dal Cin, Victor Strecher, Kenneth Michael Cummings, Lawrence An, Matthias Kirch, Michele Demers, Sarah Lillie, Darla Williams, Monte Montgomery at the University of Michigan and Anthony Brown, Seshadri Srinivasa, and Paula Celestino from the New York State Smokers’ Quit Line. We thank Francis Tinney Jr., Kristin Shumaker, Li Chen, Nicolette Gregor, Becky Lau, Larissa S Svintsitski, Cole Schaffer for assistance with data collection, J.P. Obley for assistance with code to collect social network data, Joe Bayer for helpful conversations related to social network data, and Nicole Cooper for insightful comments on the methods and results.
Funding:
Data collection for this project was supported by The Michigan Center of Excellence in Cancer Communication Research through the National Institutes of Health NIH-P50 CA101451; data collection and analysis was supported by the National Institutes of Health NIH 1DP2DA03515601 and by a pilot grant made possible by the National Cancer Institute of the National Institutes of Health and the FDA Center for Tobacco Products (CTP) P50CA179546. We also wish to acknowledge support from support from the Army Research Laboratory through contract number W911NF-10-2-0022, a DARPA Young Faculty Award YFAD14AP00048 and Hope Lab.
Footnotes
37 subjects were the same as those used in Cooper et al. 2015 – the groups were slightly different due to differing motion and data quality in the separate scan tasks analyzed.
The web application asked participants to allow our Facebook application to briefly access their Facebook account to make the process of creating the list of friends they had interacted with on Facebook less onerous. For those who allowed this access the most recent 20 people they had interacted with on was automatically added to the list of individuals in their social network. For participants who did not provide access to their Facebook account, they were asked to self-report previous Facebook interactions.
Rather than voxels, vertices are the units used in surface-space.
Spearman correlations are used so that a linear match between two matrices does not need to be assumed (Kriegeskorte et al. 2008)
Publisher's Disclaimer: This is a PDF file of an unedited manuscript that has been accepted for publication. As a service to our customers we are providing this early version of the manuscript. The manuscript will undergo copyediting, typesetting, and review of the resulting proof before it is published in its final citable form. Please note that during the production process errors may be discovered which could affect the content, and all legal disclaimers that apply to the journal pertain.
References
- Amodio DM, Frith CD. Meeting of minds: the medial frontal cortex and social cognition. Nature Reviews Neuroscience. 2006;7(4):268–277. doi: 10.1038/nrn1884. http://doi.org/10.1038/nrn1884. [DOI] [PubMed] [Google Scholar]
- Anderson NH. Likableness ratings of 555 personality-trait words. J Pers Soc Psychol. 1968;9(3):272–279. doi: 10.1037/h0025907. [DOI] [PubMed] [Google Scholar]
- Bartra O, McGuire JT, Kable JW. The valuation system: a coordinate-based meta-analysis of BOLD fMRI experiments examining neural correlates of subjective value. NeuroImage. 2013;76:412–27. doi: 10.1016/j.neuroimage.2013.02.063. http://doi.org/10.1016/j.neuroimage.2013.02.063. [DOI] [PMC free article] [PubMed] [Google Scholar]
- Becker MH. The Health Belief Model and Sick Role Behavior. Health Education & Behavior. 1974;2(4):409–419. [Google Scholar]
- Berkman ET, Falk EB. Beyond brain mapping: Using the brain to predict real-world outcomes. Current Directions in Psychological Science. 2013;22(1):45–55. doi: 10.1177/0963721412469394. [DOI] [PMC free article] [PubMed] [Google Scholar]
- Chavez RS, Heatherton TF. Representational Similarity of Social and Valence Information in the Medial pFC. Journal of Cognitive Neuroscience. 2014;27(1):73–82. doi: 10.1162/jocn_a_00697. http://doi.org/10.1162/jocn. [DOI] [PMC free article] [PubMed] [Google Scholar]
- Christakis Na, Fowler JH. The spread of obesity in a large social network over 32 years. The New England Journal of Medicine. 2007;357(4):370–9. doi: 10.1056/NEJMsa066082. http://doi.org/10.1056/NEJMsa066082. [DOI] [PubMed] [Google Scholar]
- Chua HF, Ho SS, Jasinska AJ, Polk TA, Welsh RC, Liberzon I, Strecher VJ. Self-related neural response to tailored smoking-cessation messages predicts quitting. Nat Neurosci. 2011;14(4):426–427. doi: 10.1038/nn.2761. http://doi.org/nn.2761 [pii]10.1038/nn.2761. [DOI] [PMC free article] [PubMed] [Google Scholar]
- Chua HF, Ho SS, Jasinska AJ, Polk Ta, Welsh RC, Liberzon I, Strecher VJ. Self-related neural response to tailored smoking-cessation messages predicts quitting. Nature Neuroscience. 2011;14(4):426–427. doi: 10.1038/nn.2761. http://doi.org/10.1038/nn.2761. [DOI] [PMC free article] [PubMed] [Google Scholar]
- Cialdini RB, Demaine LJ, Sagarin BJ, Barrett DW, Rhoads K, Winter PL. Managing social norms for persuasive impact. Social Influence. 2006;1(1):3–15. http://doi.org/10.1080/15534510500181459. [Google Scholar]
- Cooper N, Tompson S, O’Donnell MB, Falk EB. Brain Activity inSelf- and Value-Related Regions in Response to Online Antismoking Messages Predicts Behavior Change. Journal of Media Psychology. 2015;27(3):93–109. doi: 10.1027/1864-1105/a000146. http://doi.org/10.1027/1864-1105/a000146. [DOI] [PMC free article] [PubMed] [Google Scholar]
- Denny BT, Kober H, Wager TD, Ochsner KN. A Meta-analysis of Functional Neuroimaging Studies of Self- and Other Judgments Reveals a Spatial Gradient for Mentalizing in Medial Prefrontal Cortex. Journal of Cognitive Neuroscience. 2012;24(8):1742–1752. doi: 10.1162/jocn_a_00233. http://doi.org/10.1162/jocn_a_00233. [DOI] [PMC free article] [PubMed] [Google Scholar]
- Earl A, Albarracín D. Nature, Decay, and Spiraling of the Effects of Fear-Inducing Arguments and HIV Counseling and Testing: A Meta-Analysis of the Short- and Long-Term Outcomes of HIV-Prevention Interventions. Health Psychology. 2009;26(4):496–506. doi: 10.1037/0278-6133.26.4.496. http://doi.org/10.1037/0278-6133.26.4.496.Nature. [DOI] [PMC free article] [PubMed] [Google Scholar]
- Etter JF, Vu Duc T, Perneger TV. Saliva cotinine levels in smokers and nonsmokers. American Journal of Epidemiology. 2000;151(3):251–258. doi: 10.1093/oxfordjournals.aje.a010200. http://doi.org/10.1093/oxfordjournals.aje.a010200. [DOI] [PubMed] [Google Scholar]
- Falk EB, Berkman ET, Mann T, Harrison B, Lieberman MD. Predicting persuasion-induced behavior change from the brain. Journal of Neuroscience. 2010;30(25):8421–8424. doi: 10.1523/JNEUROSCI.0063-10.2010. http://doi.org/10.1523/JNEUROSCI.0063-10.2010. [DOI] [PMC free article] [PubMed] [Google Scholar]
- Falk EB, Berkman ET, Whalen D, Lieberman MD. Neural activity during health messaging predicts reductions in smoking above and beyond self-report. Health Psychol. 2011;30(2):177–185. doi: 10.1037/a0022259. http://doi.org/10.1037/a0022259. [DOI] [PMC free article] [PubMed] [Google Scholar]
- Falk E, O’Donnel M, Tompson S, Gonzalez R, Cin S, Strecher V, … An L. Functional brain imaging predicts public health campaign success. Social Cognitive and Affective Neuroscience. 2015:1–11. doi: 10.1093/scan/nsv108. e-ahead of. http://doi.org/10.1093/scan/nsv108. [DOI] [PMC free article] [PubMed]
- Greve DN, Fischl B. Accurate and robust brain image alignment using boundary-based registration. NeuroImage. 2009;48(1):63–72. doi: 10.1016/j.neuroimage.2009.06.060. http://doi.org/10.1016/j.neuroimage.2009.06.060. [DOI] [PMC free article] [PubMed] [Google Scholar]
- Hammond D. Health warning messages on tobacco products: a review. Tobacco Control. 2011;20(5):327–37. doi: 10.1136/tc.2010.037630. http://doi.org/10.1136/tc.2010.037630. [DOI] [PubMed] [Google Scholar]
- Jasinska AJ, Chua HF, Ho SS, Polk TA, Rozek LS, Strecher VJ. Amygdala response to smoking-cessation messages mediates the effects of serotonin transporter gene variation on quitting. NeuroImage. 2012;60(1):766–73. doi: 10.1016/j.neuroimage.2011.12.064. http://doi.org/10.1016/j.neuroimage.2011.12.064. [DOI] [PMC free article] [PubMed] [Google Scholar]
- Jenkinson M, Beckmann CF, Behrens TEJ, Woolrich MW, Smith SM. FSL. NeuroImage. 2012;62(2):782–90. doi: 10.1016/j.neuroimage.2011.09.015. http://doi.org/10.1016/j.neuroimage.2011.09.015. [DOI] [PubMed] [Google Scholar]
- Kahnt T, Heinzle J, Park SQ, Haynes JD. The neural code of reward anticipation in human orbitofrontal cortex. Proceedings of the National Academy of Sciences of the United States of America. 2010;107(13):6010–5. doi: 10.1073/pnas.0912838107. http://doi.org/10.1073/pnas.0912838107. [DOI] [PMC free article] [PubMed] [Google Scholar]
- Kennerley SW, Behrens TEJ, Wallis JD. Double dissociation of value computations in orbitofrontal and anterior cingulate neurons. Nature Neuroscience. 2011;14(12):1581–9. doi: 10.1038/nn.2961. http://doi.org/10.1038/nn.2961. [DOI] [PMC free article] [PubMed] [Google Scholar]
- Klebanoff Ma, Levine RJ, Clemens JD, DerSimonian R, Wilkins DG. Serum cotinine concentration and self-reported smoking during pregnancy. American Journal of Epidemiology. 1998;148(3):259–262. doi: 10.1093/oxfordjournals.aje.a009633. [DOI] [PubMed] [Google Scholar]
- Kriegeskorte N, Mur M, Bandettini P. Representational similarity analysis - connecting the branches of systems neuroscience. Frontiers in Systems Neuroscience. 2008;2(November):4. doi: 10.3389/neuro.06.004.2008. http://doi.org/10.3389/neuro.06.004.2008. [DOI] [PMC free article] [PubMed] [Google Scholar]
- Marsden PV. Egocentric and sociocentric measures of network centrality. Social Networks. 2002;24(4):407–422. [Google Scholar]
- Mcnamee D, Rangel A, O’Doherty JP. Category-dependent and category-independent goal-value codes in human ventromedial prefrontal cortex. Nature Neuroscience. 2013;16(4):479–85. doi: 10.1038/nn.3337. http://doi.org/10.1038/nn.3337. [DOI] [PMC free article] [PubMed] [Google Scholar]
- Mead EL, Rimal RN, Ferrence R, Cohen JE. Understanding the sources of normative influence on behavior: The example of tobacco. Social Science & Medicine. 2014;115(0):139–143. doi: 10.1016/j.socscimed.2014.05.030. http://doi.org/10.1016/j.micinf.2011.07.011.Innate. [DOI] [PMC free article] [PubMed] [Google Scholar]
- Mumford Ja, Turner BO, Ashby FG, Poldrack Ra. Deconvolving BOLD activation in event-related designs for multivoxel pattern classification analyses. NeuroImage. 2012;59(3):2636–43. doi: 10.1016/j.neuroimage.2011.08.076. http://doi.org/10.1016/j.neuroimage.2011.08.076. [DOI] [PMC free article] [PubMed] [Google Scholar]
- Mur M, Bandettini PA, Kriegeskorte N. Revealing representational content with pattern-information fMRI--an introductory guide. Soc Cogn Affect Neurosci. 2009;4(1):101–109. doi: 10.1093/scan/nsn044. http://doi.org/nsn044 [pii]10.1093/scan/nsn044. [DOI] [PMC free article] [PubMed] [Google Scholar]
- Nili H, Wingfield C, Walther A, Su L, Marslen-Wilson W, Kriegeskorte N. A toolbox for representational similarity analysis. PLoS Computational Biology. 2014;10(4):e1003553. doi: 10.1371/journal.pcbi.1003553. http://doi.org/10.1371/journal.pcbi.1003553. [DOI] [PMC free article] [PubMed] [Google Scholar]
- Northoff G, Heinzel A, de Greck M, Bermpohl F, Dobrowolny H, Panksepp J. Self-referential processing in our brain—A meta-analysis of imaging studies on the self. NeuroImage. 2006;31(1):440–457. doi: 10.1016/j.neuroimage.2005.12.002. http://doi.org/10.1016/j.neuroimage.2005.12.002. [DOI] [PubMed] [Google Scholar]
- O’Donnell MB, Falk EB. Big Data under the Microscope and Brains in Social Context: Integrating Methods from Computational Social Science and Neuroscience. The ANNALS of the American Academy of Political and Social Science. 2015;659(1):274–289. http://doi.org/10.1177/0002716215569446. [Google Scholar]
- Padoa-Schioppa C. Range-adapting representation of economic value in the orbitofrontal cortex. The Journal of Neuroscience: The Official Journal of the Society for Neuroscience. 2009;29(44):14004–14. doi: 10.1523/JNEUROSCI.3751-09.2009. http://doi.org/10.1523/JNEUROSCI.3751-09.2009. [DOI] [PMC free article] [PubMed] [Google Scholar]
- Pegors TK, Kable JW, Chatterjee A, Epstein RA. Common and Unique Representations in pFC for Face and Place Attractiveness. Journal of Cognitive Neuroscience. 2015;27(5):959–973. doi: 10.1162/jocn_a_00777. http://doi.org/10.1162/jocn. [DOI] [PMC free article] [PubMed] [Google Scholar]
- Peters GJY, Ruiter RaC, Kok G. Threatening communication: a critical re-analysis and a revised meta-analytic test of fear appeal theory. Health Psychology Review. 2012;7:1–24. doi: 10.1080/17437199.2012.703527. http://doi.org/10.1080/17437199.2012.703527. [DOI] [PMC free article] [PubMed] [Google Scholar]
- Peters GJY, Ruiter RAC, Kok G. Threatening communication: a critical re-analysis and a revised meta-analytic test of fear appeal theory. Health Psychology Review. 2013;7(sup1):S8–S31. doi: 10.1080/17437199.2012.703527. http://doi.org/10.1080/17437199.2012.703527. [DOI] [PMC free article] [PubMed] [Google Scholar]
- Pickett KE, Rathouz PJ, Kasza K, Wakschlag LS, Wright R. Self-reported smoking, cotinine levels, and patterns of smoking in pregnancy. Paediatric and Perinatal Epidemiology. 2005;19(5):368–376. doi: 10.1111/j.1365-3016.2005.00660.x. [DOI] [PubMed] [Google Scholar]
- Pokorski TL, Chen WW, Bertholf RL. Use of urine cotinine to validate smoking self-reports in U.S. Navy recruits. Addictive Behaviors. 1994;19(4):451–454. doi: 10.1016/0306-4603(94)90067-1. [DOI] [PubMed] [Google Scholar]
- Rosenstock IM. The health belief model and preventive health behavior. Health Education & Behavior. 1974;2(4):354–386. [Google Scholar]
- Schmitz TW, Johnson SC. Relevance to self: A brief review and framework of neural systems underlying appraisal. Neuroscience and Biobehavioral Reviews. 2007;31(4):585–596. doi: 10.1016/j.neubiorev.2006.12.003. [DOI] [PMC free article] [PubMed] [Google Scholar]
- Tompson S, Lieberman M, Falk E. Grounding the Neuroscience of Behavior Change in the Sociocultural Context. Current Opinion in Behavioral Sciences 2015 [Google Scholar]
- Vogt TM, Selvin S, Widdowson G, Hulley SB. Expired air carbon monoxide and serum thiocyanate as objective measures of cigarette exposure. Am J Public Health. 1977;67:545–549. doi: 10.2105/ajph.67.6.545. http://doi.org/10.2105/AJPH.67.6.545. [DOI] [PMC free article] [PubMed] [Google Scholar]
- Wang AL, Ruparel K, Loughead JW, Strasser AA, Blady SJ, Lynch KG, … Langleben DD. Content Matters: Neuroimaging Investigation of Brain and Behavioral Impact of Televised Anti-Tobacco Public Service Announcements. The Journal of Neuroscience. 2013;33(17):7420–7427. doi: 10.1523/JNEUROSCI.3840-12.2013. http://doi.org/10.1523/JNEUROSCI.3840-12.2013. [DOI] [PMC free article] [PubMed] [Google Scholar]
- Witte K, Allen M. A meta-analysis of fear appeals: Implications for effective public health caampaigns. Health Education & Behavior. 2000;27(5):591–615. doi: 10.1177/109019810002700506. http://doi.org/10.1177/109019810002700506. [DOI] [PubMed] [Google Scholar]
- Witte K, Allen M. A meta-analysis of fear appeals: implications for effective public health campaigns. Health Educ Behav. 2000;27(5):591–615. doi: 10.1177/109019810002700506. [DOI] [PubMed] [Google Scholar]
Associated Data
This section collects any data citations, data availability statements, or supplementary materials included in this article.