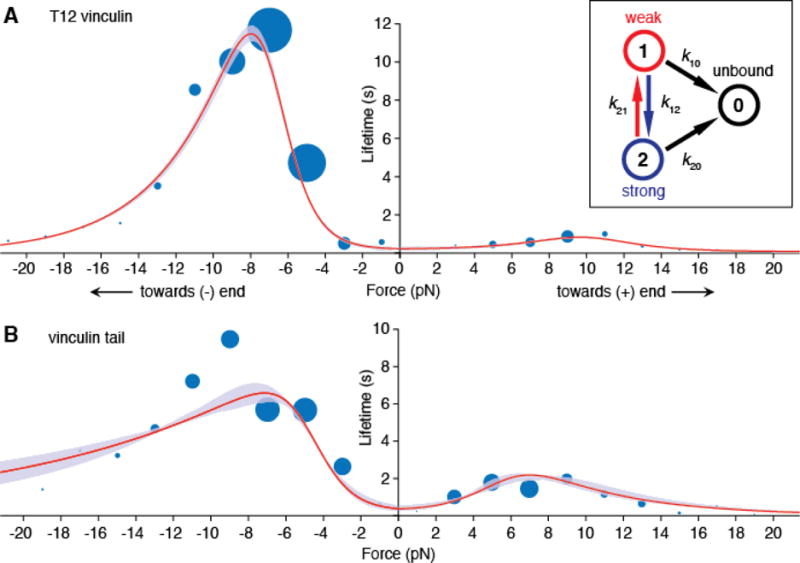
Fig. 2. A two bound-state directional catch bond model of T12 vinculin and vinculin tail (Vt) binding lifetimes.

(A) Mean actin binding lifetimes and model of best fit for T12 vinculin (n = 728) and (B) Vt (n = 702). A subset of these events are collected from filaments of known polarity, and the rest are assigned a polarity using a 2D KS test (22). In each 2 pN bin, the area of each blue circle is proportional to the number of events. Red curves show mean lifetimes predicted by the two bound-state catch bond model (inset), and purple envelopes indicate 95% confidence intervals (CIs) for the fit, obtained by parametric bootstrapping. The model was constrained to possess a mean lifetime at zero force that was less than or equal to the lifetime measured using the low-force binding assay (Fig. S1). Survival plots of the data and models are shown in Fig. S8 for T12 vinculin and Fig. S9 for Vt.
