

Abstract
The present study was aimed at studying the physico-chemical and functional properties of 31 Portuguese common bean varieties. In addition, the whole bean flours (WBF) and starch isolates (SI) of three representative bean varieties and their rice: bean blends (70:30; 50:50) were assessed for amylose content, thermal and pasting properties in view of supplementation in rice based processed foods. Bean varieties showed significant differences in protein content (20.78–27.10%), fat content (1.16–2.18%), hydration capacity (95.90–149.30%), unhydrated seeds (4.00–40.00%), γ tocopherol (3.20–98.05 mg/100 g fat), δ tocopherol (0.06–4.72 mg/100 g fat) and pasting behavior. Amylose content of WBF (11.4–20.2%) was significantly lower than rice flour (23.51%) whereas SI of beans (40.00–47.26%) had significantly higher amylose content than SI of rice (28.13%). DSC results showed that WBF (11.4–20.2 °C) had significantly broader and lower gelatinization temperature range (∆Tr) than corresponding SI (20.9–23.1 °C). WBF had significantly lower pasting viscosity due to low starch content and compositional matrix effect as compared to SI. Setback viscosities of WBF and rice: bean blends was lower than rice flour. Low setback viscosities of rice:bean blends may be used to prevent syneresis and stabilizing the quality of frozen foods in rice based processed foods.
Keywords: Bean flour, Starch isolates, DSC, Pasting behavior, Rice: bean blends
Introduction
Common beans (Phaseolus vulgaris L.) are the main legumes consumed around the world due to their high nutritional quality (Du et al. 2014). In fact, beans make a significant contribution to the human dietary protein intake and are a valuable source of bioactive compounds. Protein in the beans serve additional functions including surface activity, hydration, and hydration-related properties, structure, and certain organoleptic properties (Sathea 2002). Further recent studies suggest that dry beans are rich in tocopherols, flavonoids, polyphenols and phenolics (Sutivisedsak et al. 2011).
Apart from protein, beans are also an abundant source of starch. Beans starch (Phaselous vulgaris L) content range between 27–56% and could be utilized as a potential raw material for the production of starch (Eliasson 1996; Patterson et al. 2010). Bean starches exhibit different properties than cereal starches, could be used as tailored food additive after chemical, biochemical and fermentation techniques while their supplementation into cereals could yield new nutritional formulations. Several authors have given importance to starch and its properties in various bean varieties (Chung et al. 2008). Amylose content, amylose/amylopectin ratio, molecular weight and relative distribution of amylose and amylopectin can also influence gels viscosities profiles as it may result in a variation in the swelling power and solubility of starches thus increasing pasting profile values (Wani et al. 2013). Food quality could be improved by exploiting starch characteristics such as swelling power and solubility pattern, pasting behavior, physico-chemical and functional properties (Shimelis et al. 2006).
Bean starch has been used as a substitute of cereal starch in order to improve the nutritional properties, taste and texture and extend its use in soups, stews, frozen entrees, dried snack mixtures and gluten free dough mixtures (Patterson et al. 2010). Substitution of cereals with beans requires evaluation, considering their impact on gelatinization, viscosity and water and fat adsorption (Du et al. 2014). Moreover, antioxidants present in dry beans such as flavonoids are heat resistant and could survive extreme processing conditions helping in nutritional enhancement as well (Wang 2013).
This study determined the physico-chemical properties, tocopherol content and pasting behavior of Portuguese common bean varieties. Thermal properties and pasting behavior of rice: bean blends of whole flour and starch isolates were evaluated. This information could be used for development of value added products utilizing composite blends of rice: bean, thereby, improving food applications of common bean flours and starches.
Materials and methods
Materials
A collection of 31 Portuguese common bean landraces classified by color, shape and size traits (Table 1) were procured from ESAC (Agrarian School of Coimbra) and rice flour from Gladio variety (Indica type, 25% amylose) from local market. Whole beans were milled with a Falling number 3100 mill (Perten Sweeden) using 0.8 mm screen to obtain whole bean flours.
Table 1.
Physical and tocopherol content of 31 Portuguese common bean varieties
| Variety | Color | Size | Shape | γ Tocopherol (mg/100 g) | δ Tocopherol (mg/100 g) |
|---|---|---|---|---|---|
| Moleiro | Brown | Medium | Oval | 49.06 ± 2.2 | 2.67 ± 0.03 |
| 4038 | Pinto (cream and dark red) | Large | Kidney | 38.51 ± 7.8 | 2.37 ± 0.3 |
| 4070 | Dark red | Medium | Kidney | 34.08 ± 4.5 | 1.44 ± 0.3 |
| 4071 | Pinto (light cream and red) | Large | Kidney | 51.08 ± 6.9 | 1.94 ± 0.2 |
| 4081 | Cream | Medium | Kidney | 40.66 ± 2.6 | 2.44 ± 0.2 |
| 4085-Pinto | Pinto (brown and red) | Large | Kidney | 41.03 ± 4.2 | 2.87 ± 0.4 |
| 4088 | White | Medium | Kidney | 18.31 ± 4.3 | 1.9 ± 0.9 |
| 4097 | Pinto (light cream and red) | Medium | Oval | 41.36 ± 35.1 | 1.78 ± 0.9 |
| 4110 | Cream | Large | Kidney | 24.26 ± 12.7 | 0.86 ± 1.3 |
| 4120 | Dark red | Large | Kidney | 27.57 ± 2.5 | 1.41 ± 0.3 |
| 4135 | White | Medium | Kidney | 68.5 ± 5.8 | 3.21 ± 0.2 |
| 4144 | White | Medium | Oval | 44.96 ± 11.8 | 4.14 ± 0.2 |
| 4149-Red | Dark red | Large | Oval | 15.57 ± 2.6 | 0.91 ± 0.2 |
| 4179-Brown | Brown | Medium | Oval | 51.14 ± 11.6 | 1.11 ± 0.4 |
| 4182-Brown | Cream | Medium | kidney | 98.06 ± 2.7 | 3.61 ± 0.5 |
| 4182-Pinto | Pinto (dark brown) | Medium | Round | 12.53 ± 3.4 | 2.78 ± 0.6 |
| 4185 | Pinto (dark red and white) | Large | Oval | 19.02 ± 9.6 | 1.22 ± 0.3 |
| 4189 | Pinto (white and light brown) | Medium | Round | 3.20 ± 0.2 | 0.06 ± 0.1 |
| 4194 | Pinto (light cream and red) | Large | Kidney | 31.59 ± 7.2 | 2.37 ± 0.2 |
| 5249 | White | Medium | Kidney | 64.19 ± 23.2 | 4.72 ± 0.6 |
| Patalar | White | Large | Kidney | 49.21 ± 3.9 | 2.92 ± 0.0 |
| GC-2 | Dark red | Large | Kidney | 25.05 ± 13.8 | 2.48 ± 0.6 |
| GC-6 | White | Medium | Kidney | 23.46 ± 12.1 | 1.07 ± 0.9 |
| GC-22 | Pinto (light red and dark brown) | Large | Kidney | 17.31 ± 2.9 | 1.37 ± 0.1 |
| GC-34 | Cream | Medium | Kidney | 26.73 ± 12.3 | 1.61 ± 0.1 |
| GC-35 | Light cream | Large | Kidney | 22.54 ± 17.8 | 3.21 ± 1.3 |
| GC-40 | Pinto (light cream and red) | Large | Kidney | 32.57 ± 4.3 | 1.22 ± 0.1 |
| GC-41 | Dark red | Medium | Kidney | 22.89 ± 13 | 1.34 ± 0.4 |
| GC-44 | Pinto (light cream and red) | Large | Kidney | 54.28 ± 17.5 | 3.40 ± 0.6 |
| GC-45 | Pinto (cream and dark red) | Medium | Oval | 50.86 ± 6.7 | 1.41 ± 0.0 |
| Tarrestre | Cream, brown, black | Medium | Kidney | 14.67 ± 0.6 | 2.60 ± 0.01 |
Methods
Morphometry
Dry seeds were thoroughly cleaned to avoid any alteration in the micromorphological features and examined for diagnostic features such as shape, color and size. Vernier caliper was used to measure seed length and width. About 10 seeds were examined for dimensional details (Gandhi et al. 2011).
Hydration capacity, protein and fat content
Water hydration capacity (HC) and percentages of unhydrated seeds (US) were determined by AACC 56-35.01 method. Protein content (nitrogen × 6.25 in dry basis) was determined by Kjeldhal method by ISO 20483:2006 Total fat content was determined using Soxhlet according to Approved Method 30-25 (Soxhlet, Foss Tecator, Hillerϕd) (AACC International 1999), using the diethyl ether as extraction solvent.
Tocopherols (γ and δ) content
Tocopherols (γ, δ) were separated by HPLC (High Performance Liquid Chromatography) and the extract was prepared according to Holse et al. (2010), with little modification. Whole bean flour was extracted with hexane (1 g/30 mL) by placing the extract in an ultrasonic bath for 10 min, then in centrifuge at 4000 rpm for 5 min. The supernatant was evaporated and dissolved in 1500μl of heptane. The quantification of tocopherols was performed according to ISO 9936:2006 in an Agilent model with fluorescence detector (FLD) and a Diol column (LiChropher 100, 250 × 4 mm) with mobile phase of n-heptane:t-butyl methyl ether (93:7 v/v), flow rate 1.0 mL/min. The tocopherols data were expressed as mg/Kg fat basis.
Starch isolation
Starch was isolated from whole bean and rice flours according to method described by Piecyk et al. (2013) with minor modifications; a sieve of 150 µm was used instead of 125 µm to pass the slurry and the final residue was dried in the oven at 40 °C over night, milled and passed through a 90 µm sieve.
Pasting profiles
The pasting properties of whole bean flours were analyzed by Rapid Visco-Analyser (RVA-4, Newport Scientific, Warriewood, Australia) according to AACC method 76-21. Whole bean flours of three selected varieties, Moleiro (MWF), Patalar (PWF) and Tarrestre (TWF) and with their supplementation levels of 30% (MWF30, PWF30, TWF30) and 50% (MWF50, PWF50, TWF50) in rice flour (RF) were assessed for pasting profiles. Starch isolates of Moleiro (MSI), Patalar (PSI) and Tarrestre (TSI) were also assessed for their pasting profiles supplemented at 30% (MSI30, PSI30, TSI30) and 50% (MSI50, PSI50, TSI50) in rice starch isolate (RSI).
Differential scanning calorimetry (DSC)
Amylose content (AC) and thermal properties
Thermal properties and amylose content in RF, MWF, PWF, TWF and RSI, MSI, PSI, TSI with their supplementation in rice flour (RF) and rice starch isolate (RSI) at 30% (MWF50, PWF50, TWF50, MSI30, PSI30, TSI30) and 50% (MWF50, PWF50, TWF50, MSI30, PSI30, TSI30) were analyzed using DSC (TA instrument Q200) following Sievert and Lausanne (1993) method. The flour is heated in the presence of L-α-lysophosphatidylcholine (LPC), cooled and then reheated showing the melting of the amylose-LPC complexes. Samples were prepared with a 3% LPC solution which was added to the flour in a ratio of 1:5 (w/w) and stabilized at room temperature during 15 min. The DSC analysis was performed using aluminum hermetic pans with an empty pan as reference. Samples were heated from 30 to 140 °C (heating rate 20 °C/min, first heating stage), cooled to 4 °C (cooling rate 20 °C/min) and reheated (heating rate 20 °C/min, second heating stage). The first heating stage transition temperatures reported are the onset (To), peak (Tp) and conclusion (Tc). The enthalpy change (ΔH) expressed in terms of Joules per gram (J/g) that is observed during reheating phase is related with the amylose- LPC complex present in the sample. The amylose content, expressed as mass basis percentage was obtained by referring the enthalpies (ΔH) to the standard curve, prepared using potato amylose/amylopectin (Sigma Aldrich Co. St. Louis, USA) mixtures.
Statistical analysis
Analytical determinations were done in triplicate and means, range and standard deviations were reported. Principal Components Analysis (PCA) was performed on the data results of 31 Portuguese bean landraces considering P = 0.05. The three traditional landraces (Moleiro, Patalar and Tarrestre) evaluations were compared by analysis of variance (one way ANOVA) and the mean separations were performed by Duncan test (P < 0.05). Data analyses were performed by IBM(R) SPSS (R) Statistics, version 20.
Results and discussion
The color, size and shape of whole seeds of 31 bean landraces are listed in Table 1. Whole beans were characterized by range of colors. It was inferred that if the seed is oval shaped, there is 71% of the chance for the seed to be medium sized. However, with kidney shape, there was only 54% chances for the grain to be large sized. Similar results for physical characteristics were observed by Rodiño et al. (2001), they also confirmed that Portuguese common bean has high degree of diversity maintained within its landraces.
Protein content ranged from 20.78 to 27.10% (Data not shown). Mean protein content (23.9%) was comparable to the results of Boye et al. (2010) and Piecyk et al. (2012) for beans, peas and lentils. Earlier 1.6% fat in most of the P. vulgaris varieties was reported, which was similar to the results of this study. Different landraces of beans show non-significant differences in fat content (1.5–2.0%) (Piecyk et al. 2012). The range of HC was 95.9% to 149.0% with an average value of 127%, higher than quoted in literature (Zamindar et al. 2013). However, US (15.66%) was comparable to the values found by Shimelis and Rakshit (2005). Cotyledons or coat affect water uptake, acting as a barrier to water adsorption (Ross et al. 2010). The range of γ tocopherol (mg/100 g) and δ tocopherol (mg/100 g) content for different landraces is depicted in Table 1. The values are lower than ones found in literature (Sutivisedsak et al. 2011), which could be attributable to different extraction and quantification methods, environmental and genetic influences.
Two tailed Pearson correlations suggested that HC was significantly positive and negatively related to protein (0.973, p > 0.01) and fat content (− 0.954, p > 0.01), respectively. HC has been associated with compositional parameters like fat, protein, total phenolics and antioxidant activity (Ross et al. 2010). Physical parameters such as color, shape and size had non-significant relationship with tocopherols. However, both tocopherols strongly correlated with each other (0.591, p > 0.01).
Positive correlation between peak viscosity and protein content (0.908, p > 0.01) was observed and GC-45, 4110 and Patalar showed maximum viscosity near 1000 cP (data not shown). Lipids exert a lubricating effect on starch systems and was confirmed by the negative correlation between peak viscosity and fat content (− 0.891, p > 0.01). Shevkani et al. (2014a), reported this lowering of peak viscosity due to lipids in different fractions of milling corn.
The 31 common bean landraces showed promising results concerning their nutritional composition, however, Portuguese traditional rural habits and consumer acceptance affects cultivation of bean varieties. Of the 31 landraces 3 most important (Moleiro, Patalar and Tarrestre) were selected and studied for their nutritional composition and functional properties (Table 2) for use as a supplement in rice based foods both as whole flours and starch isolates.
Table 2.
Hydration capacity, unhydrated seeds, protein, fat and tocopherol content of three Portuguese common bean varieties (Mean ± SD)
| Parmeters | Moleiro | Patalar | Tarrestre |
|---|---|---|---|
| Hydration capacity (HC) (mL/g) | 95.90 ± 3.30 b | 120.70 ± 0.20 a | 100.90 ± 2.40 b |
| Unhydrated seeds (US) (mL/g) | 8.00 ± 4.00 a | 12.50 ± 3.50 a | 12.50 ± 0.50 a |
| Amylose content (AC) (whole flour, %) | 11.50 ± 1.03 b | 15.07 ± 0.81 a | 11.83 ± 0.27 b |
| Amylose content (AC) (starch isolate, %) | 40.00 ± 0.3 c | 44.37 ± 0.64 b | 47.26 ± 1.01 a |
| Protein (%) | 24.70 ± 0.1 a | 20.80 ± 1.7 c | 22.58 ± 0.7 b |
| Fat (%) | 1.60 ± 0.2 b | 2.10 ± 0.7 a | 1.90 ± 0.3 a |
| γ-Tocopherol (mg/100 g) | 49.06 ± 2.24 a | 49.21 ± 3.85 a | 14.67 ± 0.56 b |
| δ-Tocopherol (mg/100 g) | 2.67 ± 0.03 a | 2.92 ± 0.0 a | 2.60 ± 0.01 a |
Means followed by the same letter, within the same column, are not significantly different at P < 0.05, n = 3
Results presented in Table 2 indicated Moleiro, Patalar and Tarrestre are significantly different in terms of HC, AC (whole flour & starch isolate), protein content and fat content. Tarrestre had significantly lower γ-Tocopherol (14.67 mg/100 g) else, no statistical significant difference in tocopherol content of the beans was observed. The analysis of whole flours of Moleiro and Tarrestre revealed statistically similar pasting profile (peak, trough and final viscosities Table 4, Fig. 1). Whole flour and starch from Patalar had the higher viscosity. Results were in the range obtained by Wang and Ratnayake (2014) for five Great Northern beans starches. The lowest breakdown value of common beans flours showed their thermal stability and lower tendency to retrograde (Li et al. 2011).
Table 4.
RVA pasting parameters from flour and starch bean-rice mixtures of three common beans varieties (Mean ± SD)
| Sample | Peak (cP) | Trough (cP) | Breakdown (cP) | Final Visc (cP) | Setback (cP) | Samplejl | Peak (cP) | Trough (cP) | Breakdown (cP) | Final Visc. (cP) | Setback (cP) |
|---|---|---|---|---|---|---|---|---|---|---|---|
| RF | 2940 ± 10.0 a | 2140 ± 30.0 a | 800 ± 30.0 a | 4330 ± 20.0 a | 2190 ± 0.04 a | RSI | 2510 ± 20.0 ef | 1350 ± 20.0 de | 1160 ± 30.0 cd | 3480 ± 50.0 d | 2130 ± 60.0 b |
| MWF | 540 ± 30.0 g | 510 ± 20.0 g | 30 ± 10.0 d | 0790 ± 30.0 g | 290 ± 0.02 e | MSI | 3400 ± 40.0 c | 2290 ± 40.0 b | 1110 ± 30.0 d | 4250 ± 60.0 c | 1960 ± 20.0 c |
| MWF30 | 1090 ± 10.0 d | 980 ± 20.0 d | 120 ± 10.0 c | 2510 ± 50.0 cd | 1530 ± 0.04 c | MSI30 | 2200 ± 20.0 g | 1300 ± 10.0 e | 890 ± 30.0 e | 3000 ± 30.0 f | 1700 ± 40.0 ef |
| MWF50 | 572 ± 10.0 g | 570 ± 10.0 g | 03 ± 0.0 d | 1710 ± 30.0 f | 1140 ± 0.03 d | MSI50 | 2120 ± 20.0 g | 1400 ± 10.0 d | 720 ± 20.0 g | 2810 ± 20.0 g | 1410 ± 30.0 g |
| PWF | 1160 ± 20.0 c | 1120 ± 20.0 c | 40 ± 0.0 d | 2100 ± 110.0 e | 0980 ± 0.15 d | PSI | 3930 ± 50.0 a | 2280 ± 30.0 b | 1650 ± 20.0 a | 4830 ± 70.0 b | 2555 ± 60.0 a |
| PWF30 | 1420 ± 10.0 b | 1230 ± 10.0 b | 190 ± 0.0 b | 3050 ± 120.0 b | 1820 ± 0.12 b | PSI30 | 2560 ± 10.0 e | 1340 ± 10.0 de | 1220 ± 10.0 c | 3160 ± 80.0 e | 1820 ± 80.0 de |
| PWF50 | 930 ± 20.0 e | 910 ± 30.0 e | 30 ± 10.0 d | 2400 ± 110.0 d | 1500 ± 0.11 c | PSI50 | 2770 ± 20.0 d | 1580 ± 10.0 c | 1200 ± 0.00 c | 3180 ± 30.0 e | 1610 ± 20.0 f |
| TWF | 600 ± 50.0 g | 570 ± 40.0 g | 40 ± 10.0 d | 910 ± 20.0 g | 0350 ± 0.07 e | TSI | 3820 ± 30.0 b | 2450 ± 50.0 a | 1370 ± 40.0 b | 5050 ± 40.0 a | 2600 ± 60.0 a |
| TWF30 | 1200 ± 10.0 c | 1060 ± 10.0 c | 140 ± 10.0 c | 2720 ± 90.0 c | 1660 ± 0.08 bc | TSI30 | 2480 ± 30.0 f | 1390 ± 40.0 d | 1100 ± 10.0 d | 3230 ± 30.0 e | 1850 ± 40.0 cd |
| TWF50 | 680 ± 30.0 f | 680 ± 30.0 f | 04 ± 0.0 d | 1800 ± 80.00 f | 1120 ± 0.05 d | TSI50 | 2470 ± 20.0 f | 1650 ± 10.0 c | 810 ± 30.0 f | 3290 ± 30.0 e | 1630 ± 30.0 f |
Means followed by the same letter, within the same column, are not significantly different at P < 0.05, n = 3
Fig. 1.
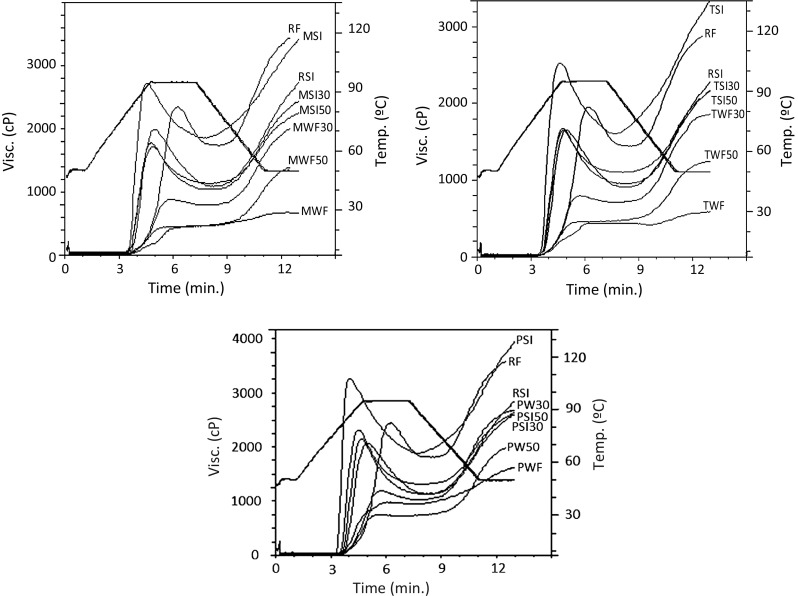
Pasting profiles of whole flours, starch isolates and rice:bean blends of Moleiro, Tarrestre and Patalar
Amylose content (AC)
Amylose content was known to play significant role in thermal and pasting profiles of flours and therefore whole flours, starch isolates and their rice:bean blends were analysed for AC. Significant differences (p < 0.05) were observed between different bean landraces in amylose content (Table 3). RF had significantly higher AC (23.51%) than whole bean flours wherein Patalar had significantly higher AC (15.07%) than Moleiro and Tarrestre. As expected, whole bean flour supplementation had a negative effect on AC of rice:bean blends.
Table 3.
Thermal properties (DSC) and amylose content in whole flour and starch isolates from three common beans varieties analyzed
| Sample | To (°C) | TP (°C) | TC (°C) | ΔTr (°C) | AC (%) | Sample | To (°C) | TP (°C) | TC (°C) | ΔTr (°C) | AC (%) |
|---|---|---|---|---|---|---|---|---|---|---|---|
| RF | 72.5 ± 0.7 c | 78.0 ± 0.2 cd | 88.6 ± 0.4 c | 16.1 ± 1.1 b | 23.51 ± 1.42 a | RSI | 72.4 ± 0.6 a | 78.0 ± 0.3 a | 88.3 ± 0.1 ab | 15.9 ± 0.6 d | 28.13 ± 0.21 f |
| MWF | 92.9 ± 0.2 a | 98.1 ± 0.7 a | 104.3 ± 0.2 b | 11.4 ± 0.3 d | 11.70 ± 1.03 e | MSI | 67.4 ± 1.9 bc | 74.6 ± 0.3 ef | 88.7 ± 0.3 ab | 21.3 ± 1.6 bc | 40.00 ± 0.13 a |
| MWF30 | 73.2 ± 0.6 bc | 79.3 ± 0.1 b | 88.6 ± 0.1 c | 15.5 ± 0.6 bc | 19.69 ± 0.51 bc | MSI30 | 69.2 ± 0.1 bc | 77.3 ± 0.1 ab | 89.5 ± 1.0 a | 20.3 ± 1.1 bc | 32.68 ± 0.63 e |
| MWF50 | 72.8 ± 0.2 c | 78.9 ± 0.2 bc | 88.7 ± 0.2 c | 15.9 ± 0.3 b | 17.51 ± 1.79 cd | MSI50 | 67.1 ± 0.4 bc | 76.4 ± 0.1 bc | 88.6 ± 0.5 ab | 21.5 ± 0.9 bc | 34.02 ± 0.53 c |
| PWF | 68.3 ± 0.9 d | 77.6 ± 0.3 d | 88.5 ± 0.3 c | 20.2 ± 0.7 a | 15.07 ± 0.81 d | PSI | 66.9 ± 0.6 c | 75.9 ± 0.7 cd | 87.8 ± 0.8 ab | 20.9 ± 1.4 bc | 44.37 ± 0.64 a |
| PWF30 | 73.1 ± 0.1 bc | 79.2 ± 0.5 b | 88.6 ± 0.3 c | 15.5 ± 0.3 bc | 21.03 ± 0.91 ab | PSI30 | 68.9 ± 0.2 bc | 76.4 ± 0.4 bc | 88.6 ± 0.8 ab | 19.7 ± 1.0 c | 33.29 ± 0.77 d |
| PWF50 | 72.9 ± 0.1 c | 79.6 ± 0.2 b | 88.3 ± 0.4 c | 15.4 ± 0.3 bc | 18.33 ± 0.99 bc | PSI50 | 67.7 ± 1.3 bc | 75.9 ± 0.3 bc | 87.7 ± 0.9 ab | 20.0 ± 1.6 bc | 35.95 ± 0.27 c |
| TWF | 93.8 ± 0.1 a | 98.1 ± 0.4 a | 108.6 ± 1.2 a | 14.8 ± 1.3 bc | 11.83 ± 0.27 e | TSI | 64.1 ± 0.2 d | 73.9 ± 1.1 f | 87.2 ± 0.4 b | 23.1 ± 0.2 ab | 47.26 ± 1.01 a |
| TWF30 | 73.1 ± 0.5 bc | 79.2 ± 0.4 b | 88.7 ± 0.3 c | 15.5 ± 0.5 bc | 19.22 ± 0.32 bc | TSI30 | 69.6 ± 1.1 b | 77.3 ± 0.3 ab | 89 ± 0.5 ab | 19.4 ± 1.0 c | 33.86 ± 1.20 d |
| TWF50 | 74.3 ± 0.3 b | 79.8 ± 0.3 b | 88.2 ± 0.1 c | 13.9 ± 0.3 c | 17.72 ± 0.36 cd | TSI50 | 62.9 ± 0.8 d | 75.8 ± 0.2 de | 88.1 ± 0.5 ab | 25.2 ± 1.3 a | 37.68 ± 0.33 b |
Means followed by the same letter, within the same row, are not significantly different at P < 0.05, n = 3
To, onset gelatinization temperature; TP, peak gelatinization temperature; TC, conclusion gelatinization temperature; ΔTr (TC − To)
However, starch isolates of beans showed significantly higher AC (> 40%) than RSI (28.13%). Bean starches were reported to have higher AC than cereal starch isolates (Singh et al. 2004; Kaur et al. 2015). AC in bean starch isolates (40.0–47.3%) was within the range reported by Kaur et al. (2015) for mung bean starch (43.4%). AC in whole flour, starch isolates and their blends tend to affect thermal and pasting properties and hence these properties and their relationship with AC was analyzed.
Thermal properties
The results of thermal properties of whole flours, starch isolates with their respective rice: bean blends are summarized in Table 3. Whole flours enclose composite chemical composition (protein, fat, starch, amylose/amylopectin ratio and minerals) and thermal profile was different than isolated starch systems. Whole flours (68.3–93.8 °C) had a higher and wider range of thermal properties such as onset gelatinization temperature (To), peak temperature (Tp) and conclusion temperature (Tc) than starch isolates (62.9–72.4 °C). To for whole flours ranged from 68.3 to 93.8 °C whereas range was narrow for starch isolates (62.9–72.4 °C). This demonstrates that properties of pure starches are different from whole system and affected by compositional and matrix effect of origin. Tp corresponds to a temperature when 50% of the starch molecules undergo thermal transition and the range varied from 77.6 to 98.1 °C and 73.9 to 78.0 °C for whole flours and starch isolates, respectively. The conclusion temperature (Tc) ranged from 88.7 to 108.6 °C in whole flour and 87.2–89.5 °C in starches. To, Tp and Tc increased with the amount of lipid-complexed amylose. AC in whole flours had significantly negative effect on To (p < 0.05), Tp (p < 0.01), and Tc (p < 0.01). High AC for Patalar flour resulted in lower Tp values than other bean flours and similar to RF and starch isolates.
Whole bean flours of Moleiro and Tarrestre showed higher temperatures (To, Tp and Tc) than starch isolates. RF and rice:bean flour blends had a non-significant difference for Tc value, indicating bean flour supplementation did not affect the overall cooking time of the supplemented mixes and was of commercial significance. Su et al. (1997) reported Tc of 78.0 and 78.4 °C for the red kidney and pinto beans, lower than present study. ΔTr value was the highest for PWF (20.2 °C) while MWF had the minimum value (11.4 °C).
The differences in To, Tp, and Tc among the bean starches reflect genetic differences such as granule size, molecular architecture of the crystalline region, and amylose/amylopectin ratio (Kaur and Singh 2005; Shevkani et al. 2011). According Shevkani et al. 2011 starches with higher enthalpy change (ΔH) exhibited higher crystallinity suggesting that PSI, MSI and TSI had higher crystallinity than RSI. To values were the highest for RSI (72.4 °C), however, MSI and PSI supplemented samples showed non-significant differences whereas TSI50 exhibited significantly different values. In starch isolate samples, supplementation levels (30 to 50%) were inversely related to To, Tp, Tc and ΔTr values. ΔTr values increased in isolated starch systems with the highest for TSI50 and MSI50 (25.2 and 21.5 °C) and the lowest for RSI (15.9 °C). This wide gelatinization temperature range suggested the presence of crystallites of varying stability within the starch crystalline domains (Singh et al. 2004). AC in starch isolate system had significantly negative correlation with To (p < 0.05) and Tp (p < 0.01). Larger starch granules tended to be more crystalline than smaller ones. The smaller granules gelatinized at higher temperature than larger granules (Chiotelli and Meste 2002). Starch granules of rice were small polygonal 3–5 μm whereas beans have oval and spherical 25.3–27.4 µm sized granules (Du et al. 2014). The higher gelatinization temperature for whole flours indicated that more energy is required to initiate gelatinization of the starch. Proteins, when present in flours, increase the gelatinization temperature (Sánchez-Arteaga et al. 2015). The legumes flour have higher protein content than rice flour, so MWF, PWF and TWF revealed higher thermal transition temperatures than blends. Protein–starch interactions require more thermal energy for disruption and melting (Liu et al. 2007). The lipid–complexed amylose chains decrease of the extent of hydration in the amorphous regions, thereby increasing the amount of thermal energy required for crystallite melting (Jayakody et al. 2005). Patalar demonstrated similar thermal transitions as that of rice (flour and starch isolate), however, supplementation of Moleiro flour and starch isolates also had significantly similar thermal transitions to rice.
Pasting properties
The pasting profiles of samples obtained from rapid visco analyzer are shown in Fig. 1. Significantly, different rheological behavior was observed, for RF, whole bean flours, rice: bean blends and respective starch isolates. Supplementation of bean flours had significant effect on peak viscosity, trough viscosity, breakdown, final viscosity and setback. Whole bean flours did not show peak and breakdown viscosities, which was consistent with the results of other studies on bean flours (Chung et al. 2008; Ai et al. 2016), and was due to the higher protein content (20.8–24.7%) of the bean flours. Proteins and lipids, as present in the whole flours, delayed the initiation of the gelatinization process when compared to isolated starch systems (Shevkani et al. 2014b, 2015). Proteins in the whole bean flours (20.8–24.7%) were in a continuous matrix, embedded starch granules, hindering their hydration and restricting the swelling of starch granules, required for viscosity development (Chung et al. 2008; Shevkani et al. 2015).
RF exhibited significantly higher peak viscosity (2940 cP) whereas peak viscosities of Moleiro, Patalar and Tarrestre were 540, 1160 and 600 cP, respectively (Table 4).
RF showed significantly higher peak and trough viscosity indicating its tendency to higher breakdown during cooking. Higher breakdown viscosity is an indicator of better palatability, in cooked rice. Rice: bean blends at 30% showed non-significant difference in their breakdown viscosities. Higher breakdown corresponds to less ability of flour to withstand heating and shear stress during cooking (Adebowale et al. 2005). The lower breakdown viscosities of MWF50 and TWF50 indicated their resistance to shearing, during heating. These lower breakdown viscosities of the blends characterized the use of supplemented flours in processing conditions of high shear and temperature, without modifying the starch systems.
Final viscosity gives a measure of the resistance of the paste to shear force during stirring (Adebowale et al. 2005). The variations in the final viscosity might be due to the simple kinetic effect of cooling on viscosity and the re-association of starch molecules in the flour samples. There was a significant difference (p < 0.05) in the final viscosity of RF, whole bean flours and blends. Rice flour had the highest value (4330 cP), while MWF had the lowest value (790 cP). This may be attributed to the hydrogen bonding during cooling and the high amylose content of the rice flour (Alais and Linden 1986). Lower final viscosity indicated the increase in stability of starch paste upon addition of bean flours. The setback viscosities of Patalar and Tarrestre were equivalent among them and higher than Moleiro (p < 0.05) starch. The low SB of whole bean flours was related with protein content of beans (Moleiro > Tarrestre > Patalar) and with its relatively low amylose content (Table 3). The positive effect of rice:bean blends on pasting profiles suggested that relatively high percentage could be incorporated into food formulations, without substantially affecting the rheological behaviour of the supplemented systems.
Pasting profiles of the bean starches (3400–3930 cP) showed higher peak viscosity in comparison with RSI (2510cP) and stated to be advantageous for their application as a thickening agent in food systems (Singh et al. 2006). High amylose starches were type B, and were less compact, creating open structure for hydration and gelatinization (Hoover et al. 2010) and probably the reason of higher peak viscosities in bean starch. Higher amylose leaching in the gelatinization temperature range and lower relative crystallinity favors granular swelling during heating (Maaran et al. 2014). Breakdown viscosity was less pronounced in bean supplemented starch isolate systems and could be due to strong interactions between inter-amylose and amylose-amylopectin chains. Different physiochemical nature of beans and rice starches might cause lack of affinity for amylose interaction, thus, lowering SB (Sandhu and Singh 2007). Higher amylose content and proportion of long branch chains in amylopectin increased starch pasting temperature and setback, and decreased peak viscosity and shear thinning (Jane et al. 1999; Park et al. 2007).
Amylose content had significantly positive relationship with all the pasting parameters for whole flour blends whereas a negative correlation was observed with BD and SB in starch isolate blends. It was interesting that supplementation of bean starch isolates into rice starch isolate reduced the setback viscosity of the sample than control samples. The lower tendencies to retrograde are advantageous in food products such as soups and sauces, which undergo loss of viscosity and precipitation. The paste formed by rice: bean blends as a result of heating was stable upon cooling which was evident by its lowest setback viscosity. This is advantageous in formulations where starch stability is required at low temperatures. It also suggested the ability of rice: bean blends to resist retrogradation and therefore form stable paste, an important property in porridges (Kaushal et al. 2012). Different sizes of starch granules hindered re ordering of amylose molecules and thus disrupting crystallization process leading to lower values of setback viscosities.
Conclusion
The low viscosity of whole bean flours suggested that those can be incorporated into food formulations without substantially increasing the viscosity and with thermal stability and lower tendency to retrograde. In counterpart, the bean starches analyzed would be suitable to increase viscosity of thermally processed foods due to high peak viscosity. In addition to the nutritional benefits derived from incorporation of bean starch in rice based products; the higher thermal stability and lower gelatinization temperatures, set-back and syneresis and stabilize quality of frozen foods can be achieved.
Acknowledgements
Authors gratefully acknowledge Prof. Pedro Moreira from Agrarian School of Coimbra, ESAC for providing the multiplication trial of bean landraces samples and Manuela Veloso from Agronomic and Veterinary Research Institute (INIAV) for three common bean varieties. The first author also acknowledges the financial support provided by the FCT-Portuguese Foundation for Science and Technology (PD/BD/128277/2017), under the Doctoral Programme “Agricultural Production Chains—from fork to farm”, “(PD/00122/2012)” and the FCT Investigator Programme (to MCVP). This work was supported by national funds from FCT-Portuguese Foundation for Science and Technology under the projects BEGEQA project (PTDC/AGR-TEC/3555/2012), UID/AGR/04033/2013, the European Commission through the FP7-SOLIBAM project (Grant Agreement no. 245058) and European Investment Funds by FEDER/COMPETE/POCI– Operational Competitiveness and Internationalization Programme, under the Project POCI-01-0145-FEDER-006958.
References
- American Association of Cereal Chemists (AACC) (1999) Approved methods of analysis. Method 30-25.01. Crude fat in wheat, corn, and soy flour, feeds, and mixed feeds, 11th edn. AACC International, St. Paul, MN, USA. 10.1094/AACCIntMethod-30-25.01
- Adebowale YA, Adeyemi IA, Oshodi AA. Functional and physicochemical properties of flours of six Mucuna species. Afr J Biotechnol. 2005;4:1461–1468. [Google Scholar]
- Ai Y, Cichy KA, Harte JB, Kelly JD, Ng PKW. Effects of extrusion cooking on the chemical composition and functional properties of dry common bean powders. Food Chem. 2016;211:538–545. doi: 10.1016/j.foodchem.2016.05.095. [DOI] [PubMed] [Google Scholar]
- Alais C, Linden G. Energy and protein intakes of infants and children from the low income group of Ibadan. Nutr Res. 1986;26:129–137. [Google Scholar]
- Boye J, Zare F, Pletch A. Pulse proteins: processing, characterization, functional properties and applications in food and feed. Food Res Int. 2010;43:414–431. doi: 10.1016/j.foodres.2009.09.003. [DOI] [Google Scholar]
- Chiotelli E, Meste ML. Effect of small and large wheatstarch granules on thermo mechanical behaviour of starch. Cereal Chem. 2002;79:286–293. doi: 10.1094/CCHEM.2002.79.2.286. [DOI] [Google Scholar]
- Chung HJ, Liu Q, Pauls KP, Fan MZ, Yada R. In vitro starch digestibility, expected glycemic index and some physicochemical properties of starch and flour from common bean (Phaseolus vulgaris L.) varieties grown in Canada. Food Res Int. 2008;41:869–875. doi: 10.1016/j.foodres.2008.03.013. [DOI] [Google Scholar]
- Du SK, Jiang H, Ai Y, Jane JL. Physicochemical properties and digestibility of common bean (Phaseolus vulgaris L.) starches. Carbohyd Polym. 2014;108:200–205. doi: 10.1016/j.carbpol.2014.03.004. [DOI] [PubMed] [Google Scholar]
- Eliasson AC. Carbohydrates in food. II. Series: food science and technology. New York: Marcel Dekker, Inc.; 1996. pp. 355–357. [Google Scholar]
- Gandhi D, Albert S, Pandya N. Morphological and micromorphological characterization of some legume seeds from Gujarat, India. Environ Expt Biol. 2011;9:105–133. [Google Scholar]
- Holse M, Husted S, Hnsen A. Chemical composition of marama bean (Tylosema esculentum)-A wild African bean with unexploited potential. J Food Compos Anal. 2010;23:648–657. doi: 10.1016/j.jfca.2010.03.006. [DOI] [Google Scholar]
- Hoover R, Hughes T, Chung H, Liu Q. Composition, molecular structure, properties, and modification of pulse starches: a review. Food Res Int. 2010;43:399–413. doi: 10.1016/j.foodres.2009.09.001. [DOI] [Google Scholar]
- Jane J, Chen YY, Lee LF, McPherson AE, Wong KS, Radosavljevic M, Kasemsuwan T. Effects of amylopectin branch chain length and amylose content on the gelatinization and pasting properties of starch. Cereal Chem. 1999;76:629–637. doi: 10.1094/CCHEM.1999.76.5.629. [DOI] [Google Scholar]
- Jayakody L, Hoover R, Liu Q, Weber E. Studies on tuber and rootstarches I. Structure and physicochemical properties of Innala (Solenostemonrotundifolius) starches grown in Sri Lanka. Food Res Int. 2005;38:615–629. doi: 10.1016/j.foodres.2004.11.015. [DOI] [Google Scholar]
- Kaur M, Singh N. Studies on functional, thermal and pasting properties of flours from different Chickpea (Cicer arietinum L.) cultivars. Food Chem. 2005;91:403–411. doi: 10.1016/j.foodchem.2004.06.015. [DOI] [Google Scholar]
- Kaur A, Shevkani K, Singh N, Sharma P, Kaur S. Effect of guar gum and xanthan gum on pasting and noodle-making properties of potato, corn and mung bean starches. J Food Sci Technol. 2015;52:8113–8121. doi: 10.1007/s13197-015-1954-5. [DOI] [PMC free article] [PubMed] [Google Scholar]
- Kaushal P, Kumar V, Sharma HK. Comparative study of physicochemical, functional, antinutritional and pasting properties of taro (Colocasia esculenta), rice (Oryza sativa) flour, pigeonpea (Cajanus cajan) flour and their blends. LWT-Food Sci Technol. 2012;48:59–68. doi: 10.1016/j.lwt.2012.02.028. [DOI] [Google Scholar]
- Li W, Shu C, Zhang P, Shen Q. Properties of starch separated from ten mung bean varieties and seeds processing characteristics. Food Bioprocess Technol. 2011;4:814–821. doi: 10.1007/s11947-010-0421-6. [DOI] [Google Scholar]
- Liu Q, Gu Z, Donner E, Tetlow I, Emes M. Investigation of digestibilityin vitro and physicochemical properties of A- and B- type starch from soft andhard wheat flour. Cereal Chem. 2007;84:15–21. doi: 10.1094/CCHEM-84-1-0015. [DOI] [Google Scholar]
- Maaran S, Hoover R, Donner E, Liu Q. Composition, structure, morphology and physicochemical properties of lablab bean, navy bean, rice bean, tepary bean, and velvet bean starches. Food Chem. 2014;9:491–499. doi: 10.1016/j.foodchem.2013.12.014. [DOI] [PubMed] [Google Scholar]
- Park IM, Ibanez AM, Zhong F, Shoemaker CF. Gelatinization and pasting properties of waxy and non-waxy rice starches. Starch. 2007;59:388–396. doi: 10.1002/star.200600570. [DOI] [Google Scholar]
- Patterson C, Maskus H, Basset C. Fortifying foods with pulses. Cereal Foods World. 2010;55:56–62. [Google Scholar]
- Piecyk M, Wolosiak R, Druzynska B, Worobiej E. Chemical composition and starch digestibility in flours from Polish processed legume seeds. Food Chem. 2012;135:1057–1064. doi: 10.1016/j.foodchem.2012.05.051. [DOI] [PubMed] [Google Scholar]
- Piecyk M, Druzynska B, Worobiej E, Wolosiak R, Ostrowska-Ligęza E. Effect of hydrothermal treatment of runner bean (Phaseolus coccineus) seeds and starch isolation on starch digestibility. Food Res Int. 2013;50:428–437. doi: 10.1016/j.foodres.2012.11.003. [DOI] [Google Scholar]
- Rodiño A, Santalla M, Montero I, Casquero P, De Ron A. Diversity of common bean (Phaseolus vulgaris L.) germoplasm from Portugal. Genet Resour Crop Ev. 2001;48:409–417. doi: 10.1023/A:1012248002436. [DOI] [Google Scholar]
- Ross K, Zhang L, Arntfield S. Understanding water uptake from the induced changes occurred during processing: chemistry of pinto and navy bean seed coats. Int J Food Prop. 2010;13:631–647. doi: 10.1080/10942910902718220. [DOI] [Google Scholar]
- Sánchez-Arteaga HM, Urías-Silvas JE, Espinosa-Andrews H, García Márquez E. Effect of chemical composition and thermal properties on the cookingquality of common beans (Phaseolus vulgaris) CyTA J Food. 2015;13:385–391. doi: 10.1080/19476337.2014.988182. [DOI] [Google Scholar]
- Sandhu K, Singh N. Some properties of corn starches II: physicochemical, gelatinization, retrogradation, pasting and gel textural properties. Food Chem. 2007;101:1499–1507. doi: 10.1016/j.foodchem.2006.01.060. [DOI] [Google Scholar]
- Sathea SK. Dry bean protein functionality. Crit Rev Biotechnol. 2002;22:175–223. doi: 10.1080/07388550290789487. [DOI] [PubMed] [Google Scholar]
- Shevkani K, Singh N, Singh S, Ahlawat AK, Singh AM. Relationship between physicochemical and rheological properties of starches from Indian wheat lines. Int J Food Sci Technol. 2011;46:2584–2590. doi: 10.1111/j.1365-2621.2011.02787.x. [DOI] [Google Scholar]
- Shevkani K, Kaur A, Singh G, Singh B, Singh N. Composition, rheological and extrusion behaviour of fractions produced by three successive reduction dry milling of corn. Food Bioprocess Technol. 2014;7:1414–1423. doi: 10.1007/s11947-013-1194-5. [DOI] [Google Scholar]
- Shevkani K, Singh N, Kaur A, Rana JC. Physicochemical, pasting, and functional properties of Amaranth seed flours: effects of lipids removal. J Food Sci. 2014;79:1271–1277. doi: 10.1111/1750-3841.12493. [DOI] [PubMed] [Google Scholar]
- Shevkani K, Kaur A, Kumar S, Singh N. Cowpea protein isolates: functional properties and application in gluten-free rice muffins. LWT Food Sci Technol. 2015;63:927–933. doi: 10.1016/j.lwt.2015.04.058. [DOI] [Google Scholar]
- Shimelis E, Rakshit S. Proximate composition and physico-chemical properties of improved dry bean (Phaseolus vulgaris L.) varieties grown in Ethiopia. LWT-Food Sci Technol. 2005;38:331–338. doi: 10.1016/j.lwt.2004.07.002. [DOI] [Google Scholar]
- Shimelis EA, Mersha Meaza M, Rakshit SK. Physico-chemical properties, pasting behavior and functional characteristics of flours and starches from improved bean (Phaseolus vulgaris L.) varieties grown in East Africa. E J Agric Eng Int. 2006;8:1–18. [Google Scholar]
- Sievert D, Lausanne J. Determination of amylose by differential scanning calorimetry. Starch. 1993;45:136–139. doi: 10.1002/star.19930450405. [DOI] [Google Scholar]
- Singh N, Sandhu KS, Kaur M. Characterization of starches separated from Indian chickpea (Cicer arietinum L.) cultivars. J Food Eng. 2004;63:441–449. doi: 10.1016/j.jfoodeng.2003.09.003. [DOI] [Google Scholar]
- Singh N, Kaur L, Sandhu KS, Kaur J, Nishinari K. Relationships between physicochemical, morphological, thermal, rheological properties of rice starches. Food Hydrocoll. 2006;20:532–542. doi: 10.1016/j.foodhyd.2005.05.003. [DOI] [Google Scholar]
- Su HS, Lu W, Chang KC. Microstructure and physicochemical characteristics of starches in six bean varieties and their bean paste products. LWT-Food Sci Technol. 1997;31(3):265–273. doi: 10.1006/fstl.1997.0350. [DOI] [Google Scholar]
- Sutivisedsak N, Moser BR, Sharma BK, Evangelista RL, Cheng HN, Lesch WC, Tangsrud RR, Biswas A. Physical properties and fatty acid profiles of oils from Black, Kidney, Great Northern, and Pinto beans. J Am Oil Chem Soc. 2011;88:193–200. doi: 10.1007/s11746-010-1669-8. [DOI] [Google Scholar]
- Wang H (2013) Studies on Phaseolus vulgaris L. Var. Great Northern bean for utilization in food processing. Master Thesis. University of Nebraska–Lincoln. Dissertations & Theses in Food Science and Technology. Paper 37. http://digitalcommons.unl.edu/foodscidiss/37
- Wang H, Ratnayake S. Physicochemical and thermal properties of Phaseolus vulgaris L. var. Great Northen bean starch. J Food Sci. 2014;79:295–300. doi: 10.1111/1750-3841.12357. [DOI] [PubMed] [Google Scholar]
- Wani I, Sogi D, Wani A, Gill B. Physico-chemical and functional properties of flours from Indian kidney bean (Phaseolus vulgaris L.) cultivars. LWT Food Sci Technol. 2013;53:278–284. doi: 10.1016/j.lwt.2013.02.006. [DOI] [Google Scholar]
- Zamindar N, Baghkhandan M, Nasirpour A, Sheikhzeinoddin M. Effect of line, soaking and cooking time on water apsorbtion, texture and splitting of red kidney beans. LWT Food Sci Technol. 2013;50:108–114. doi: 10.1007/s13197-011-0234-2. [DOI] [PMC free article] [PubMed] [Google Scholar]