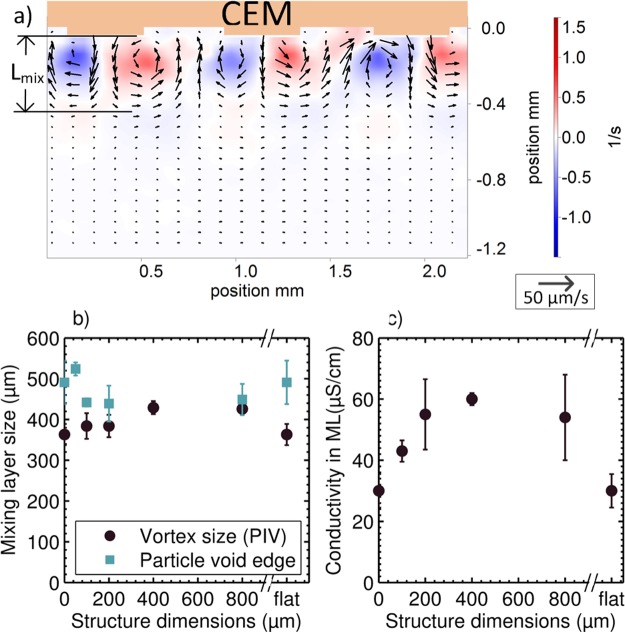
Figure 6.
(a) Steady vortices at the 400 μm are resolved with μPIV. Shown is the average motion between 700 and 710 s (100 image pairs). The vortex boundary was taken as the place where the rms velocity was 20% of the maximum. Lmix = 426 μm with vrms = 17 μm/s. The background color represents the vorticity of the vector field. Every second row of vectors is omitted for visibility. (b) ML size is determined from μPIV (as describe above) and from the edge of the particle void (by taking the horizontal average of the light intensity). (c) Conductivity within the ML is calculated as σ = Lmix/(Rsat·Amem). The ML size determined from the PIV measurements is used. The error bars in (b,c) represent the edges of the 95% confidence interval calculated from the mean values of 2 to 4 repeated measurements with the same membrane.

