

Abstract
Purpose
Individuals with Down syndrome may experience greater difficulty reliably performing visual acuity (VA) tests due to intellectual disability and limitations in visual quality. This study evaluated the repeatability of acuity (Bailey Lovie (BL) and HOTV) in subjects with and without DS.
Methods
High contrast VA was measured in both eyes of 30 subjects with Down syndrome (mean (range): 30 years (18–50)) and 24 controls without Down syndrome (mean (range): 29 years (18–50)). In the Down syndrome group, 23 subjects performed BL and 7 subjects performed HOTV. All controls performed both BL and HOTV, but for HOTV analysis only 7 age matched controls were included. For each eye, subjects performed VA 3 times on different charts (computer controlled, single line display) until 5 total letters were missed on each chart. A repeated measure ANOVA was used to compare the acuity measures between groups.
Results
The average logMAR VA for subjects with Down syndrome was ~6 lines worse than the controls [BL: Down syndrome = right eye: 0.51 ± 0.16, left eye: 0.53 ± 0.18; control = right eye: −0.06 ± 0.06, left eye: −0.06 ± 0.08, p<.0001; HOTV: Down syndrome = right eye: 0.47 ± 0.19, left eye: 0.46 ± 0.16; control: right eye = −0.11 ± 0.09, left eye: −0.07 ± 0.07, p < 0.001]. BL VA repeatability (1.96 *Sw* √2) was 0.13 logMAR (6.5 letters) for Down syndrome and 0.09 logMAR (4.5 letters) for controls. HOTV VA repeatability was 0.16 logMAR (8 letters) for both Down syndrome and control subjects.
Conclusions
Despite poorer acuity in individuals with Down syndrome, repeatability of VA measurements was comparable to controls for both BL and HOTV techniques.
Keywords: Down syndrome, visual acuity, repeatability, Bailey Lovie, HOTV
Visual acuity is the most common metric of visual performance used clinically as a screening tool to monitor ocular disease or to guide the prescription for refractive error. To utilize this metric, it is important to know the inherent variability (measurement noise) upon repeated testing. It is also important to know the variability to study the longitudinal progression of any disease state. In this study, we refer to variability as the standard deviation of repeated measurements of visual acuity for a single observer’s eye and repeatability as √2 * 1.96 times the average within subject standard deviation of the entire group of observers.
Down syndrome, or Trisomy 21, is one of the most common genetic conditions with an estimated birth prevalence in the United States of 14 per 10,000 live births1 and is associated with intellectual disability and a large number of ocular abnormalities such as high refractive error, steep corneas, increased higher order aberrations, strabismus, reduced vision, poor accommodative ability, nystagmus and cataract.2–9 Despite these challenges, a large number of individuals with Down syndrome are able to perform letter acuity testing, either through naming or matching, and thus evaluating the repeatability of the testing strategy in this population will be of use to practitioners caring for these individuals.
The Early Treatment of Diabetic Retinopathy Study (ETDRS) style10 and Bailey Lovie11 style visual acuity charts have become the gold standard and have been used for both research and clinical testing. Both styles have the same design principle (5 letters at each size, a size progression of 0.10 log unit steps, a one letter width between letter spacing and vertical spacing between rows that is equal to the height of the letters in the smaller of the two rows). The differences between the BL chart and the ETDRS chart is the choice of letters used (Bailey Lovie uses 1968 British Standard letters and ETDRS uses Sloan letters) and letter sizes (Bailey Lovie charts use 5×4 unit letters whereas ETDRS use 5×5 units). Lea Symbols12 (house, heart, circle, square) and letters (H, O, T, V)13 have also been used with a matching card to measure visual acuity in patients who are unable to name alphabet letters, and can be arranged in the same Bailey Lovie chart style with five characters per row to maintain the benefits of the Bailey Lovie chart spacing. In this study, we used Bailey Lovie style visual acuity (both British standard and HOTV) and the letter by letter scoring method (0.02 logMAR for each letter identified correctly) which is reported to have less variability and more precision than other scoring techniques.14–16
Repeatability of visual acuity using ETDRS and Bailey Lovie style charts in typically developed adults has been reported to range between ±0.07 logMAR to ±0.16 logMAR.14–20 In pediatric populations, the repeatability was reported to be ±0.15 logMAR21, 22 for both best corrected subjects12 and the better-seeing eye of uncorrected subjects,13 and ±0.25 logMAR22 for the poorer-seeing eye of uncorrected subjects. The poorer repeatability in children, even when best corrected, may be related to behavioral limitations in cooperation.
To our knowledge, repeatability of logMAR visual acuity testing has not been reported for patients with Down syndrome. Subjects with Down syndrome may be expected to have greater difficulty reliably performing visual acuity tests due to both barriers from intellectual disability and limitations in overall visual quality. This study compares repeatability of visual acuity testing in adults with Down syndrome as compared to age-matched controls for two different letter sets (either British standard or HOTV) arranged according to the design principles of the Bailey Lovie style chart.
METHODS
This study followed the tenets of the Declaration of Helsinki and was approved by the University of Houston (UH) Committee for the Protection of Human Subjects. For all subjects with Down syndrome, written parental/legal guardian permission was obtained after explaining the nature of the study in person during the time of testing, and written or verbal assent was obtained from the participants with Down syndrome. Written informed consent was obtained from all control subjects.
Individuals with Down Syndrome
Thirty-four individuals with Down syndrome were recruited from local Down syndrome organizations (e.g. Friends with Down syndrome, local Special Olympics chapters, and the Baylor College of Medicine Transition Medicine Clinic). Four subjects were excluded due to inability to perform the visual acuity task related to the severity of their intellectual disability (i.e. subjects were unable to communicate verbally and did not comprehend instructions for matching even when demonstrated at close working distances). At the time of testing, ocular alignment was assessed with distance and near cover test and examiner gross observation was used to identify the presence or absence of nystagmus both with and without occlusion of the fellow eye. Out of 30 subjects aged 18 to 50 years (mean: 28.3 ± 9.3 years) who were included, 6 subjects had nystagmus (2 latent – only manifesting upon occlusion of the fellow eye) and 10 subjects had strabismus (8 constant unilateral and 2 constant alternating) (Table 1). Three of the subjects who had nystagmus had constant unilateral strabismus. Subjects were also examined with biomicroscopy and none were found to have visually significant cataracts.
Table 1.
Subject Characteristics.
| Bailey Lovie VA | HOTV VA | |||
|---|---|---|---|---|
| Down Syndrome | Control | Down Syndrome | Control | |
| Number of Subjects | 23 | 24 | 7* | 7 |
| Number of Eyes | 46 | 48 | 12 | 14 |
| Number of Female/Number of Male | 14/10 | 17/7 | 2/5 | 4/3 |
| Age (mean ± SD) (years) | 29 ± 10 | 31 ± 10 | 30 ± 8 | 30 ± 9 |
| Age range | 18 to 50 | 20 to 50 | 22 to 45 | 22 to 45 |
| Number of subjects with Strabismus | 7 | 1 | 3 | 0 |
| Number of subjects with Nystagmus | 5 | 0 | 1 | 0 |
VA = Visual acuity, SD = Standard Deviation
One subject with nystagmus was tested binocularly with HOTV due to a significant degradation in monocular acuity secondary to a large amplitude latent component which resulted in a monocular acuity threshold larger than the range of the computerized acuity test. A second subject was also tested binocularly with HOTV due to significant resistance to occlusion.
Subjects wearing spectacles had their spectacle lens power measured with auto-lensometry. Distance autorefraction (Grand Seiko WAM-5500 RyuSyo Industrial Co., Ltd. Hiroshima, Japan) was used to measure the uncorrected refractive error of all subjects. Distance autorefraction over presenting correction was also used to assess residual refractive error for subjects presenting with spectacles. No subjects with Down syndrome presented with contact lens corrections. A pre-test monocular acuity threshold was obtained with the M&S SmartSystem (M&S Technologies, Inc. Niles, IL), either using distance Snellen or HOTV letters, prior to the formal acuity assessments with logMAR style charts. This was done to evaluate subject ability to perform letter naming versus matching and to obtain an individual estimate of visual acuity.
Controls
Twenty-five typical adult subjects without Down syndrome were recruited from UH staff, students, patients, and their family and friends. One subject was excluded due to current orthokeratology lens treatment which has been shown to result in increased higher order aberrations.23, 24 Of the 24 subjects (7 male, 17 female) age 18 to 50 years (mean (SD): 31.3 (9.5) years) included in the study, zero subjects had nystagmus and 1 subject had strabismus (constant alternating exotropia) (Table 1). The same preliminary testing described above was also performed with control subjects, with the exception that some controls presented with contact lens correction. These subjects reported the power of their contact lenses to the examiners and had distance autorefraction performed over their contacts, similar to subjects presenting with spectacles.
Visual Acuity Testing
Monocular high contrast Bailey Lovie style visual acuity was performed using a custom Matlab program with charts presented on a computer display (1200*1600 pixel resolution, luminance: 380 cd/m2). Two different letter sets were used in composing the charts. For the first, the British standard 1968, recommended letters (D,E,F,H,N,P,R,U,V,Z) were arranged in the Bailey Lovie-style and used as the first choice of visual acuity testing for subjects with Down syndrome (termed Bailey Lovie acuity in this study). For subjects with Down syndrome who were unable to reliably read letters, visual acuity was obtained using the letter set H, O, T, and V arranged in the same Bailey Lovie-style (5 letters per line with one letter from the set selected twice for each line). Subjects used a matching card to indicate their responses and this procedure was termed HOTV acuity for this study. For controls, all subjects read both the Bailey Lovie and HOTV charts (testing order randomized).
For acuity testing, subjects placed their head in a chin and forehead rest seated 12.2ft from the monitor. In determining the working distance, we first set the requirement of a minimum of two pixels per stroke width for the smallest letter displayed. Next, we identified 20/10 as the smallest acuity size we believed necessary to identify acuity threshold in a typical, well-corrected observer. The calculated working distance for the two pixel stroke width letter to equal 20/10 was 12.2 feet. We chose not to present the monitor at a greater working distance, as this would have reduced the larger letter sizes we could present and thus lower the ceiling for threshold acuity measures of subjects with reduced acuity.
Each chart contained 12 lines corresponding to 0.8 to −0.3 logMAR at the 12.2 ft. testing distance in 0.1 logMAR steps. The upper limit of 0.8 logMAR was based on the largest possible letter size for which a 5-letter line could be displayed on the monitor for both the Bailey Lovie and HOTV charts. Visual acuity (both Bailey Lovie and HOTV) was collected with the room lights off (eye testing order randomized) with subjects’ presenting refractive correction (contact lenses, spectacles, or unaided). During testing, subjects read one line at a time while an examiner entered correct or incorrect responses on the computer. Visual acuity testing was performed for all subjects by a team of two examiners – one to operate the computer and enter responses, and one to assist the subject with positioning in the chin and forehead rest. For subjects with Down syndrome, one examiner pointed to each individual letter on the screen to ensure subjects knew where to begin reading. Three subjects with Down syndrome presented for the study with significant uncorrected refractive error such that they could not read any letters on the 0.8 logMAR line. These subjects were tested wearing a trial frame correction determined from a combined assessment of autorefraction measures and retinoscopy findings.
Subjects began reading at a letter size where 5 out of 5 letters were correctly identified (determined by presenting a logMAR size multiple lines larger than their entering Snellen or HOTV pre-screening acuity), and then continued to read lines (with guessing required as difficulty increased) of decreasing size (0.1 logMAR steps) until a total of 5 letters were missed (not necessarily consecutive). This strategy of varying the starting line size (rather than standardizing to the largest size for all subjects) was used to reduce test time for subjects, but does make the assumption that all larger letters above the starting line would have been seen correctly, if shown. We adopted a stopping point of five total mistakes rather than other commonly used stopping points, such as three or more total mistakes on a given line, five mistakes on a given line, or requiring subjects to attempt all letters on the chart. Our decision to adopt five total mistakes minimized the amount of guessing subjects were required to do and likely increased subject cooperation for repeated testing. Particularly given that our population of interest had reduced visual acuity, requiring subjects to read the entire chart would have been a challenging and time-consuming task. The endpoint of five total mistakes was uniformly applied across subject groups and acuity tests and has also been used in past studies with visual acuity outcomes.25–27
The automated scoring software thus recorded ‘correct’ responses for any letters on acuity lines above the starting level selected by the examiner for each subject. Acuity was recorded using the letter by letter scoring method (0.02 logMAR for each letter identified correctly). Subjects were given credit for all letters read correctly up to the fifth missed letter on each chart, and the number of letters read correctly were converted to logMAR acuity as:
where, x = starting line + 0.1; LC = total number of correct letters.
Testing was repeated with 3 separate charts (randomly selected from a total of 12 unique charts) and an average threshold was determined for each eye.
As part of a larger study, we sought to monitor pupil size (data not reported here) of the non-viewing eye throughout acuity testing with the PowerRef 3 (Plusoptix, Nuremberg, Germany), a dynamic, infrared photorefractor. To avoid false pupil size measures from spectacle lens minification/magnification, subjects’ presenting spectacle powers were placed in a trial frame over the tested eye while the non-tested eye was left uncorrected and visually occluded with a Kodak Wratten 89B filter (passes infrared light for PowerRef 3 measures, but blocks visible light). Twenty three subjects with Down syndrome and 12 controls were tested in this fashion with their correction in the trial frame. Five subjects with Down syndrome and 5 controls did not present with any correction and were thus tested unaided with only the Wratten filter over the fellow eye, while 7 controls presented with contact lenses and were also tested without additional trial lenses in place. Two subjects with Down syndrome were measured binocularly only (HOTV acuity), one of whom had a large magnitude nystagmus upon occlusion that reduced visual acuity above the threshold testable at the 12.2 ft. viewing distance, and the other who had resistance to occlusion that would have made them untestable monocularly.
Statistical Analysis
Statistical analyses were performed using SAS 9.4 (SasInstitute, Cary, NC). The average and standard deviation of three measures of visual acuity per eye per subject was calculated separately for Bailey Lovie and HOTV visual acuity. For HOTV, data from a subset of age-matched controls were selected from the total subjects to match the sample size of the Down syndrome group performing HOTV. To select these controls, data was arranged according to the subject ID and the first subject who matched with the age of the corresponding subjects with Down syndrome was selected. Repeated measures ANOVA was used to compare group mean differences in logMAR visual acuity by eye. The clustered Wilcoxon rank sum test was used to test whether visual acuity variability differed across Down syndrome and control subjects accounting for inter-eye correlation. To assess the within-subject repeatability of visual acuity measurements, we estimated the within subject standard deviation (Sw) obtained from the square root of the residual variance of a random coefficients model implementing PROC MIXED in SAS, accounting for the covariance between the left and right eye as well as the correlation of measurements made within each eye with dependent outcome stated as the actual measurements. The repeatability (1.96*√2* Sw) was estimated and reported for each group and each chart technique. Mean spherical equivalent refractive error and cylinder magnitude were compared between subjects with Down syndrome and controls using a two-sample t-test with unequal variance.
RESULTS
Twenty-three subjects with Down syndrome were able to complete Bailey Lovie visual acuity testing. The remaining 7 subjects with Down syndrome were tested with HOTV visual acuity. The distribution of subject age and binocular vision conditions by the visual acuity test used are shown in Table 1.
Comparison of Acuity Measures between Subjects with Down Syndrome and Controls
Figure 1A&B shows the average Bailey Lovie visual acuity of each subject across three measures and the absolute inter-eye difference of the average Bailey Lovie visual acuity for subjects with Down syndrome versus controls. Five subjects with Down syndrome each had one eye with an acuity threshold between 0.8 to 0.9, indicating that they missed one or more, but not all, letters on the first row they read. For all other tested eyes, subjects correctly read all five letters on the first row presented. Eyes with constant strabismus or nystagmus are identified in the figure, as both of these conditions could contribute to a reduction in visual acuity.
Figure 1.
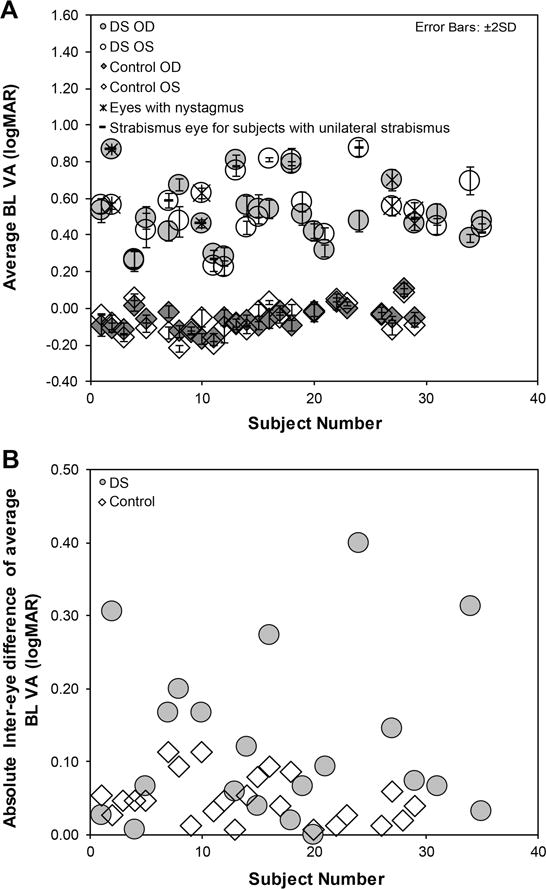
Average Bailey Lovie visual acuity (BL VA (1A)) with error bars representing ±2 SD for each eye (RE = right eye, LE = left eye) of controls and subjects with Down syndrome (DS). 3B shows the absolute inter-eye difference of the average BL VA for each subject.
Figure 2A & B shows the average HOTV visual acuity of each subject across three measures and the absolute inter-eye difference of the average HOTV visual acuity in subjects with Down syndrome and controls. The two subjects with Down syndrome whose acuity was measured binocularly are indicated as DS-OU. Similar to above, eyes with constant strabismus or nystagmus are identified in the figure.
Figure 2.
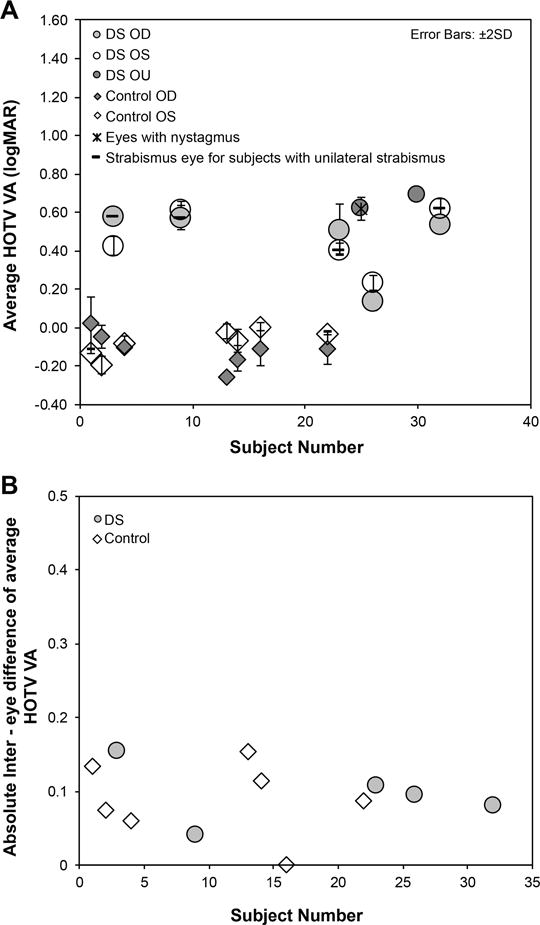
Average HOTV visual acuity (2A) for each eye (RE = right eye, LE = left eye) and the absolute inter-eye difference of the average Bailey Lovie visual acuity (BL VA in subjects with Down syndrome (DS) and controls (4B).
Table 2 shows the average logMAR visual acuity in subjects with Down syndrome was approximately 6 lines worse than controls for both Bailey Lovie and HOTV visual acuity (Repeated measures ANOVA: p<0.001).
Table 2.
Average Bailey-Lovie and HOTV acuity.
| Bailey Lovie VA* | HOTV VA* | |||||||
|---|---|---|---|---|---|---|---|---|
| Down Syndrome | Control | Down Syndrome | Control | |||||
| OD | OS | OD | OS | OD | OS | OD | OS | |
| Mean (SD) | 0.51 (0.16) | 0.53 (0.18) | −0.06 (0.06) | −0.06 (0.08) | 0.47 (0.19) | 0.46 (0.16) | −0.11 (0.09) | −0.07 (0.07) |
| Min | 0.27 | 0.22 | −0.17 | −0.22 | 0.14 | 0.23 | −0.25 | −0.19 |
| Max | 0.87 | 0.87 | −0.11 | 0.09 | 0.58 | 0.62 | 0.03 | 0.01 |
VA = Visual acuity, SD = Standard Deviation, OD = right eye, OS = left eye.
p<0.001 between Down Syndrome and Control eyes
Repeatability of Acuity Measures
Figure 3 shows the individual standard deviation of three repeated measures of logMAR visual acuity for both Bailey Lovie (Down syndrome: 0.04 ± 0.02; Control: 0.03 ± 0.01; clustered Wilcoxon, p <0.001) and HOTV (Down syndrome: 0.05 ± 0.03; control: 0.05 ± 0.04; clustered Wilcoxon, p = 0.53). The standard deviation of both Bailey Lovie and HOTV visual acuity did not correlate with subjects’ average logMAR acuity (3A and 3C) or age (3B and 3D), for either subjects with Down syndrome or controls.
Figure 3.
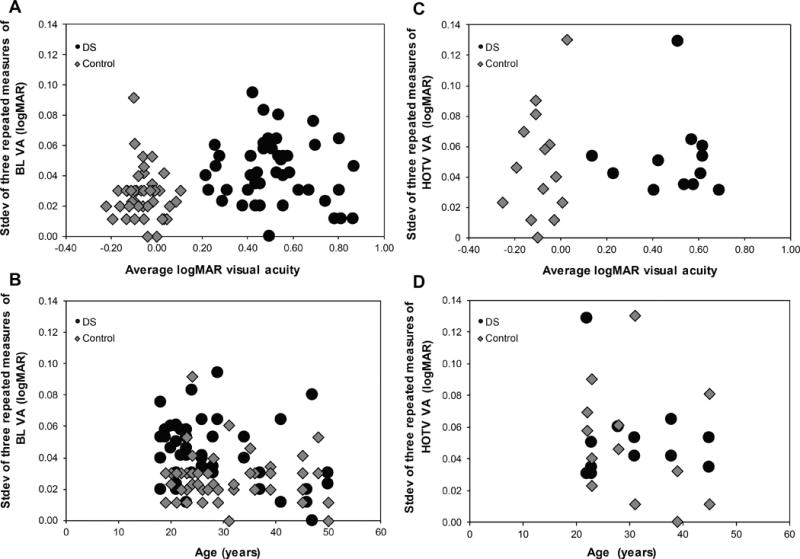
The individual standard deviation of three repeated measures of Bailey Lovie (BL) and HOTV visual acuity plotted as a function of average logMAR acuity (A & B) and age (C & D) for both subjects with Down syndrome (DS) and Controls. There is no significant trend with age or average logMAR acuity.
Repeatability was calculated as 1.96*Sw*√2 and was 0.13 logMAR (6.5 letters) for subjects with Down syndrome and 0.09 logMAR (4.5 letters) for control subjects for Bailey Lovie visual acuity. For HOTV visual acuity, the repeatability was 0.16 logMAR (8 letters) for both Down syndrome and control subjects.
Unaided Refractive Distribution of Down Syndrome and Control Eyes
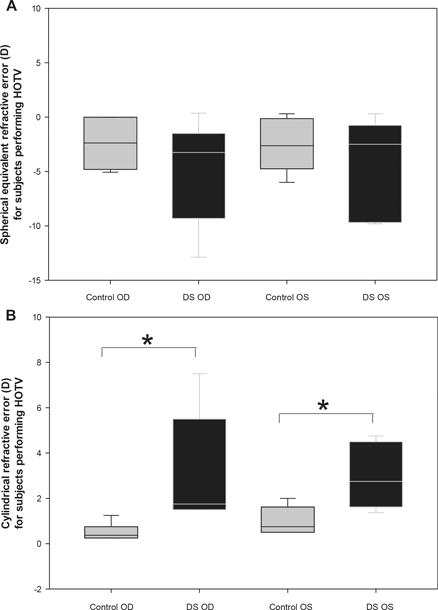
Figures 4A & 4B (subjects performing Bailey Lovie) and 5A & 5B (subjects performing HOTV) show refractive error measured by unaided distance autorefraction for both right and left eyes of Down syndrome and control subjects. For the subjects reading Bailey Lovie letters, there was no significant difference in group mean spherical equivalent refractive error (Figure 4A) between Down Syndrome and control subjects for either eye (Right Eye: Down Syndrome = −0.96 ± 5.11 D, controls = −2.28 ± 2.50 D, t-test, p=0.27; Left Eye: Down Syndrome = −1.01 ± 4.88 D, controls = −2.05 ± 3.05 D, t-test, p=0.39), but there was significant difference in group mean cylinder magnitude (4B) between Down Syndrome and control subjects for both eyes (Right Eye: Down Syndrome = 1.96 ± 1.05 DC, controls = 0.81 ± 0.72 DC, t-test, p < 0.001; Left Eye: Down Syndrome = 2.08 ± 1.07 DC, controls = 1.00 ± 0.78 DC, t-test, p < 0.001). The comparisons for the subjects reading HOTV letters (5A & 5B) were similar in that there was no significant difference in group mean spherical equivalent refractive error between Down Syndrome and control subjects for either eye (Right Eye: Down Syndrome = −4.81 ± 4.76 D, controls = −2.60 ± 2.26 D, t-test, p=0.29; Left Eye: Down Syndrome = −4.84 ± 4.65 D, controls = −2.79 ± 2.41 D, t-test, p=0.33), but there was a significant difference in group mean cylinder magnitude between Down Syndrome and control subjects for both eyes (Right Eye: Down Syndrome = 3.09 ± 2.41 DC, controls = 0.55 ± 0.36 DC, t-test, p = 0.03; Left Eye: Down Syndrome = 3.00 ± 1.44 DC, controls = 1.07 ± 0.62 DC, t-test, p = 0.01).
Figure 4.
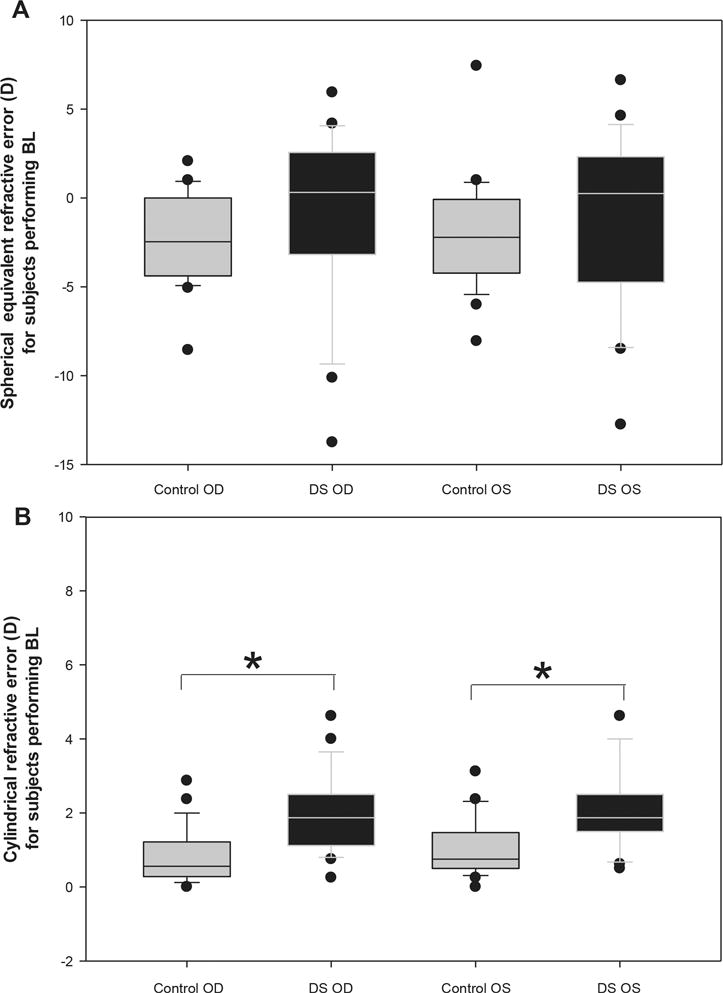
The distribution of unaided spherical equivalent refractive error (A) and cylinder magnitude (B) obtained with distance autorefraction for each eye (Right eye = OD, Left eye = OS) in controls and subjects with Down Syndrome (DS) for those performing BL. Solid lines represent median values, box boundaries represent 25th and 75th percentiles, and whiskers represent 10th and 90th percentiles. Dots represent outliers beyond the 10th and 90th percentiles. *p < 0.001.
Residual Refractive Error during Acuity Testing
Table 3 reflects the residual refractive error present during acuity testing for subjects as measured by distance autorefraction (over-refraction for those with presenting corrections and unaided autorefraction for those without). This summary provides a comparison of residual refractive error present during the time of acuity testing that could have accounted for some of the differences in overall acuity performance between subject groups. Data are shown for subjects performing the Bailey Lovie task with the exception of one subject with Down syndrome who was tested in a refractive correction determined at the time of the visit and thus an over-refraction measure of habitual spectacles was not included. In general, the group with Down syndrome had a larger range of residual refractive error. Data for subjects performing HOTV testing are not shown given that four of the seven subjects with Down Syndrome did not have over-refractions available for analysis: two were wearing high minus prescriptions through which autorefraction measures could not be obtained and two had acuity tested through a refractive correction determined at the time of the visit.
Table 3.
Residual refractive error present during acuity testing as determined from over-autorefraction.
| Down Syndrome (n=22) | Controls (n= 24) | |||||||
|---|---|---|---|---|---|---|---|---|
| Right Eye | Left Eye | Right Eye | Left Eye | |||||
| SE | Cylinder | SE | Cylinder | SE | Cylinder | SE | Cylinder | |
| Mean (SD) (D) | 0.28 (0.90) | 1.18 (0.60) | −0.10. (1.17) | 1.24 (0.80) | 0.36 (0.49) | 0.52 (0.32) | 0.30 (0.52) | 0.48 (0.26) |
| Range (D) | −1.94 to +2.56 | 0.12 to 2.25 | −2.68 to +2.25 | 0.37 to 4.00 | −0.44 to +1.31 | 0.12 to 1.50 | −0.56 to +1.69 | 0.12 to 1.12 |
SE = spherical equivalent, SD = Standard Deviation, D = Diopters
DISCUSSION
The repeatability of Bailey Lovie acuity testing, as reported by 1.96* within subject standard deviation *√2, was ± 0.13 logMAR (6.5 letters) for subjects with Down Syndrome and ± 0.09 logMAR (4.5 letters) for control subjects measured over a single session. This repeatability was established from three repeated measurements of acuity per eye, which was our chosen study design due to expectations that acuity measures could vary widely throughout testing of individual subjects with intellectual disability. However, our findings indicate that variability was not sizably increased in our subjects with Down syndrome as compared to controls.
The repeatability observed in controls in our study for Bailey Lovie acuity testing was similar to previous studies, such as Elliott & Sheridan17 (± 0.07 logMAR), Raasch et al15 (± 0.07 logMAR), Bailey et al16 (± 0.10 logMAR), Rosser et al20 for 0 D defocus (± 0.11 logMAR) and Lovie-Kitchin & Brown19 (± 0.11 logMAR), who all reported the test-retest variability during a single or two sessions for normal subjects wearing their best optical correction. Although slightly larger at ±0.13 logMAR, our subjects with Down Syndrome still had repeatability for Bailey Lovie similar to that reported in previous studies of typical, well-corrected adults, despite the significantly poorer level of visual acuity (~6 lines worse than controls) observed in this group. Previous studies have reported that the repeatability of acuity measures is affected by the presence of optical defocus (induced), with one such study reporting an increase in repeatability from 0.11 logMAR for 0 D defocus to 0.25 logMAR for 1.00 D defocus20. Given the magnitude of some of the residual refractive error present in our subjects with Down Syndrome at the time of testing (Table 3), it appears that the presence of uncorrected refractive error may not negatively impact repeatability of acuity testing in this population to the same magnitude previously reported. One important distinction to make is that the subjects in this study are habitually exposed to their residual refractive error, whereas in previous studies, blur was induced experimentally in the subjects.
Repeatability in HOTV acuity in subjects with Down syndrome was similar to that obtained with the Bailey Lovie test. However the repeatability of controls for HOTV testing doubled with respect to Bailey Lovie acuity. This large increase in repeatability in controls with HOTV testing could be related to limitations in the stimulus presentation at the smallest acuity levels and is discussed further below.
Test re-test variability in the presence of ocular abnormalities such as macular degeneration, cataract and various clinical conditions has been reported to vary between ± 0.10 to ± 0.21 logMAR.17, 28, 29 The relationship between repeatability and ocular abnormality is weak as compared to the presence of optical defocus20. The repeatability of subjects with Down Syndrome, even in the presence of intellectual disability, was less than that reported in the presence of some ocular abnormalities, suggesting that if the subjects with intellectually disability are initially able to participate in the test, they will not likely demonstrate reduced repeatability due to intellectual barriers.
Nystagmus is one condition that is commonly observed in patients with Down syndrome that could be expected to negatively impact repeatability of acuity testing. Given that only four of the subjects performing the Bailey Lovie testing in this study had nystagmus, our ability to draw conclusions from this group is limited. However, to explore this question, we compared repeatability of the entire group (0.13) to the repeatability of the group once subjects with nystagmus were removed (0.14) and found no improvement in repeatability. Thus we do not believe that including subjects with nystagmus impacted the repeatability of acuity measures for our sample of subjects with Down syndrome.
The mean logMAR acuity in our subjects with Down syndrome was 0.52 ± 0.17 for Bailey Lovie and 0.50 ± 0.17 for HOTV. This acuity is very similar to that reported by Fong, et al30 for 91 adults with Down syndrome aged between 30–56 years who had a group mean presenting distance visual acuity of 0.66 logMAR and a best corrected distance visual acuity of 0.48 logMAR. Haire, et al.31 also reported similar visual acuity in 17 adults with Down Syndrome aged between 15 to 65 years for which no subject had acuity better than 20/60 (~0.50 logMAR). Van Buggenhout et al32 found a visual acuity of worse than 0.30 logMAR in 49 of 91 subjects with Down syndrome aged between 29 and 60 years and better than 0.30 in 19 subjects with Down syndrome. In addition, our subjects with Down syndrome had a wide range of refractive error with significantly more refractive astigmatism than our control subjects (Figures 1 & 2), a finding that is consistent with previous publications of individuals with Down syndrome.4, 33–35
Although our acuity testing system was unique in that it was performed with a computerized display controlled by MatLAB, the chart reading method itself is transferable to a clinical setting in which patients read Bailey Lovie style charts one line at a time with a standardized testing protocol. We used a letter by letter scoring method, rather than a line scoring method, as it has previously been shown the letter by letter method reduces variability in testing.14–16 We also did not require subjects to start reading from the top row of the chart, but rather from a lower line for which 5/5 letters were still correctly identified. This strategy accelerated testing time and has previously been shown to be as accurate as and have less variability than subjects starting from the largest line size.36
Study Limitations
As previously stated, the acuity chart letter sizes in this study were limited by both the resolution and screen size of the monitor utilized for acuity testing. Thus, the acuity size for which 5/5 letters could be correctly identified was not obtained for all eyes from subjects with Down syndrome. Unlike a clinical setting, we could not adopt a shorter testing distance for the few subjects with Down Syndrome with acuity poorer than 0.8 logMAR due to concurrent experimental measures that were being obtained during acuity testing (e.g. pupil size monitoring). Conversely, the absolute threshold acuity with HOTV letters was not obtained for one control subject who had not made 5 total mistakes after reading the smallest letter size. This limitation may account for some of the increased repeatability observed in controls when performing the HOTV test, particularly given the higher guess rate with HOTV testing likely leading to better acuity performance.
This study also does not speak to the acuity potential of subjects with Down syndrome, as individuals were primarily tested with their presenting correction rather than given an updated best refraction, and thus large levels of uncorrected refractive error were present for some subjects during testing. Despite uncorrected refractive error, variability was similar to control subjects, and thus a full refractive correction would not be expected to result in a sizeable change in repeatability of acuity testing under these conditions.
Lastly, the data presented here only speak to the short-term variability in repeated acuity measures during a single visit. Manny, et al. reported the repeatability of ETDRS acuity testing in children aged 6–10 years tested one month apart was ±0.15 logMAR. Given the similarity in our subjects’ repeatability in a single session of repeated testing to previous study populations, it is reasonable to expect that inter-session repeatability would also be comparable. One exception, however, could be if examiners who are unfamiliar interacting with and evaluating this population were included, but any repeatability could likely be minimized if a standardized protocol were developed, as previously found by Manny et al21 when testing pediatric subjects. Further studies investigating between session repeatability will be useful to determine whether acuity measures fluctuate in this population over time, either from underlying ocular conditions or behavioral limitations.
CONCLUSIONS
Despite worse acuity in adult subjects with Down syndrome, the visual acuity measurements was repeatable within ± 0.16 logMAR (8 letters) in both Down syndrome eyes and control eyes, suggesting that for adults with Down syndrome who are able to perform an initial visual acuity test, the findings are expected to have good repeatability, despite potential overall poor visual acuity. These findings may serve to increase confidence of practitioners to utilize visual acuity as a metric to compare pre and post refraction performance for patients with Down syndrome during a single visit.
Figure 5.
The distribution of unaided spherical equivalent refractive error (A) and cylinder magnitude (B) obtained with distance autorefraction for each eye (Right eye = OD, Left eye = OS) in controls and subjects with Down Syndrome (DS) for those performing HOTV. Solid lines represent median values, box boundaries represent 25th and 75th percentiles, and whiskers represent 10th and 90th percentiles. *p≤0.03.
References
- 1.Parker SE, Mai CT, Canfield MA, et al. National Birth Defects Prevention N. Updated National Birth Prevalence Estimates for Selected Birth Defects in the United States, 2004–2006. Birth Defects Res A Clin Mol Teratol. 2010;88:1008–16. doi: 10.1002/bdra.20735. [DOI] [PubMed] [Google Scholar]
- 2.Anderson HA, Manny RE, Glasser A, et al. Static and Dynamic Measurements of Accommodation in Individuals with Down syndrome. Invest Ophthalmol Vis Sci. 2011;52:310–7. doi: 10.1167/iovs.10-5301. [DOI] [PMC free article] [PubMed] [Google Scholar]
- 3.Courage ML, Adams RJ, Reyno S, et al. Visual Acuity in Infants and Children with Down Syndrome. Dev Med Child Neurol. 1994;36:586–93. doi: 10.1111/j.1469-8749.1994.tb11895.x. [DOI] [PubMed] [Google Scholar]
- 4.Haugen OH, Hovding G, Lundstrom I. Refractive Development in Children with Down’s Syndrome: A Population Based, Longitudinal Study. Br J Ophthalmol. 2001;85:714–9. doi: 10.1136/bjo.85.6.714. [DOI] [PMC free article] [PubMed] [Google Scholar]
- 5.Hestnes A, Sand T, Fostad K. Ocular Findings in Down’s Syndrome. J Ment Defic Res. 1991;35(Pt 3):194–203. doi: 10.1111/j.1365-2788.1991.tb01052.x. [DOI] [PubMed] [Google Scholar]
- 6.Ljubic A, Trajkovski V, Stankovic B. Strabismus, Refractive Errors and Nystagmus in Children and Young Adults with Down Syndrome. Ophthalmic Genet. 2011;32:204–11. doi: 10.3109/13816810.2011.592175. [DOI] [PubMed] [Google Scholar]
- 7.Stewart RE, Woodhouse JM, Cregg M, Pakeman VH. Association between Accommodative Accuracy, Hypermetropia, and Strabismus in Children with Down’s Syndrome. Optom Vis Sci. 2007;84:149–55. doi: 10.1097/OPX.0b013e318031b686. [DOI] [PubMed] [Google Scholar]
- 8.Stirn Kranjc B. Ocular Abnormalities and Systemic Disease in Down Syndrome. Strabismus. 2012;20:74–7. doi: 10.3109/09273972.2012.680234. [DOI] [PubMed] [Google Scholar]
- 9.Woodhouse JM, Pakeman VH, Saunders KJ, et al. Visual Acuity and Accommodation in Infants and Young Children with Down’s Syndrome. J Intellect Disabil Res. 1996;40(Pt 1):49–55. doi: 10.1111/j.1365-2788.1996.tb00602.x. [DOI] [PubMed] [Google Scholar]
- 10.Kassoff A. Design of a New Visual Acuity Chart (Modified Bailey-Lovie) Invest Ophthalmol Vis Sci. 1979;18(Suppl):219. [Google Scholar]
- 11.Standard B. Test Charts For Determining Distance Visual Acuity: BS 4274-196. British Standards Institute; London: 1968. (1968) [Google Scholar]
- 12.Hyvarinen L, Nasanen R, Laurinen P. New Visual Acuity Test for Pre-School Children. Acta Ophthalmol (Copenh) 1980;58:507–11. doi: 10.1111/j.1755-3768.1980.tb08291.x. [DOI] [PubMed] [Google Scholar]
- 13.Hartmann EE, Dobson V, Hainline L, et al. Preschool Vision Screening: Summary of a Task Force Report. Behalf of the Maternal and Child Health Bureau and the National Eye Institute Task Force on Vision Screening in the Preschool Child Pediatrics. 2000;106:1105–16. doi: 10.1542/peds.106.5.1105. [DOI] [PubMed] [Google Scholar]
- 14.Arditi A, Cagenello R. On the Statistical Reliability of Letter-Chart Visual Acuity Measurements. Invest Ophthalmol Vis Sci. 1993;34:120–9. [PubMed] [Google Scholar]
- 15.Raasch TW, Bailey IL, Bullimore MA. Repeatability of Visual Acuity Measurement. Optom Vis Sci. 1998;75:342–8. doi: 10.1097/00006324-199805000-00024. [DOI] [PubMed] [Google Scholar]
- 16.Bailey IL, Bullimore MA, Raasch TW, Taylor HR. Clinical Grading and the Effects of Scaling. Invest Ophthalmol Vis Sci. 1991;32:422–32. [PubMed] [Google Scholar]
- 17.Elliott DB, Sheridan M. The Use of Accurate Visual Acuity Measurements in Clinical Anti-Cataract Formulation Trials. Ophthalmic Physiol Opt. 1988;8:397–401. doi: 10.1111/j.1475-1313.1988.tb01176.x. [DOI] [PubMed] [Google Scholar]
- 18.Lovie-Kitchin JE. Validity and Reliability of Visual Acuity Measurements. Ophthalmic Physiol Opt. 1988;8:363–70. doi: 10.1111/j.1475-1313.1988.tb01170.x. [DOI] [PubMed] [Google Scholar]
- 19.Lovie-Kitchin JE, Brown B. Repeatability and Intercorrelations of Standard Vision Tests as a Function of Age. Optom Vis Sci. 2000;77:412–20. doi: 10.1097/00006324-200008000-00008. [DOI] [PubMed] [Google Scholar]
- 20.Rosser DA, Murdoch IE, Cousens SN. The Effect of Optical Defocus on the Test-Retest Variability of Visual Acuity Measurements. Invest Ophthalmol Vis Sci. 2004;45:1076–9. doi: 10.1167/iovs.03-1320. [DOI] [PubMed] [Google Scholar]
- 21.Manny RE, Hussein M, Gwiazda J, et al. Repeatability of ETDRS Visual Acuity in Children. Invest Ophthalmol Vis Sci. 2003;44:3294–300. doi: 10.1167/iovs.02-1199. [DOI] [PubMed] [Google Scholar]
- 22.Kheterpal S, Jones HS, Auld R, Moseley MJ. Reliability of Visual Acuity in Children with Reduced Vision. Ophthalmic Physiol Opt. 1996;16:447–9. [PubMed] [Google Scholar]
- 23.Hiraoka T, Matsumoto Y, Okamoto F, et al. Corneal Higher-Order Aberrations Induced by Overnight Orthokeratology. Am J Ophthalmol. 2005;139:429–36. doi: 10.1016/j.ajo.2004.10.006. [DOI] [PubMed] [Google Scholar]
- 24.Hiraoka T, Okamoto C, Ishii Y, et al. Contrast Sensitivity Function and Ocular Higher-Order Aberrations following Overnight Orthokeratology. Invest Ophthalmol Vis Sci. 2007;48:550–6. doi: 10.1167/iovs.06-0914. [DOI] [PubMed] [Google Scholar]
- 25.Applegate RA, Marsack JD, Thibos LN. Metrics of Retinal Image Quality Predict Visual Performance in Eyes with 20/17 or Better Visual Acuity. Optom Vis Sci. 2006;83:635–40. doi: 10.1097/01.opx.0000232842.60932.af. [DOI] [PMC free article] [PubMed] [Google Scholar]
- 26.Ravikumar A, Sarver EJ, Applegate RA. Change in Visual Acuity Is Highly Correlated with Change in Six Image Quality Metrics Independent of Wavefront Error and/or Pupil Diameter. J Vis. 2012;12:11. doi: 10.1167/12.10.11. [DOI] [PMC free article] [PubMed] [Google Scholar]
- 27.Ravikumar A, Marsack JD, Bedell HE, Shi Y, Applegate RA. Change in Visual Acuity Is Well Correlated with Change in Image-Quality Metrics for Both Normal and Keratoconic Wavefront Errors. J Vis. 2013;13:28. doi: 10.1167/13.13.28. [DOI] [PMC free article] [PubMed] [Google Scholar]
- 28.Blackhurst DW, Maguire MG. Reproducibility of Refraction and Visual Acuity Measurement under a Standard Protocol. The Macular Photocoagulation Study Group. Retina. 1989;9:163–9. [PubMed] [Google Scholar]
- 29.Reeves BC, Wood JM, Hill AR. Reliability of High- and Low-Contrast Letter Charts. Ophthalmic Physiol Opt. 1993;13:17–26. doi: 10.1111/j.1475-1313.1993.tb00421.x. [DOI] [PubMed] [Google Scholar]
- 30.Fong AH, Shum J, Ng AL, et al. Prevalence of Ocular Abnormalities in Adults with Down Syndrome in Hong Kong. Br J Ophthalmol. 2013;97:423–8. doi: 10.1136/bjophthalmol-2012-302327. [DOI] [PubMed] [Google Scholar]
- 31.Haire AR, Vernon SA, Rubinstein MP. Levels of Visual Impairment in a Day Centre for People with a Mental Handicap. J R Soc Med. 1991;84:542–4. doi: 10.1177/014107689108400913. [DOI] [PMC free article] [PubMed] [Google Scholar]
- 32.Van Buggenhout GJ, Trommelen JC, Schoenmaker A, et al. Down Syndrome in a Population of Elderly Mentally Retarded Patients: Genetic-Diagnostic Survey and Implications for Medical Care. Am J Med Genet. 1999;85:376–84. doi: 10.1002/(sici)1096-8628(19990806)85:4<376::aid-ajmg14>3.3.co;2-h. [DOI] [PubMed] [Google Scholar]
- 33.Da Cunha RP, Moreira JB. Ocular Findings in Down’s Syndrome. Am J Ophthalmol. 1996;122:236–44. doi: 10.1016/s0002-9394(14)72015-x. [DOI] [PubMed] [Google Scholar]
- 34.Knowlton R, Marsack JD, Leach NE, et al. Comparison of Whole Eye versus First-Surface Astigmatism in Down Syndrome. Optom Vis Sci. 2015;92:804–14. doi: 10.1097/OPX.0000000000000620. [DOI] [PMC free article] [PubMed] [Google Scholar]
- 35.Little JA, Woodhouse JM, Saunders KJ. Corneal Power and Astigmatism in Down Syndrome. Optom Vis Sci. 2009;86:748–54. doi: 10.1097/OPX.0b013e3181a59d5d. [DOI] [PubMed] [Google Scholar]
- 36.Camparini M, Cassinari P, Ferrigno L, Macaluso C. ETDRS-Fast: Implementing Psychophysical Adaptive Methods to Standardized Visual Acuity Measurement with ETDRS Charts. Invest Ophthalmol Vis Sci. 2001;42:1226–31. [PubMed] [Google Scholar]