Abstract
Purpose
To demonstrate the technical feasibility of high-resolution (0.28–0.14 mm) ultrashort echo time (UTE) imaging on human knee at 3T with the acquisition-weighted stack of spirals (AWSOS) sequence.
Materials and Methods
Nine human subjects were scanned on a 3T MRI scanner with an 8-channel knee coil using the AWSOS sequence and isocenter positioning plus manual shimming.
Results
High-resolution UTE images were obtained on the subject knees at TE = 0.6 msec with total acquisition time of 5.12 minutes for 60 slices at an in-plane resolution of 0.28 mm and 10.24 minutes for 40 slices at an in-plane resolution of 0.14 mm. Isocenter positioning, manual shimming, and the 8-channel array coil helped minimize image distortion and achieve high signal-to-noise ratio (SNR).
Conclusion
It is technically feasible on a clinical 3T MRI scanner to perform UTE imaging on human knee at very high spatial resolutions (0.28–0.14 mm) within reasonable scan time (5–10 min) using the AWSOS sequence.
Keywords: knee imaging, UTE imaging, high-resolution imaging, short T2 relaxation, 3T MRI
High-Resolution (<0.3 mm) and ultrashort echo time (UTE) (<1.0 msec) are desired in magnetic resonance imaging (MRI) for the knee due to anatomical and biochemical properties of its connective tissues including cartilages, menisci, ligaments, and tendons. Cartilage in the knee, for instance, is thin, between 2–7 mm (1), and needs high spatial resolution to show its laminar structures. Cartilage constituents exhibit fast T2 relaxations such as ≈4 msec in the collagen trapped water molecules and ≈1 msec in the fragmented (mobile) proteoglycan (PG) macromolecules (2–5). Faster T2 relaxations exist in collagen (≈0.03 msec) and PG (≈0.02 msec) macromolecules themselves (2). These fast relaxations need ultrashort echo times to detect their MR signals. Conventional MRI usually uses long echo time (≈10 msec) and results in dark (hypointense) appearance of the connective tissues in MR images (6).
A number of ultrashort echo time pulse sequences have been developed on human MRI scanners to minimize the decay of MR signals from fast T2 relaxations and permit visualization of bright (hyperintense) connective tissues. Half-sinc pulse excitation has been employed to reduce echo times to the hardware limits, achieving echo times as short as 0.008 or 0.02 msec (7,8). Rectangular (nonselective) pulse excitation permits echo times as short as 0.07 msec (9,10). Although there is no echo used in UTE acquisitions, the term “echo time” used here refers to the time period between the effective center of an excitation pulse to the beginning of data acquisition at the k-space center. Selective pulse excitation uses an echo time of 0.6 msec (11,12). Discrete pulse excitation pushes echo time down to gradient hardware limits such as 0.004 msec or 0.01 msec (13), depending on the MRI scanner system.
UTE pulse sequences produce either isotropic 3D images (eg, rectangular or discrete pulse excitation) or multiple-slice 2D images (eg, half-sinc pulse excitation). The selective pulse excitation, however, produces 3D images with in-plane resolution different from slice thickness. This renders opportunities to produce high-resolution images without changing slice thickness (and thus provides sufficient signal-to-noise ratio [SNR]). This is especially helpful in imaging connective tissues in the knee due to the thinness of those tissues.
Data acquisitions in UTE imaging are usually implemented along non-Cartesian trajectories (eg, radial and spiral) to achieve ultrashort TE. Use of non-Cartesian trajectories, however, raises technical complexities in knee imaging such as subject positioning (due to lack of perfect phase shifting performance between the k-space data and image-domain object), B0-field shimming (due to point-spread artifact), and acquisition parameter optimization (due to wide-range varying in readout time). These complexities discourage clinical applications of UTE imaging.
This study addresses these technical complexities by providing solutions for acquiring high-resolution, high-quality UTE images of human knee on 3T MRI scanners with a UTE sequence of selective pulse excitation, the acquisition-weighted stack of spirals (AWSOS) sequence (12,14).
MATERIALS AND METHODS
Subjects and MRI Scanner
Nine human subjects of age 28.3 ± 5.5 years (range 20–37 years; seven males; five asymptomatic and four anterior cruciate ligament [ACL]-injured) were recruited in this study under a protocol approved by the authors’ Institutional Review Board. One knee was investigated on each subject. MRI scans were implemented on a whole-body 3T scanner (Magnetom Trio Tim, Siemens Medical Solutions, Erlangen, Germany) with an 8-channel knee coil (Invivo, Gainesville, FL).
Pulse Sequence
A home-developed, fast, 3D, UTE sequence, AWSOS, was used for data acquisitions in this study (12). The AWSOS sequence can produce knee images of high spatial resolution (0.28–0.14 mm) without the need to change slice thickness in a 3D acquisition in contrast to those UTE sequences that produce isotropic 3D resolutions (9,13). Isotropic resolution in three dimensions provides the freedom to view the knee joint from different angles, but restricts UTE imaging to low resolutions (eg, 0.55 mm or lower) due to decreased SNR and/or the high-demand for computing memory for image reconstruction at high resolutions. The freedom for choosing slice thickness that differs from in-plane resolution, as provided by the AWSOS sequence, is therefore crucial to the compensation for SNR loss and to reduction in the need for computing memory in pursuing high in-plane resolution.
A detailed description of the AWSOS sequence has previously been reported (12,14). Summarized here are its main features. A selective radiofrequency (RF) pulse of short-duration (<1 msec) is used to excite a slab of ≈120 mm in length covering the entire knee joint. The slab excitation, rather than slice excitation, reduces duration of the refocusing gradient lobe. Variable-duration slice encodings for partitioning the excited slab into thin slices is employed to minimize the acquisition delay at the hardware level (dead time) (eg, 0.02 msec). A spiral trajectory is used to accelerate in-plane data collections. Free induction decay (FID) signals are spatially encoded by the spiral gradients and acquired along the spiral trajectories to achieve an ultrashort TE (eg, 0.6 msec). Total scan time for a 3D image is defined by the product of number of slices, number of in-plane spiral interleaves, and repetition time (TR), usually leading to a reduced scan time by a factor of 4–10 compared with that in Cartesian acquisitions at the same resolution (12).
Acquisition Parameters
The parameters for high-resolution acquisitions are listed in Table 1. For both resolutions (0.28 and 0.14 mm), fat saturation was used and RF pulse was a sinc function of 0.8 msec duration and 1.5 cycles. The echo time was 0.6 msec, expecting to detect the T2* component as short as 0.87 msec at 50% level of its intensity (Fig. 1). In the case of resolution 0.14 mm, the TR was selected to limit total scan time within an acceptable level of ≈10 minutes. The flip angle was accordingly optimized for maximum signal at the given TR through the Ernst equation (15), based on the T1 relaxation time of the cartilage. The slice thickness was experimentally determined to ensure an SNR in the connective tissues at a meaningful level of around 35.
Table 1.
Parameters for High-Resolution Acquisitions
| Resolution 0.28 mm | Resolution 0.14 mm | |
|---|---|---|
| FOV (mm) | 140 | 140 |
| Matrix size | 512 | 1024 |
| Slice thickness (mm) | 2.0 | 3.0 |
| Number of slices | 60 | 40 |
| Number of in-plane spirals | 64 | 256 |
| Spiral readout (msec) | 16.80 | 17.12 |
| Spiral point interval (μs) | 5 | 5 |
| TR (msec)/TE (msec)/θ | 80/0.6/30° | 60/0.6/18° |
| Acquisition time (min) | 5.12 | 10.24 |
Figure 1.
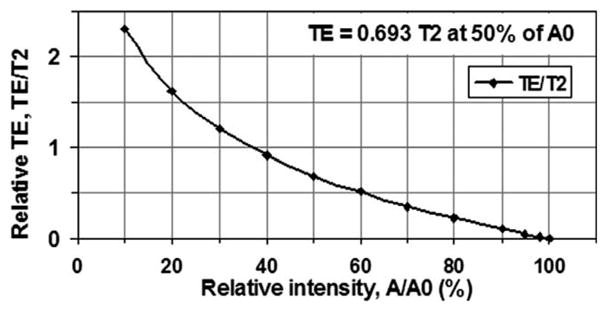
Echo time (TE) and signal intensity (A) under an exponential model: A = A0*exp(−TE/T2). To detect 50% of the intensity of a T2 component, for instance, TE should be as short as 0.693 T2. Therefore, a TE of 0.6 msec detects a T2 component of 0.87 msec at 50% level of its intensity.
Subject Positioning
UTE imaging usually employs non-Cartesian trajectory such as radial or spiral for data acquisition in a plane or in a volume in k-space. Non-Cartesian data acquisition has no simple shift implementation between the k-space data and the image-domain object and thus does not support shifting of field of view (FOV) on the screen without additional adjustments (16). Adding a phase term to the raw data is necessary for supporting FOV shifting during data acquisition through analog/digital conversion (ADC) or during image reconstruction through mathematically complex multiplication. Current phase modification to waveform of the spiral encoding gradient provided by the manufacturer allows the operator to shift FOV on the screen, but it also generates image distortion visible with large FOV shifts. Therefore, isocenter positioning of the knee joint, plus a small amount of off-center adjustment (<1/10 FOV) to further center the FOV on the knee joint was used in this study. In the slice direction the AWSOS sequence allows free positioning due to its uniform slice encoding.
B0 Field Shimming
The AWSOS sequence acquires data along spiral trajectories in the k-space and thus is sensitive to inhomogeneity of the B0 field that causes image blurring (17). Blurring was minimized in this study by achieving a good shim (linewidth <60 Hz at 3T) through manual shimming and frequency adjustment (a process that removes the constant and linear terms in the B0 field inhomogeneity), in addition to the use of short spiral readout time (18). The manual shimming procedure including frequency and transmitter adjustments typically requires one and half minutes to complete compared to half minutes for auto shimming.
RESULTS
Isocenter and Off-Center Positioning
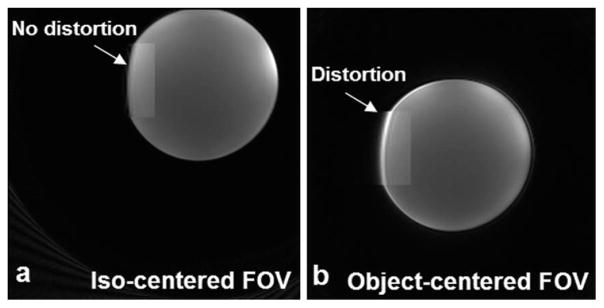
A standard bottle phantom from the manufacturer (Siemens) was scanned with and without centering the FOV (220 mm) (Fig. 2). When the FOV was centered at the isocenter of the magnet, the phantom image had no distortion, as shown in a magnified zone in Fig. 2a. The bright spot on the right side resulted from the phantom’s close proximity to the coil. When the FOV was shifted away from the isocenter by distances of Δx = 54.3 mm and Δy = 33.0 mm and repositioned at the center of the phantom, the image had visible distortion (Fig. 2b). However, no distortion was observed when the FOV was shifted by distances less than 20 mm (not shown in the figure). Therefore, the isocenter positioning was found to perform better than the off-center positioning in terms of minimizing image distortion. All the human scans in this study were performed at isocenter positioning plus as small an amount of FOV shift as needed to accommodate the subjects comfort in the magnet. As of the drafting of this article, there were no complaints about the isocenter positioning from the subjects studied in this project nor in other human research projects previously conducted (74 control/patient subjects in total).
Figure 2.
Positioning of FOV on a bottle phantom at isocenter (a) and off-center (b). With the isocentered FOV there is no image distortion produced (arrow, magnified zone). With the object-centered FOV (the FOV was moved away from the isocenter in (a) to the center of the phantom) there is image distortion produced (arrow, magnified zone). (3T scanner, 8-channel knee coil, AWSOS sequence, TE/TR = 0.6/30 msec, θ = 15°, FOV = 220 mm, and matrix size = 256.)
Patellar Cartilage Images
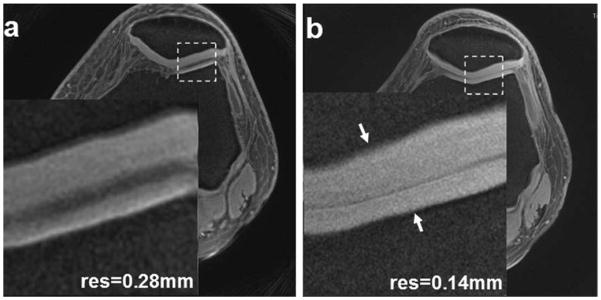
High-resolution (0.28 mm) patellar cartilage images are shown in Fig. 3a. The entire cartilage thickness is visible. In conventional images of long echo time, the patellar cartilage is only partially visible, with a bright superficial layer and a dark deep layer. The magnified zone of the UTE image clearly presents hyperintensity across entire cartilage depth, especially in the deep uncalcified cartilage. Slightly brighter signals are visible in the calcified layers adjacent to subchondral bone. Across tissue depth the signal intensity increases from the superficial to deep layers, reflecting shorter T1 value in deep tissue than in superficial tissue, as the UTE image is a T1-weighted image (TE/ TR = 0.6/80 msec). The higher resolution (0.14 mm) in Fig. 3b shows radial microstructures in the patellar cartilage next to cartilage/bone interface more clearly than the resolution in Fig. 3a.
Figure 3.
Patellar cartilage images of a healthy subject at high-resolution 0.28 mm (a) and higher-resolution 0.14 mm (b). The insets correspond to the dashed box regions, respectively. The higher resolution in (b) shows microstructures in the cartilage (arrows) more clearly than the high resolution in (a). (3T scanner, 8-channel knee coil, AWSOS sequence, FOV = 140 mm, TE/TR = 0.6/80 msec, θ = 30°, matrix size = 512, and slice thickness = 2 mm, or TE/TR = 0.6/60 msec, θ = 18°, matrix size = 1024, and slice thickness = 3 mm.)
Meniscus Images
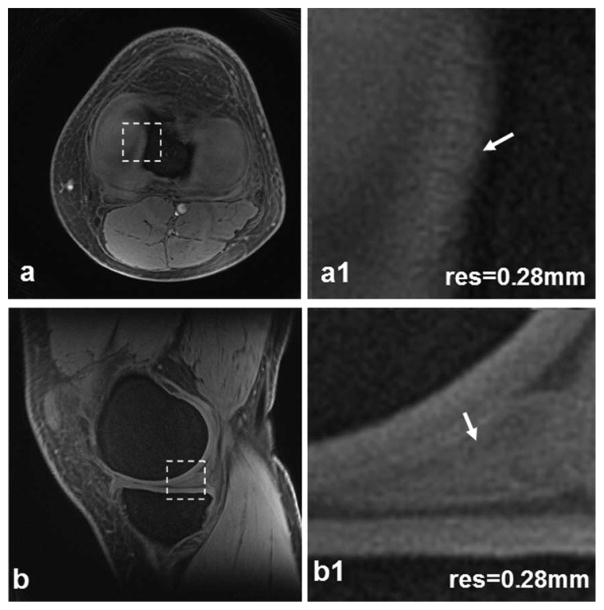
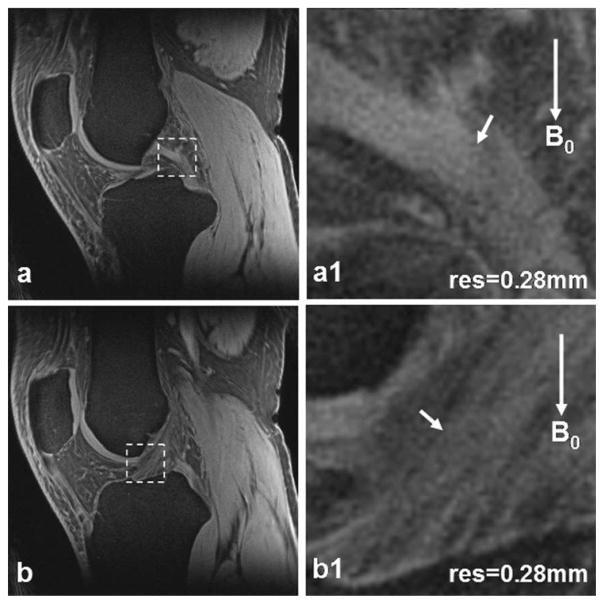
High-resolution transverse and sagittal views of a meniscus are demonstrated in Fig. 4. The transverse view clearly shows both lateral and medial menisci (Fig. 4a), while they are only partially visible in conventional images of long echo time. The sagittal view demonstrates bright signal intensity throughout the meniscus (Fig. 4b), which is typically dark in long-TE images. The magnified transverse zone illustrates fine structures in the medial edge of the meniscus (Fig. 4a1). The inside structures are clearly visible in the magnified sagittal zone (Fig. 4b1).
Figure 4.
Meniscus images of a healthy subject at high-resolution 0.28 mm: transverse (a) and sagittal (b). In the magnified views (a1,b1) corresponding to the dashed box regions in (a,b) respectively, small structures in the meniscus (arrows) are clearly visible. (3T scanner, 8-channel knee coil, AWSOS sequence, TE/TR = 0.6/ 80 msec, θ = 30°, FOV = 140 mm, matrix size = 512, and slice thickness = 2 mm.)
Tibial and Femoral Cartilages
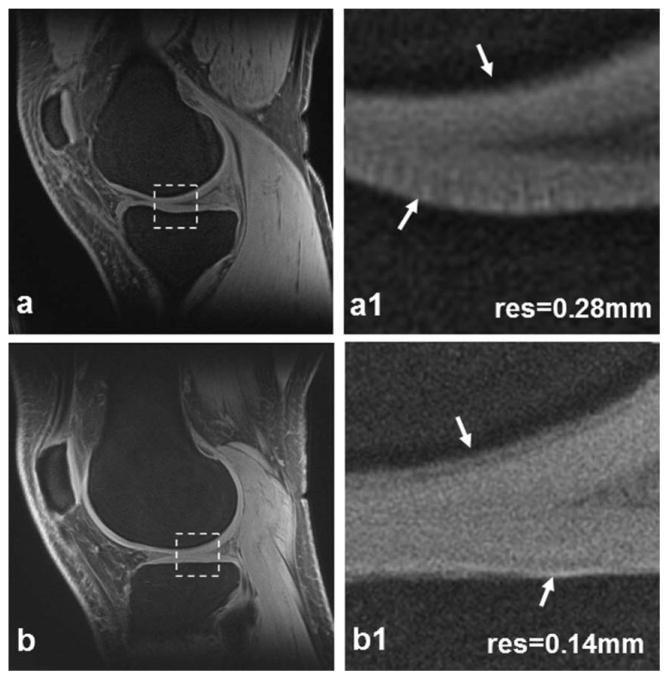
Figure 5 shows high-resolution tibial and femoral cartilage images. The entire cartilage depth demonstrates hyperintensity signal, especially the deep layer, which typically appears hypointense in long TE images. The magnified zones demonstrate uniform intensity of the cartilage. The higher-resolution images in Fig. 5b,b1 illustrate radial-shaped microstructures inside the cartilage more effectively than the high-resolution in Fig. 5a,a1.
Figure 5.
Tibial/femoral cartilage images of a healthy subject at high-resolution 0.28 mm (a) and higher resolution 0.14 mm (b). The magnified views (a1,b1) are corresponding to the dashed box regions in (a,b) respectively. The higher resolution in (b1) illustrates details inside the cartilage or on the cartilage/bone interface (arrows) more effectively than the high resolution in (a1). (3T scanner, 8-channel knee coil, AWSOS sequence, FOV = 140 mm, TE/TR = 0.6/80 msec, θ = 30°, matrix size = 512, and slice thickness = 2 mm, or TE/TR = 0.6/60 msec, θ = 18°, matrix size = 1024, and slice thickness = 3 mm.)
ACL and Posterior Cruciate Ligament [PCL] Ligaments
High-resolution images of ACL and PCL are shown in Fig. 6. The ligaments imaged by UTE sequences here appear hyperintense in contrast to the hypointensity with which they typically appear when imaged by conventional long TE sequences. Ligament bundles and their entheses are also clearly visible.
Figure 6.
Posterior cruciate ligament (PCL) (a) and anterior cruciate ligament (ACL) (b) images of a healthy subject at high-resolution 0.28 mm. In the magnified views (a1,b1) corresponding to the dashed box regions in (a,b) respectively, PCL/ACL bundles (arrows) are clearly visible. (3T scanner, 8-channel knee coil, AWSOS sequence, TE/TR = 0.6/80 msec, θ = 30°, FOV = 140 mm, slice thickness = 2 mm, and matrix size = 512.)
Patellar Tendon
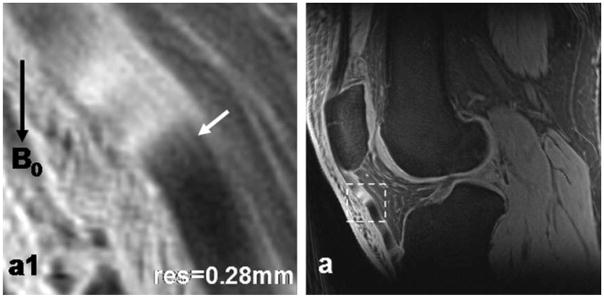
Figure 7 shows a patellar tendon at high spatial resolution (0.28 mm). Collagen bundles inside the tendon are clearly visible, which are otherwise hypointense (dark) at long TE (≈10 msec) in conventional MRI acquisitions. The bright and dark spots on the tendon (Fig. 7a) illustrate the magic angle effect resulting from the varying orientation of the collagen bundles against the main magnetic field. This observation is consistent with a previous report of the magic angle effect on tendons (20).
Figure 7.
Patellar tendon images of a healthy subject at high-resolution 0.28 mm (a). In the magnified view (a1) corresponding to the dashed box region in (a), collagen bundles inside the tendon (arrow) are clearly illustrated. Magic angle effect altered the intensity of tendon in (a) and (a1), and resulted in the appearance of brightening and darkening intensities. (3T scanner, 8-channel knee coil, AWSOS sequence, TE/TR = 0.6/80 msec, θ = 30°, FOV = 140 mm, slice thickness = 2 mm, and matrix size = 512.)
DISCUSSION
This work shows that high-resolution UTE imaging allows not only for view of superficial and deep layers of the connective tissues in the knee (Figs. 3–7) as those reported in literature (3,5,9,19), but also for views of small structures inside the cartilages, menisci, ligaments, and patellar tendons (Figs. 3–7) due to the high in-plane resolutions (0.28 and 0.14 mm), potentially enabling the detection of early damage or subtle reparative changes in these tissues. High in-plane resolutions were achieved by use of the AWSOS sequence which permits in-plane resolution to be defined independently from slice thickness.
A slice thickness of 3 mm was required to achieve adequate SNR in the images of high in-plane resolution 0.14 mm. Such relatively large slice thickness promotes partial volume artifacts in which tissue microstructures are superimposed, potentially resulting in the appearance of pseudolocal structural variations in the image. Although inspection of adjacent slices may help distinguish between pseudo and real variations in local structures, smaller slice thicknesses (eg, ≤2 mm) are desired to reduce the generation of partial volume artifacts. However, smaller slice thicknesses at the same field strength (ie, 3T) are achieved at the cost of reduced SNR. Higher magnetic fields such as 7T are a promising solution to this issue, where SNR benefits from higher field strength and should allow for smaller slice thickness.
Magic angle effects commonly appear on UTE images of the connective tissues in the knee due to their well-organized collagen fibers. The orientation of collagen fibers relative to the main magnetic field varies because of unique anatomy of these tissues (Figs. 4–7). Magic angle effect can cause irregular signal intensities in these tissues with signal brightening seen in regions where the net collagen fiber orientation is 55° from the direction of the main magnetic field and signal darkening in regions where the fibers are oriented perpendicular to the main magnetic field (Fig. 7). These bright-dark regions can provide information about the orientation of collagen bundles in patellar tendons (Fig. 7) or anterior/posterior cruciate ligaments (Fig. 6), but they may also provide confounding information in articular cartilages or menisci where individual collagen fibers are not big enough for viewing even at a high resolution of 0.14 mm (Figs. 4–5).
Flip angles used in this study were selected for maximizing signals from the connective tissues at a given TR. Although T1 values vary largely among cartilage, meniscus, ligament and tendon (eg, 650–1200 msec at 3T) (20,21), the flip angle corresponding to the maximum signal at a TR does not change significantly for these tissues according to Ernst equation (15). Therefore, a flip angle of 18° was selected for all the connective tissues at TR = 60 msec.
Isocenter positioning of the knee joint is a necessary step for UTE imaging utilizing non-Cartesian acquisitions in the current application. A large displacement away from the isocenter causes significant image distortion, as illustrated in the phantom experiments (Fig. 2). Therefore, off-center positioning should be minimized in clinical practice. The AWSOS sequence eases this restriction in the slice direction due to the use of phase encoding; however, in-plane isocenter positioning is still required due to spiral acquisitions. While image distortion due to off-center positioning can be corrected via postprocessing (6), the time and computing requirements currently required for adequate image correction are prohibitive for time-sensitive clinical practice. Better solutions to this issue are needed.
The echo time used in this work was 0.6 msec, capturing T2* components as short as 0.87 msec at a 50% intensity level (Fig. 1). Shorter echo times would be beneficial to the detection of short or ultrashort T2* components of 1.0 msec or shorter (7–10,13,20).
High-resolution UTE images of the knee in this study were acquired with scan times of 5–10 minutes, which were well tolerated by subjects with knee pain. This time-efficiency was achieved due to the use of spiral trajectories in the AWSOS sequence to accelerate in-plane data acquisitions.
In conclusion, UTE images with resolutions of 0.28 mm and 0.14 mm of the connective tissues in the knee can be acquired on a whole-body 3T MRI scanner using the AWSOS sequence. These UTE images reveal anatomical structures inside the cartilages, menisci, ligaments, and patellar tendons that may permit the detection of early degeneration or subtle reparative changes in these connective tissues.
Acknowledgments
Contract grant sponsor: National Institutes of Health (NIH); Contract grant numbers: R01 CA106840 and R01 AR052784; Contract grant sponsor: Department of Radiology Development Fund (University of Pittsburgh).
References
- 1.Eckstein F, Charles HC, Buck RJ, et al. Accuracy and precision of quantitative assessment of cartilage morphology by magnetic resonance imaging at 3.0T. Arthritis Rheum. 2005;52:3132–3136. doi: 10.1002/art.21348. [DOI] [PubMed] [Google Scholar]
- 2.Lattanzio PJ, Marshall KW, Damyanovich AZ, Peemoeller H. Macromolecule and water magnetization exchange modeling in articular cartilage. Magn Reson Med. 2000;44:840–851. doi: 10.1002/1522-2594(200012)44:6<840::aid-mrm4>3.0.co;2-k. [DOI] [PubMed] [Google Scholar]
- 3.Gold GE, Thedens DR, Pauly JM, et al. MR imaging of articular cartilage of the knee: new methods using ultrashort TEs. AJR Am J Roentgenol. 1998;170:1223–1226. doi: 10.2214/ajr.170.5.9574589. [DOI] [PubMed] [Google Scholar]
- 4.Robson MD, Gatehouse PD, Bydder M, Bydder GM. Magnetic resonance: an introduction to ultrashort TE (UTE) imaging. J Comput Assist Tomogr. 2003;27:825–846. doi: 10.1097/00004728-200311000-00001. [DOI] [PubMed] [Google Scholar]
- 5.Du J, Takahashi AM, Chung CB. Ultrashort TE spectroscopic imaging (UTESI): application to the imaging of short T2 relaxation tissues in the musculoskeletal system. J Magn Reson Imaging. 2009;29:412–421. doi: 10.1002/jmri.21465. [DOI] [PubMed] [Google Scholar]
- 6.Gatehouse PD, Bydder GM. Magnetic resonance imaging of short T2 components in tissue. Clin Radiol. 2003;58:1–19. doi: 10.1053/crad.2003.1157. [DOI] [PubMed] [Google Scholar]
- 7.Pauly JM, Nishimura DG. Magnetic resonance imaging of short T2 species. 5,025,216. US patent. 1991 Jun;
- 8.Takahashi AM, Lu A, Brittain JH, et al. Ultra short TE (UTE) imaging at 8 μsec with 3D vastly undersampled isotropic projection reconstruction (VIPR). Proc 13th Annual Meeting ISMRM; Miami. 2005; (abstract 2405) [Google Scholar]
- 9.Rahmer J, Börnert P, Groen J, Bos C. Three-dimensional radial ultrashort echo-time imaging with T2 adapted sampling. Magn Reson Med. 2006;55:1075–1082. doi: 10.1002/mrm.20868. [DOI] [PubMed] [Google Scholar]
- 10.Zhao T, Qian Y, Hue YK, Ibrahim TS, Boada FE. Implementation of a 3D Isotropic Ultra-Shot TE (UTE) Sequence. Proc 17th Annual Meeting ISMRM; Honolulu. 2009; (abstract 2662) [Google Scholar]
- 11.Robson MD, Tyler DJ, Neubauer S. Ultrashort TE chemical shift imaging (UTE-CSI) Magn Reson Med. 2005;53:267–274. doi: 10.1002/mrm.20344. [DOI] [PubMed] [Google Scholar]
- 12.Qian Y, Boada FE. Acquisition-weighted stack of spirals for fast high-resolution three-dimensional ultra-short echo time MR imaging. Magn Reson Med. 2008;60:135–145. doi: 10.1002/mrm.21620. [DOI] [PubMed] [Google Scholar]
- 13.Idiyatullin D, Corum C, Park JY, Garwood M. Fast and quiet MRI using a swept radiofrequency. J Magn Reson. 2006;181:342–349. doi: 10.1016/j.jmr.2006.05.014. [DOI] [PubMed] [Google Scholar]
- 14.Qian Y, Boada FE. A method for producing a magnetic resonance image of an object having short T2 relaxation time. 7,750,632. US Patent. 2010 Jul;
- 15.Haacke EM, Brown RW, Thompson MR, Venkatesan R. Physical principles and sequence design. New York: John Wiley & Sons; 1999. Magnetic resonance imaging. [Google Scholar]
- 16.Jung Y, Jashnani Y, Kijowski R, Block WF. Consistent non-Cartesian off-axis MRI quality: calibrating and removing multiple sources of demodulation phase errors. Magn Reson Med. 2007;57:206–212. doi: 10.1002/mrm.21092. [DOI] [PubMed] [Google Scholar]
- 17.Noll DC, Pauly JM, Meyer CH, Nishmura DG, Macovski A. Deblurring for non-2D Fourier transform magnetic resonance imaging. Magn Reson Med. 1992;25:319–333. doi: 10.1002/mrm.1910250210. [DOI] [PubMed] [Google Scholar]
- 18.Qian Y, Zhao T, Hue YK, Ibraham TS, Boada FE. High resolution spiral imaging on whole body 7T scanner with minimized image blurring. Magn Reson Med. 2010;63:543–552. doi: 10.1002/mrm.22215. [DOI] [PMC free article] [PubMed] [Google Scholar]
- 19.Gatehouse PD, He T, Puri BK, Thomas RD, Resnick D, Bydder GM. Contrast-enhanced MRI of the menisci of the knee using ultrashort echo time (UTE) pulse sequences: imaging of the red and white zones. Bri J Radiol. 2004;77:641–647. doi: 10.1259/bjr/31774546. [DOI] [PubMed] [Google Scholar]
- 20.Du J, Pak BC, Znamirowski R, et al. Magic angle effect in magnetic resonance imaging of the Achilles tendon and enthesis. Magn Reson Imaging. 2009;27:557–564. doi: 10.1016/j.mri.2008.09.003. [DOI] [PubMed] [Google Scholar]
- 21.Stanisz GJ, Odrobina EE, Pun J, et al. T1, T2 relaxation and magnetization transfer in tissue at 3T. Magn Reson Med. 2005;54:507–512. doi: 10.1002/mrm.20605. [DOI] [PubMed] [Google Scholar]


