Abstract
The goal of this study was to exploit the excellent spatial resolution characteristics of a position-sensitive silicon photomultiplier (SiPM) and develop a high-resolution depth-of-interaction (DOI) encoding positron emission tomography (PET) detector module. The detector consists of a 30 × 30 array of 0.445 × 0.445 × 20 mm3 polished LYSO crystals coupled to two 15.5 × 15.5 mm2 linearly-graded SiPM (LG-SiPM) arrays at both ends. The flood histograms show that all the crystals in the LYSO array can be resolved. The energy resolution, the coincidence timing resolution and the DOI resolution were 21.8 ± 5.8 %, 1.23 ± 0.10 ns and 3.8 ± 1.2 mm, respectively, at a temperature of −10 °C and a bias voltage of 35.0 V. The performance did not degrade significantly for event rates of up to 130,000 counts per second. This detector represents an attractive option for small-bore PET scanner designs that simultaneously emphasize high spatial resolution and high detection efficiency, important, for example, in preclinical imaging of the rodent brain with neuroreceptor ligands.
1 Introduction
High resolution and high sensitivity small-animal PET systems are important tools for imaging substructures within the mouse brain or other organs. Finer detail within organs can be seen using higher resolution systems, and higher sensitivity systems can be used to reduce injected mass/dose, reduce scan time, or perhaps most importantly, improve the signal-to-noise ratio and temporal resolution for dynamic studies. New biological targets and pathways might also become accessible to PET using such high-performance systems (Cherry et al 1997 and Yang et al 2016). Previous studies have shown that spatial resolution down to ~ 0.5 mm could be achieved using scintillator crystal arrays with a pitch < 0.5 mm (Stickel et al 2005, St. James et al 2010 and Yang et al 2016). In order to achieve such high spatial resolution, PET systems require the detector modules to be close to the subject to reduce the acolinearity effect and the detector modules also require depth-of-interaction (DOI) encoding ability to obtain uniform spatial resolution across the field of view (St. James et al 2009, Yang et al 2009, St. James et al 2010 and Shao et al 2014).
A high-resolution and high-sensitivity DOI encoding PET detector can be achieved using a high light output scintillator array with fine crystal elements (such as LSO, LYSO or LFS) read out at both ends by position sensitive SiPMs (PS-SiPMs) or SiPM arrays (Sacco et al 2013, Schmall et al 2014, Li et al 2014 and Shao et al 2014). An advantage of using SiPM arrays is that large-area arrays can be easily fabricated (Shimizu et al 2013, Du et al 2015a and González et al 2015), whilst disadvantages include the large number of readout channels and difficulties in resolving the edge crystals when the crystal size is much smaller than the SiPM pixel size (Yamamoto et al 2013 and Du et al 2015b). To overcome the latter problem, crystal arrays are often made somewhat smaller in dimensions than the active area of the SiPM array, leading to a reduction in detector packing fraction and reduced sensitivity. PS-SiPMs only require four or five readout channels, reducing the scale of readout electronics, and have an intrinsic spatial resolution down to the microcell level. PS-SiPMs therefore have the potential to resolve crystals to the very edge of the active area leading to a higher detector packing fraction (McClish et al 2010, Du et al 2013 and Schmall et al 2014). However, the area for these devices has been limited by technological challenges and the overall capacitance.
A novel PS-SiPM, the linearly-graded SiPM (LG-SiPM), has been developed by FBK (Fondazione Bruno Kessler, Italy) (Gola et al 2013, Ferri et al 2014 and Du et al 2015c). The 2D position decoding of the LG-SiPM is based on a combined capacitive/resistive current divider and a double quenching resistor in every SiPM microcell (Gola et al 2013). An LYSO scintillator array with a pitch of 0.53 mm was resolved using the early prototypes (Du et al 2015c), demonstrating the possibility of developing high resolution PET detector modules. However, this prototype SiPM had an active area of only 4 × 4 mm2 (with 45 μm microcells), which is impractical for building PET detector modules or PET scanners. Here, we use newly developed LG-SiPM devices with ~4 times the area and create a device with dimensions of 15.5 × 15.5 mm2 by tiling four of these devices together in a 2 × 2 array (Figure 1(a)). This array has a total area 15 times larger than the original devices. Each of the four LG-SiPM elements has an active area of 7.6 × 7.6 mm2 and a die size of 7.75 × 7.75 mm2, with 144,400 microcells (20 × 20 μm2 pitch), fabricated using FBK’s red-green-blue high density (RGB-HD) SiPM technology (Piemonte et al 2013). The reduced microcell size increased the microcell number per square millimeter, which increases the linear range of the SiPMs.
Figure 1.
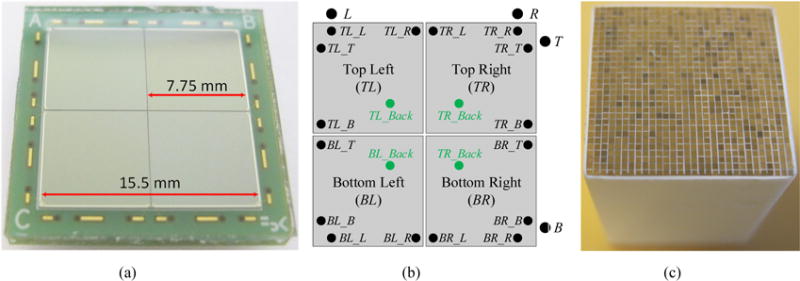
(a) photograph and (b) schematic of the 2 × 2 array of 7.75 × 7.75 mm2 LG-SiPMs, and (c) photograph of LYSO array. The abbreviations in (b) are explained in Table I.
In this study, the performance of a DOI-encoding detector module, consisting of a 30 × 30 array of 0.445 × 0.445 × 20 mm3 polished LYSO crystals coupled to LG-SiPM arrays at both ends, was evaluated for high resolution small-animal PET.
2 Materials and Methods
2.1. LG-SiPM array and LYSO-based DOI detector
The LG-SiPM arrays (Figure 1(a)) have a surface area of 15.5 × 15.5 mm2. Each LG-SiPM array is made up from four individual LG-SiPMs, arranged in a 2 × 2 configuration, with a 0.15 mm dead space between the active areas. Each LG-SiPM has an active area of 7.6 × 7.6 mm2 and provides four cathode signals from the top bonding pads and one common anode signal from the backside of the die. Each array therefore has 16 cathode signals and 4 anode signals (Figure 1(b)), thus for dual-ended readout there are a total of 32 cathode and 8 anode signals. The breakdown voltage of the LG-SiPMs is 28.0 V at 20 °C and these devices have a temperature coefficient of 26 mV/°C. The detector is completely covered with ~0.5 mm thick transparent resin layer to protect the bonding wires between the SiPMs and the pads on the printed circuit board (PCB).
The LYSO array (Figure 1(c)) has 30 × 30 polished 0.445 × 0.445 × 20 mm3 LYSO elements (Crystal Photonics, Inc., FL). 50 μm thick Toray reflector is used to separate the crystal elements, and optical glue is used to glue the crystals and reflector together. The pitch of the LYSO array is 0.50 mm. The front end and the back end of the LYSO array were coupled to the center of the LG-SiPM arrays using optical grease (BC-630, Saint-Gobain).
Performance in terms of energy resolution and flood histogram quality was evaluated at different bias voltages (from 33.0 V to 37.0 V, in 0.5V intervals) and at different temperatures (−10 °C,0 °C, 10 °C and 20 °C) to find the optimal working conditions. The timing resolution and DOI resolution were measured at a bias voltage of 35.0 V (optimal bias voltage for the flood histogram) and at different temperatures. The effect of the event rate on the performance of the detector module (flood histogram and energy resolution) was also investigated.
2.2 Readout electronics
To reduce the number of readout channels for further processing, multiplexing boards were designed. The concept is shown in figure 2. The 16 cathode signals from each LG-SiPM array were amplified individually using transimpedance amplifiers based on the AD8055 chip (ADI Inc.). The position encoding circuit receives the 16 amplified signals and reduces them to four position-encoding signals using the following formulae:
| (1) |
where the index i = 1, 2 refers to the two LG-SiPM arrays. The 8 position signals were fed into a spectrum amplifier (CAEN 7546B) for further shaping and digitized by a PowerDAQ board (PD2MFS, United Electronic Industries). The gamma photon interaction position, DOI information, and deposited energy were calculated using the following formulae:
| (2) |
| (3) |
| (4) |
where E1=L1+R1+T1+B1 and E2=L2+R2+T2+B2 are the energies measured by the two SiPM arrays from each gamma ray interaction. Equation 4 for determining the energy signal is based on our prior work (Ren et al 2014) for dual-ended readout.
Figure 2.
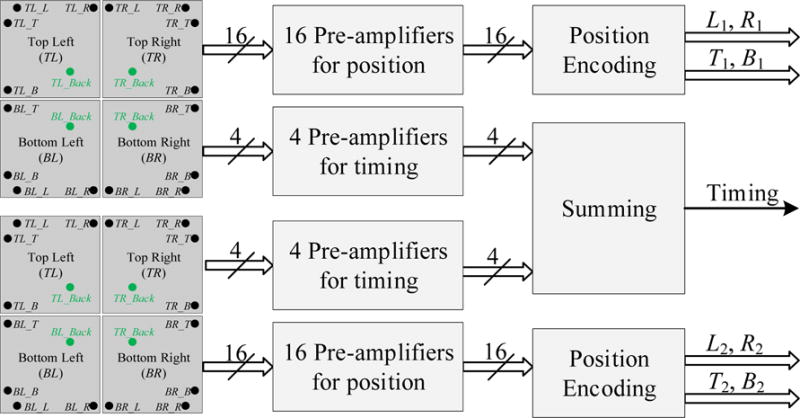
Block diagram of the multiplexing board.
The two LG-SiPM arrays were biased using a common power supply, split into 8 sources on the board. The 8 sources were individually filtered by π filters (C-L-C) to isolate the crosstalk effect from different LG-SiPMs (Du et al 2013). The 8 anode signals from the two LG-SiPM arrays were individually amplified using AD8045 (ADI Inc.) amplifiers and then summed together to form one global timing signal for the whole detector module, which was fed into a constant fraction discriminator (CFD, ORTEC 584) to generate a timing stamp and a trigger for the DAQ board.
2.3 Flood histogram measurements
A 35 μCi 68Ge source, located 40 mm above one end of the LYSO array was used to irradiate the crystals, and a 250–650 keV energy window was applied to the segmented crystal data to select events. To quantitatively compare flood histograms, a flood histogram quality metric, described in Du et al 2016, was calculated. Briefly, for each crystal in the array, a flood histogram quality parameter ki was calculated as the ratio of the separation to the width of the crystal spots corresponding to neighboring crystals in the flood histogram. The average (k) and standard deviation (σk) of all ki was used as a measure of the flood histogram quality. A higher value of k and a smaller value of σk are indicative of a better resolved flood histogram.
| (5) |
The event rate was ~18 kcps during these measurements, including the 1 kcps rate caused by the background radiation from LYSO.
2.4 Energy resolution measurements
Using the data obtained for the flood histograms, energy spectra were extracted for each crystal in the LYSO array. The energy resolution for each crystal was calculated as the FWHM of the centroid of the Gaussian fit to the 511 keV photopeak of the energy spectra. The average and standard deviation of the energy resolution of all 900 crystals were used as a measure of energy resolution for the whole crystal array at a given bias voltage and temperature.
2.5 DOI resolution measurements
The DOI resolution was measured at a bias voltage of 35.0 V (the optimal bias voltage determined in section 2.3) using a reference detector consisting of a photomultiplier (PMT) (Hamamatsu R12844-10) and a 0.5 × 20 × 20 mm3 LYSO slab, as shown in figure 3. The PMT signal was amplified by a transimpedance amplifier based on the AD8045 and then fed into a CFD (ORTEC 584) for time pick-off. The two trigger signals (from the PMT detector and the DOI detector) were sent to a coincidence unit (Philips Scientific 756) with a coincidence window of 20 ns to select coincidence events. A 22 uCi 22Na source with an active diameter of 0.5 mm was used for the DOI measurement with distances between the reference detector source and detector as shown in figure 3. The DOI resolution was obtained at five depths, ranging from 2 mm to 18 mm, in 4 mm steps. A 250–650 keV energy window was applied to the segmented crystal data to select events.
Figure 3.

Experimental setup for DOI resolution measurements. Distance and object size are not to scale.
2.6 Timing resolution measurements
The timing resolution was measured using the same PMT coupled to a 16 × 16 × 16 mm3 LYSO cube. The PMT signal was also amplified by a transimpedance amplifier (AD8054) and then split into two parts: one was sent into the CFD (ORTEC 584) for time pick-off and the other was used to measure the energy deposited in the LYSO cube. The timing triggers from the reference detector and the DOI detector were used as the start and the stop signal for the TAC (ORTEC 566) respectively. The timing resolution of each individual crystal in the LYSO array was calculated as the FWHM of a Gaussian fit to the timing spectrum of that crystal. A 250–650 keV energy window was applied to the data from each crystal in the LYSO array, whilst a 450–600 keV energy window was applied to the data from the reference detector to select events.
The coincidence timing resolution (CTRPMT-PMT) measured for two identical reference detectors was 445.5 ± 15.2 ps (with a 450–600keV energy window to select events). The estimated coincidence timing resolution (CTR) of two LG-SiPM based DOI detectors was calculated by subtracting in quadrature the contribution of the reference detector using the following equation:
2.7 Event rate effect
To investigate the effect of event rate on the detector performance, a 16 × 16 × 8 mm3 phantom filled with 800 uCi of 18F was used to irradiate the detector module. The distance between the source and the front face of the LYSO array was ~ 45 mm, corresponding to a PET scanner with a crystal face to face distance of 90 mm. Coincidence events were acquired using a reference detector, consisting of a PMT and a 16 × 16 × 32 mm3 LYSO crystal. The flood histogram and energy resolution were measured for 20 hours as the source decayed at a bias voltage of 35.0 V and a temperature of −10 °C.
3. Results
3.1 Flood histograms
Figure 4 shows the flood histograms obtained at a bias voltage of 35.0 V and as a function of temperature. Visually, better flood histograms were obtained at lower temperatures, due to the lower noise of the SiPMs (Piemonte et al 2013). All the crystals in the LYSO array can be resolved, even at 20 °C, including those crystals coupled over the 0.15 mm deadspace between LG-SiPMs.
Figure 4.

Flood histograms obtained at (a) −10 °C, (b) 0 °C, (c) 10 °C and (d) 20 °C and at an bias voltage of 35.0 V. A 250-650 keV energy window was applied to each crystal to select events.
The flood histogram quality metric obtained at different bias voltages and at different temperatures is shown in figure 5. In agreement with the visual appearance in figure 4, better flood histogram quality values were obtained at lower temperature, and this parameter first increases and then decreases as bias voltage increases, due to the competition between noise (both primary and correlated), gain and photodetection efficiency (PDE) of the SiPMs at different bias voltages (Piemonte et al 2013). For a given temperature, the best flood histogram values were all obtained at a bias voltage of 35.0 V. However, differences were quite small between 34.0 V and 36.0 V. Flood histograms were also obtained at bias voltages lower than 33.0 V, however, the crystals coupled over the dead space can no longer be resolved, hence, the results are not shown here. The best flood histogram quality value was 2.7 ± 0.4, obtained at a bias voltage of 35.0 V and at a temperature of −10 °C.
Figure 5.
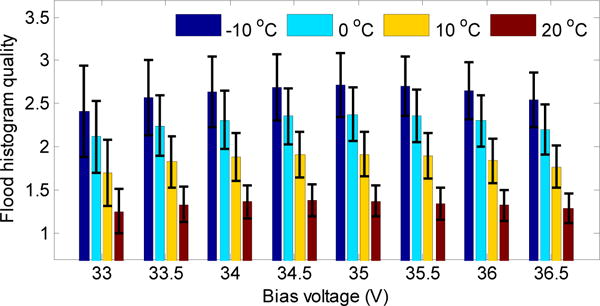
Flood histogram quality versus bias voltage and temperature. The error bars show ± 1σ of the flood histogram quality distribution.
3.2 Energy resolution
Figure 6(a) shows the energy spectra obtained from a corner, edge and center crystal, figure 6(b) shows the energy resolution, and figure 6(c) shows the normalized 511 keV photopeak position for each individual crystal in the LYSO array. Data were obtained at a bias voltage of 35.0 V and a temperature of −10 °C. The energy spectra, energy resolution, and 511 keV photopeak position are all crystal-dependent, due to varying degrees of light loss among different crystals in the array. An obvious cross-structure corresponding to the dead space among LG-SiPMs can be seen in figures 6(b) and (c). The dead space causes worse energy resolution due to the reduced light collection.
Figure 6.
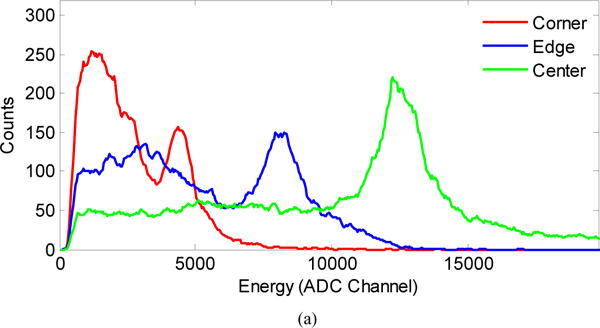
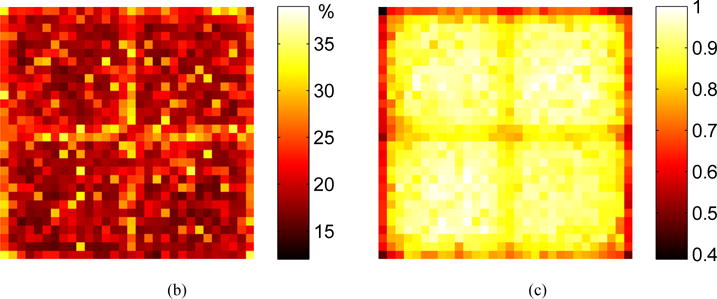
Measured (a) energy spectra from a corner, edge and center crystal, (b) energy resolution and (c) 511 keV photopeak position for each individual crystal obtained at a bias voltage of 35.0 V and a temperature of −10 °C.
The average crystal energy resolution across the LYSO array obtained at different bias voltages and at different temperatures is shown in figure 7. The energy resolution has only minor variations with respect to these two parameters, confirming that the limiting factor is not the photodetector array but the statistical variation of photons collected from the high aspect ratio crystals. The energy resolution was not corrected for saturation. The effect of saturation was not significant as the microcell pitch size is only 20 μm and scintillation photons were collected from both ends. There were ~1250 microcells directly under each crystal element. The average energy resolution was ~22% and did not show strong fluctuations. The range in energy resolution values across all crystals is high due to the variations in light collection efficiency.
Figure 7.
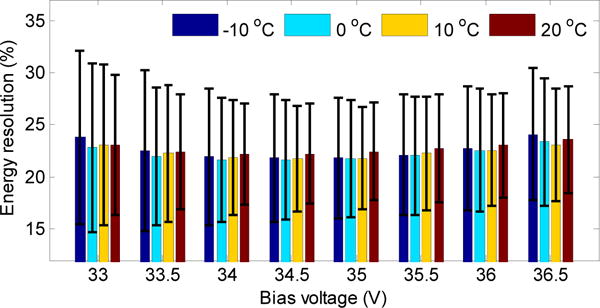
Energy resolution versus bias voltage and temperature. The error bars show ± 1σ of the energy resolution distribution.
3.3 DOI resolution
Figure 8(a) shows histograms of the DOI ratio (equation (3)) for a central crystal measured at five depths and at a temperature of −10 °C. Figure 8(b) shows the DOI resolution (FWHM) averaged across the five depths for each crystal. Figure 8(c) shows the DOI resolution averaged over all depths for all crystals in the LYSO array. The average DOI resolution and standard deviation both increase as the temperature increases, due to increases in the noise of the SiPM. However, the variation of average DOI resolution was small, ranging from 3.8 ± 1.2 mm at −10 °C to 4.3 ± 1.5 mm at 20 °C.
Figure 8.
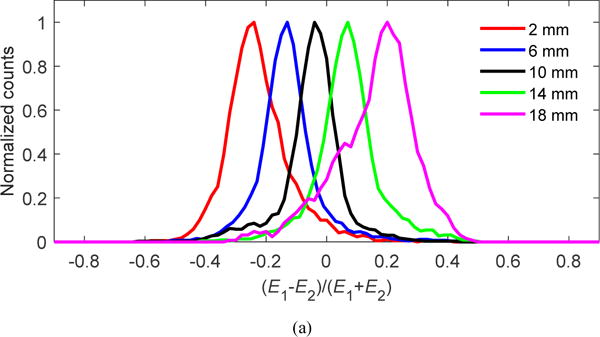
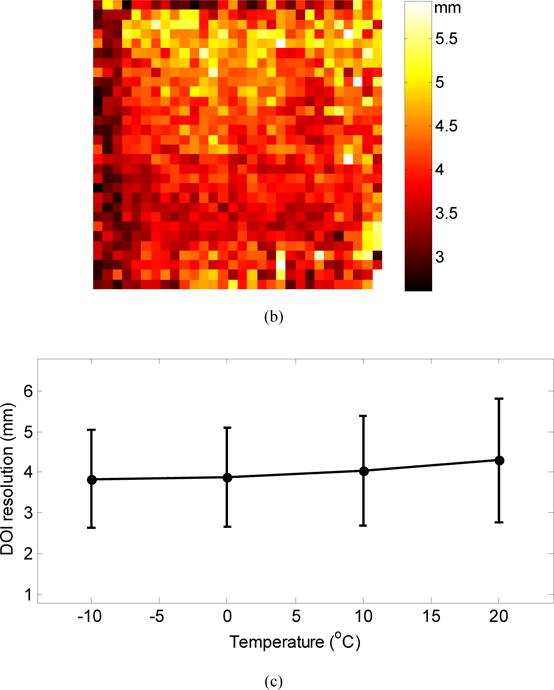
(a) Histogram of DOI ratio values for a central crystal; (b) DOI resolution (FWHM) for each crystal in the LYSO array obtained at a temperature of −10 °C; (c) average DOI resolution over all crystals and depths versus temperature. The error bars show ± 1σ of the DOI resolution distribution.
3.4 Timing resolution
The timing spectra of three crystals (corner, edge and center) are shown in figure 9(a), and the timing resolution for each crystal in the LYSO array is shown in figure 9 (b). They were obtained at a bias voltage of 35.0 V and a temperature of −10 °C. The peak position of the timing spectra were crystal-dependent, however, the shift of this peak position was small (< 0.2 ns). The timing resolution was also crystal-dependent (figure 9 (b)), the timing resolution of the central crystals were better, reflecting the signal amplitude distribution shown in figure 6 (b).
Figure 9.
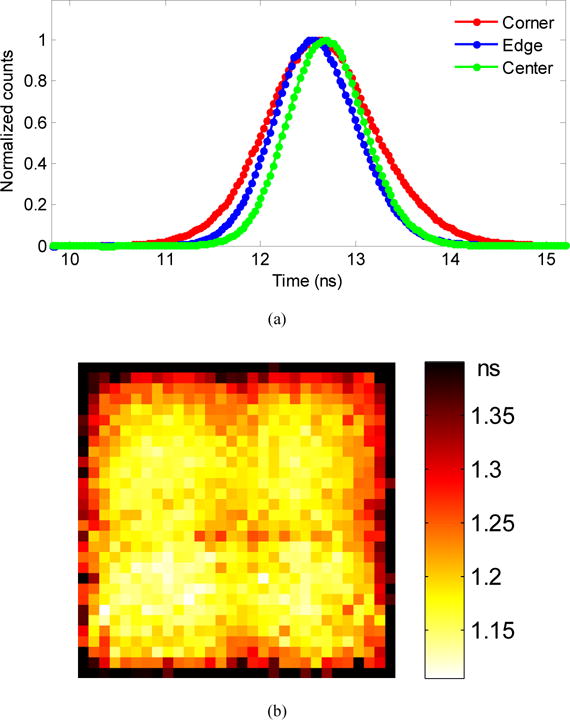
(a) timing spectra of three crystals, obtained at a bias voltage of 35.0 V and a temperature of −10 °C, and (b) coincidence timing resolution (calculated from equation 6) for each crystal.
The estimated average timing resolution across the whole LYSO array degraded as temperature increases (figure 10), due to increasing noise levels at higher temperatures. The average timing resolution obtained at −10 °C was 1.23 ± 0.10 ns. Better timing resolution could likely be obtained by optimizing the bias voltage for timing and changing the readout methods, however, this level of timing is already sufficient for the intended applications in high-resolution, non-time-of-flight PET.
Figure 10.
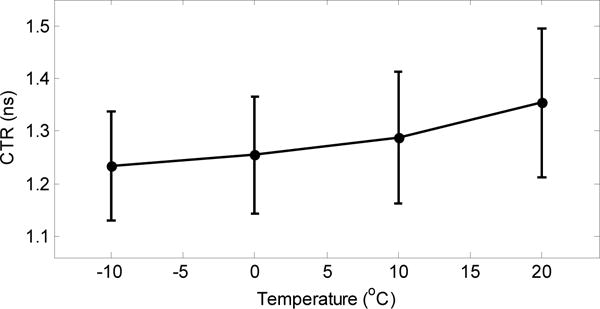
Average coincidence timing resolution at different temperatures. The error bar for the average timing resolution is the standard deviation across all the crystals.
3.5 Effect of event rate
The flood histograms obtained at different event rates ranging from 7.8 kcps to 132 kcps are shown in figure 11. The estimated corresponding 18F activity range was from 11.2 uCi to 305 uCi. The flood histogram quality metric and the energy resolution for different event rates are shown in figure 12 and figure 13 respectively. The flood histogram and the energy resolution degraded as the event rate increased due to factors such as pulse pile-up and after pulsing of the SiPM. However, all the crystals could be clearly resolved at an event rate of 132 kcps.
Figure 11.

Flood histogram obtained at an event rate of (a) 7.8 kcps, (b) 49.7 kcps, (c) 101 kcps and (d) 132 kcps. The estimated corresponding 18F activities were 11.2, 109, 230 and 305 uCi. The bias voltage was 35.0 and temperature was −10 °C. A 250–650 keV energy window was applied to each crystal to select events.
Figure 12.
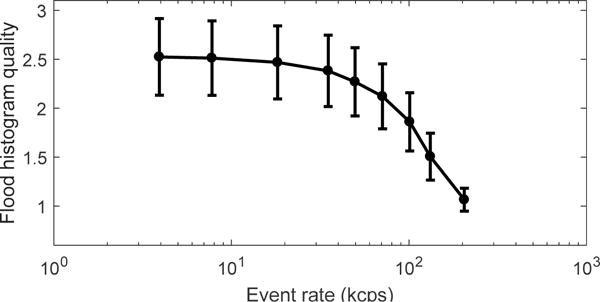
Flood histogram quality obtained at different event rates.
Figure 13.
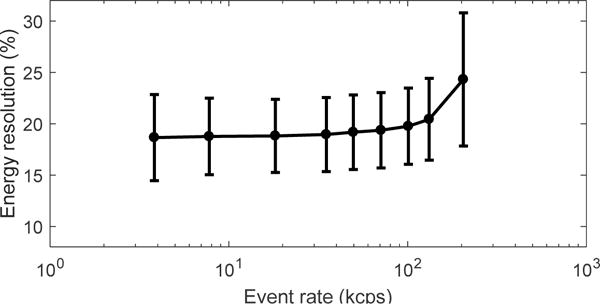
Energy resolution obtained at different event rates.
4. Discussion
The performance of a DOI encoding PET detector module was evaluated for ultra-high resolution PET. The detector module consists of a 30 × 30 array of 0.45 × 0.45 × 20 mm3 LYSO crystals and two 2 × 2 arrays of LG-SiPMs. Using the multiplexed readout method, the 40 cathode signals and 8 anode signals were reduced to 8 signals for position information and 1 signal for timing information, dramatically reducing the number of readout channels and greatly simplifying the electronics, allowing the LG-SiPM array to be treated as an individual large-area SiPM module. The reduction in the number of readout channels is significant, which is a major factor when contemplating a scanner based upon those detectors.
The flood histograms showed that all the crystals in this high-resolution LYSO array can be resolved, even at room temperature (20 °C). The average energy resolution was ~22%, which is worse than our previous study (Du et al 2015c), due to the higher aspect ratio of crystal elements used in this study and the dual-ended readout method used to obtain DOI information (Yang et al 2010 and Yamamoto et al 2013). The use of Toray reflector, which reduces the light collection efficiency (but helps improve DOI resolution), also contributed to the worse energy resolution. The energy resolution obtained using coincidence events (figure 13) was better than those obtained using single events (figure 7), due to the removal of the contribution of background events from LYSO to the energy resolution. The DOI resolution was 3.8 ± 1.2 mm and the timing resolution was 1.23 ± 0.10 ns at −10 °C, which are excellent results for such small cross-section crystals. The counting rate tests demonstrated that the detector module can handle event rates up to 130 kcps without significant performance degradation, corresponding to ~300 uCi 18F located ~45 mm away from the crystal surface. This is sufficient for preclinical PET applications where the standard injected dose for a mouse is ~100 uCi. However, if needed, higher event rates can likely be handled by restoring the baseline of the signal (Li et al 2010), a method which was not implemented in our current readout electronics.
The timing resolution, while sufficient for the intended application in small-animal PET, is significantly worse than that achieved with SiPMs fabricated with a similar technology (Ferri et al 2014). In this study, a number of factors limit the timing performance. The first is the large active area of the photodetector and the very small cross-section (0.2 mm2) and high aspect ratio (~44) crystal geometry. The second factor is the use of a CFD discriminator for time pick-off, which does not allow triggering at a low level for optimal timing. However, the use of a CFD automatically compensates for pulse amplitude variations, and is a very practical approach for a complete PET system. Finally, the small cell size of 20 μm in these SiPMs leads to a lower fill factor and, thus, lower PDE. However, for reading out small crystal elements, the use of a small cell size provides other advantages, such as a reduction in the SiPM non-linearity.
Pixelated SiPM arrays, for example arrays of ~ 3 × 3 mm2 SiPMs, have also been used to build high-resolution PET detectors for small-animal applications (Yamamoto et al 2013 and Yamamoto et al 2016) and have demonstrated the capability to resolve 0.5 mm pitch scintillator arrays. However, in order to resolve all the crystals, the dimensions of the scintillator arrays are typically smaller than the size of the SiPM arrays due to truncation of the light distribution at the edge of the device. Even using a light guide, a region of ~2–3 mm exists around the edge of the SiPM array where the 0.5 mm crystals cannot be resolved. This causes a large dead space between detector modules, which will ultimately degrade sensitivity in any scanner design.
The multiplexing readout used here combines the noise of the four LG-SiPMs and also increases detector pile-up. This reduces the performance of the detector module, particularly in terms of event rate capability and timing resolution. If better performance is required, the signals from each LG-SiPM could be read out individually, reducing the count rate per module by a factor of 4. Improvements in the readout electronics or pulse processing, also can be implemented to reduce pulse pileup.
To our knowledge, this is the largest DOI-encoding detector module developed to date based on PS-SiPMs. Several PS-SiPM-based depth-encoding PET detector modules have been investigated previously, however, the PS-SiPMs had a size less than 10 × 10 mm2, impractical for building usable PET detector modules or PET scanners (Schmall et al 2012 and Du et al 2013). Position sensitive avalanche photodiodes (PS-APDs) were also successfully used for building depth-encoding PET detectors and scanners (Yang et al 2006, Yang et al 2009 and Yang et al 2016), however, the gain of PS-APDs are lower than SiPMs and the timing resolution was inferior to that obtained in this paper (Wu et al 2009). Other high-resolution designs read out by non position-sensitive SiPMs have been evaluated, however the crystal lengths typically have been < 10 mm (e.g. Yamamoto et al 2013) and edge crystals are often not resolved, or a gap is left around the edge of the array (Yamamoto et al 2013 and Du et al 2015). This paper used thick LYSO arrays (20 mm) with a packing fraction (crystal array size relative to SiPM array size) of 0.94. However, currently, the LG-SiPMs are mounted on a bulky printed circuit board which impedes close packing of multiple modules into detector rings for a scanner. Future developments will address this issue enabling this design to be considered for incorporation into future high-resolution preclinical PET scanners. We also are studying pathways to developing even larger area LG-SiPM devices (e.g. 16 × 16 mm2), potentially leading to detector modules suitable for larger-scale human PET systems, for example, for dedicated brain and breast imaging systems.
5. Conclusion
A high-resolution detector module for small-animal PET was developed using position sensitive LG-SiPM arrays coupled to both ends of an LYSO array with a pitch size of 0.5 mm and a thickness of 20 mm. A multiplexed readout method was applied to reduce the complexity and cost of the readout electronics. All the crystals in the LYSO array were clearly resolved and the detector module has a packing fraction (crystal array size relative to SiPM array size) of 0.94. The high packing fraction makes it possible to minimize the dead space between detector modules to improve the sensitivity of a PET scanner.
Table I.
Summary of the abbreviations shown in Figure 1(b).
| Abbreviation | Description | Abbreviation | Description |
|---|---|---|---|
| TL_L | Left cathode signal of top left SiPM | TR_L | Left cathode signal of top right SiPM |
| TL_R | Right cathode signal of top left SiPM | TR_R | Right cathode signal of top right SiPM |
| TL_T | Top cathode signal of top left SiPM | TR_T | Top cathode signal of top right SiPM |
| TL_B | Bottom cathode signal of top left SiPM | TR_B | Bottom cathode signal of top right SiPM |
| BL_L | Left cathode signal of bottom left SiPM | BR_L | Left cathode signal of bottom right SiPM |
| BL_R | Right cathode signal of bottom left SiPM | BR_R | Right cathode signal of bottom right SiPM |
| BL_T | Top cathode signal of bottom left SiPM | BR_T | Top cathode signal of bottom right SiPM |
| BL_B | Bottom cathode signal of bottom left SiPM | BR_B | Bottom cathode signal of bottom right SiPM |
| TL_Back | Anode signal of top left SiPM | TR_Back | Anode signal of top right SiPM |
| BL_Back | Anode signal of bottom left SiPM | BR_Back | Anode signal of bottom right SiPM |
Acknowledgments
This work was funded by NIH grant R01 EB019439.
References
- Li C, Wang S, Huo L, Wang Y, Liang K, Yang R, Han D. Position sensitive silicon photomultiplier with intrinsic continuous cap resistive layer. IEEE Trans Electron Devices. 2014;61:3229–3232. [Google Scholar]
- Cherry SR, Shao Y, Silverman RW, Meadors K, Siegel S, Chatziioannou A, Young JW, Jones WF, Moyers JC, Newport D, Boutefnouchet A, Farquhar TH, Andreaco M, Paulus MJ, Binkley DM, Nutt R, Phelps ME. MicroPET: A high resolution PET scanner for imaging small animals. IEEE Trans Nucl. 1997;44:1161–1166. [Google Scholar]
- Du J, Schmall J, Yang Y, Di K, Judenhofer M, Bec J, Buckley S, Jackson C, Cherry SR. Design and optimization of a high-resolution PET detector module for small-animal PET based on a 12 × 12 silicon photomultiplier array. Bio Phys & Eng Express. 2015a;1:045003. [Google Scholar]
- Du J, Schmall J, Yang Y, Di K, Dokhale P, Shah KS, Cherry SR. A simple capacitive charge-division readout for position-sensitive solid-state photomultiplier array. IEEE Trans Nucl Sci. 2013;60:3188–3197. doi: 10.1109/TNS.2013.2275012. [DOI] [PMC free article] [PubMed] [Google Scholar]
- Du J, Schmall J, Yang Y, Di K, Roncali E, Mitchell G, Buckley S, Jackson C, Cherry SR. Evaluation of Matrix9 silicon photomultiplier array for small-animal PET. Med Phys. 2015b;42:585–599. doi: 10.1118/1.4905088. [DOI] [PMC free article] [PubMed] [Google Scholar]
- Du J, Yang Y, Bai X, Judenhofer S, Berg E, Di K, Buckley S, Jackson C, Cherry SR. Characterization of large-area SiPM array for PET applications. IEEE Trans Nucl Sci. 2016;63:8–16. doi: 10.1109/TNS.2015.2499726. [DOI] [PMC free article] [PubMed] [Google Scholar]
- Du J, Yang Y, Berg E, Bai X, Gola A, Ferri A, Zorzi N, Piemonte C, Cherry SR. Evaluation of linearly-graded SiPMs for high resolution small-animal PET. Bio Phys & Eng Express. 2015c;1:045008. [Google Scholar]
- Ferri A, Acerbi F, Gola A, Paternoster G, Piemonte C, Zorzi N. Characterization of linearly graded position-sensitive silicon photomultipliers. IEEE Trans Nucl Sci. 2015;62:688–693. doi: 10.1186/2197-7364-1-S1-A14. [DOI] [PMC free article] [PubMed] [Google Scholar]
- Ferri A, Gola A, Serra N, Tarolli A, Zorzi N, Piemonte C. Performance of FBK high-density SiPM technology coupled to Ce: LYSO and Ce: GAGG for TOF-PET. Phys Med Biol. 2014;59:869–880. doi: 10.1088/0031-9155/59/4/869. [DOI] [PubMed] [Google Scholar]
- Gola A, Ferri A, Tarolli A, Zorzi N, Piemonte C. A novel approach to position-sensitive silicon photomultipliers: first results. IEEE Nuclear Science Symp Medical Imaging Conf Rec. 2013:1–4. [Google Scholar]
- González A, Majewski S, Barberá J, Conde P, Correcher C, Hernández L, Morera C, Vidal L, Sánchez F, Stolin S, Benlloch J. Performance study of a wide-area SiPM array, ASICs controlled. IEEE Trans Nucl Sci. 2015;62:19–26. [Google Scholar]
- James S, Yang Y, Bowen S, Qi J, Cherry SR. Simulation study of spatial resolution and sensitivity for the tapered depth of interaction PET detectors for small animal imaging. Phys Med Biol. 2010;55:N63–74. doi: 10.1088/0031-9155/55/2/N04. [DOI] [PMC free article] [PubMed] [Google Scholar]
- James S, Yang Y, Wu Y, Farrell R, Dokhale P, Shah K, Cherry SR. Experimental characterization and system simulations of depth of interaction PET detectors using 0.5 mm and 0.7 mm LSO arrays. Phys Med Biol. 2009;54:4605–4619. doi: 10.1088/0031-9155/54/14/015. [DOI] [PMC free article] [PubMed] [Google Scholar]
- Li H, Wang C, Baghaei H, Zhang Y, Ramirez R, Liu S, An S, Wong W. A New statistics-based online baseline restorer for a high count-rate fully digital system. IEEE Trans Nucl. 2010;57:550–555. doi: 10.1109/TNS.2009.2036914. [DOI] [PMC free article] [PubMed] [Google Scholar]
- McClish M, Dokhale P, Christian J, Staples C, Johnson E, Robertson R, Shah KS. Performance measurements of CMOS position sensitive solid-state photomultipliers. IEEE Trans Nucl Sci. 2010;57:2280–2286. [Google Scholar]
- Piemonte C, Ferri A, Gola A, Pro T, Serra N, Tarolli A, Zorzi N. Characterization of the first FBK high-density cell silicon photomultiplier technology. IEEE Trans Electron Devices. 2013;60:2567–2573. [Google Scholar]
- Ren S, Yang Y, Cherry SR. Effects of reflector and crystal surface on the performance of a depth-encoding PET detector with dual-ended readout. Med Phys. 2014;41:072503. doi: 10.1118/1.4881097. [DOI] [PMC free article] [PubMed] [Google Scholar]
- Sacco I, Fischer P, Gola A, Piemonte C. Interpolating silicon photo-multiplier: a novel position sensitive device with submillimeter spatial resolution and depth of interaction capability. IEEE Nuclear Science Symp Medical Imaging Conf Rec. 2013:1–3. [Google Scholar]
- Schmall J, Du J, Yang Y, Dokhale P, McClish M, Christian J, Shah KS, Cherry SR. Comparison of large-area position-sensitive solid-state photomultipliers for small animal PET. Phys Med Biol. 2012;57:8119–8134. doi: 10.1088/0031-9155/57/24/8119. [DOI] [PubMed] [Google Scholar]
- Shao Y, Sun X, Lan K, Bircher C, Lou K, Deng Z. Development of a prototype PET scanner with depth-of-interaction measurement using solid-state photomultiplier arrays and parallel readout electronics. Phys Med Biol. 2014;59:1223–1238. doi: 10.1088/0031-9155/59/5/1223. [DOI] [PMC free article] [PubMed] [Google Scholar]
- Shimizu K, Uchida H, Sakai K, Hirayanagi M, Nakamura S, Omura T. Development of a multi-pixel photon counter module for positron emission tomography. IEEE Trans Nucl. 2013;60:1512–1517. [Google Scholar]
- Stickel J, Cherry SR. High-resolution PET detector design: modelling components of intrinsic spatial resolution. Phys Med Biol. 2005;50:179–195. doi: 10.1088/0031-9155/50/2/001. [DOI] [PubMed] [Google Scholar]
- Wu Y, Ng T, Yang Y, Shah K, Farrell R, Cherry SR. A study of the timing properties of position-sensitive avalanche photodiodes. Phys Med Biol. 2009;54:5155–5172. doi: 10.1088/0031-9155/54/17/006. [DOI] [PMC free article] [PubMed] [Google Scholar]
- Yamamoto S, Watabe H, Watabe T, Ikeda H, Kanai Y, Ogata Y, Kato K, Hatazawa J. Development of ultrahigh resolution Si-PM-based PET system using 0.32 mm pixel scintillators. Nucl Instrum Methods Phys Res A. 2016;836:7–12. [Google Scholar]
- Yamamoto S, Yeom J, Kamada K, Endo T, Levin CS. Development of an ultrahigh resolution block detector based on 0.4 mm pixel Ce:GAGG scintillators and a silicon photomultiplier array. IEEE Trans Nucl. 2013;60:4582–4587. [Google Scholar]
- Yamamoto S, Yeom J, Kamada K, Endo T, Levin CS. Development of an ultrahigh resolution block detector based on 0.4 mm pixel Ce:GAGG scintillators and a silicon photomultiplier array. IEEE Trans Nucl. 2013;60:4582–4587. [Google Scholar]
- Yang Y, Bec J, Zhou J, Zhang M, Judenhofer M, Bai X, Di K, Wu Y, Rodriguez M, Dokhale P, Shah K, Farrell R, Qi J, Cherry SR. A prototype high-resolution small-animal PET scanner dedicated to mouse brain imaging. J Nucl Med. 2016;57:1130–1135. doi: 10.2967/jnumed.115.165886. [DOI] [PMC free article] [PubMed] [Google Scholar]
- Yang Y, Dokhale P, Silverman R, Shah K, McClish M, Farrell R, Entine G, Cherry SR. Depth of interaction resolution measurements for a high resolution PET detector using position sensitive avalanche photodiodes. Phys Med Biol. 2006;51:2131–2142. doi: 10.1088/0031-9155/51/9/001. [DOI] [PubMed] [Google Scholar]
- Yang Y, Qi J, Wu Y, James S, Farrell R, Dokhale P, Shah K, Cherry SR. Depth of interaction calibration for PET detectors with dual-ended readout by PSAPDs. Phys Med Biol. 2009;54:433–445. doi: 10.1088/0031-9155/54/2/017. [DOI] [PMC free article] [PubMed] [Google Scholar]
- Yang Y, St James S, Wu Y, Du H, Qi J, Farrell R, Dokhale P, Shah K, Vaigneur K, Cherry SR. Tapered LSO arrays for small animal PET. Phys Med Biol. 2010;56:139–153. doi: 10.1088/0031-9155/56/1/009. [DOI] [PMC free article] [PubMed] [Google Scholar]
- Yang Y, Wu Y, Farrell R, Dokhale PA, ShahK S, Cherry SR. Signal and noise properties of position-sensitive avalanche photodiodes. Phys Med Biol. 2011;56:6327–6336. doi: 10.1088/0031-9155/56/19/011. [DOI] [PMC free article] [PubMed] [Google Scholar]


