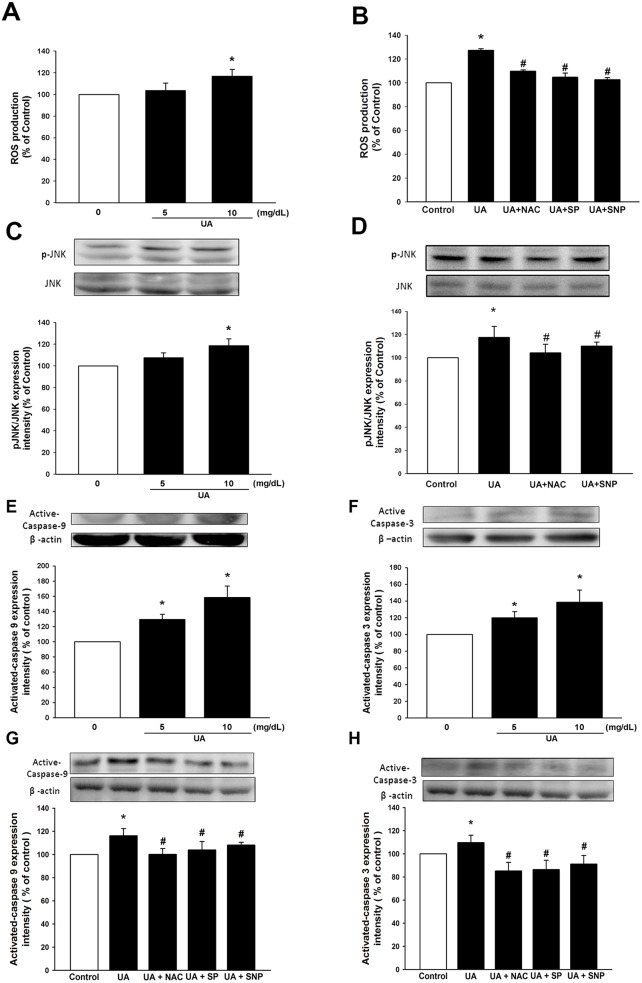
Figure 3. Uric acid induces ROS and active caspase 3, 9 through JNK pathway.
Cells were cultured and analyzed under different uric acid concentrations (0, 5, 10 mg/dL) and in the absence or presence of SNP (NO donor), NAC (antioxidant) and SP (SP600125, JNK inhibitor). (A, B) ROS production of EPC was assessed by staining with DCFH-DA. (C, D) Expression of JNK phosphorylation protein levels was assessed by western blot analysis. (E, F, G, H) Expression of active caspase-9 and caspase-3 protein levels was assessed by western blot analysis. Data are mean ± SEM; n=4; * P < 0.05 versus control; # P < 0.05 versus high-level uric acid (10 mg/dL).

