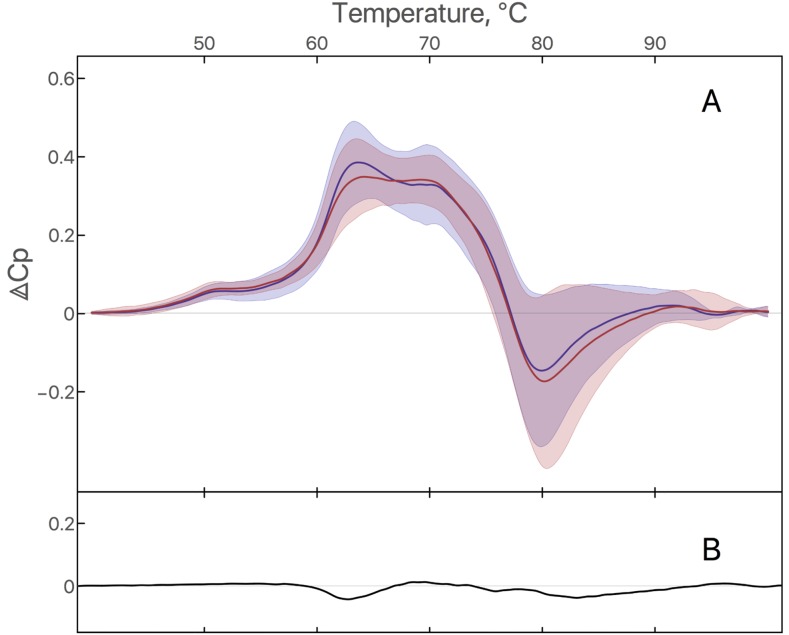
Figure 4.
(A) DSC signature of plasma from GB patients at D1 and D21: Average of plasma denaturation profiles from 17 GB patients at D1 (blue curve) and the same 17 GB patients at D21 (red curve). Filled area corresponds to standard deviation. (B) Difference between average of plasma denaturation profiles of GB patients at D21 and D1.

