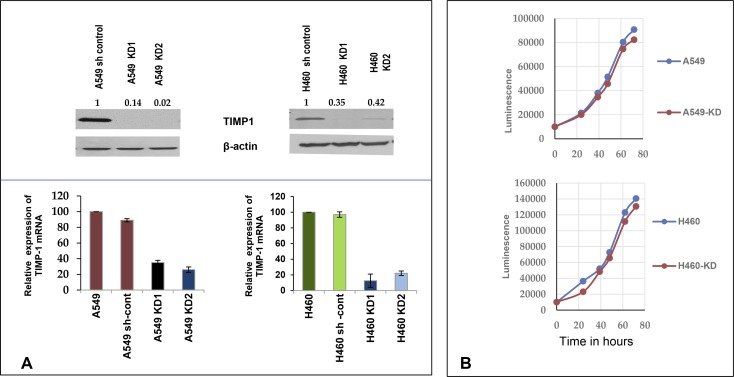
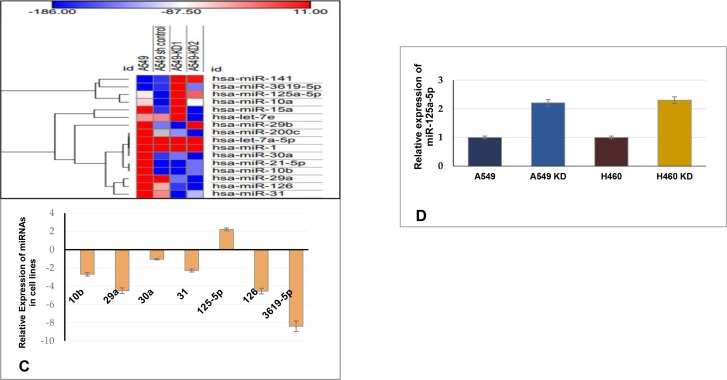
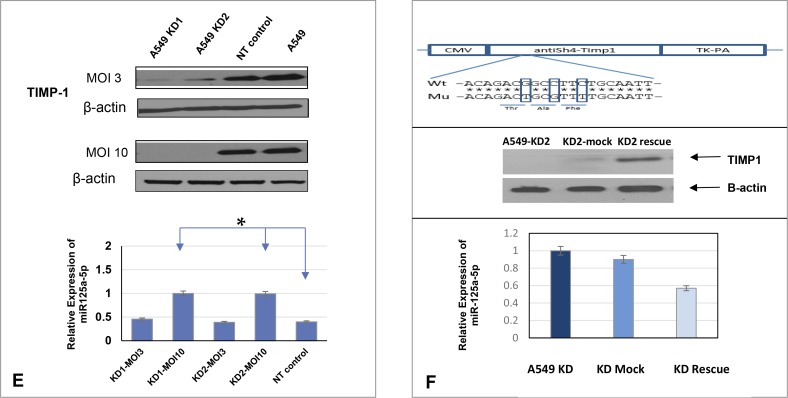
Figure 1. Knocking down TIMP-1 increases expression of miR-125a-5p.
(A) A549 and sh control cells with higher protein levels of TIMP-1 as demonstrated by representative western blot. The A549 TIMP-1 knockdown clones showed 80%–97% knockdown and the H460-KD clones showed about 70% knockdown of protein in an average of three experiments (top panel). Real-time polymerase chain reaction confirmed the down-regulation of TIMP-1 messenger expression. GAPDH primers were used for internal normalization with the sh controls set at 100%. The graphs are representative of average of 3 experiments ± SEM. (B) Cell doublings were studied in A549 and H460 and their clones; no significant changes were observed in the cell doubling times (average 18.5 hours). (C) Heat map of miRNA microarray (Affymetrix) expression data (fold change) in A549 and its knockdown clones was done by GENE-E (https://software.broadinstitute.org/GENE-E) through a web based tool Morpheus, showing chosen microRNA modulations. Hierarchical cluster analysis of miRNAs were done on the y axis, the legend on the right indicates miRNAs represented in the corresponding rows. The relative miRNA expression is depicted according to the color scale shown on top, red indicates upregulation and blue, downregulation. Lower panel: Expression of seven chosen miRNAs in A549 cell lines by qPCR (average of three replicates), based on microarray data. Only miR-125a-5p showed upregulation with TIMP-1 knockdown. (D) Confirmation of miR-125a-5p expression in A549 and H460 TIMP-1 knock-down cell lines. miR-125a-5p showed more than 2 fold upregulation with TIMP-1 knockdown; small nuclear RNA U6 was used as a reference gene to normalize the data. Figures are representation of three independent experiments ± SEM. (E) Differential expression of miR-125a-5p in A549 cells due to different MOI of infection by shTIMP-1 lentivirus particles. Representative western blot of TIMP-1 expression normalized to actin is shown (top panel). The bottom panel represents miRNA expression, small nuclear RNA U6 was used as a reference gene. Values are representative of 3 independent experiments (mean ± SEM; *P < 0.05, Student t test). (F) Rescue experiments were performed by co-transfecting with mutated TIMP-1 plasmid. Downregulation of miR-125a-5p in the rescued cells was verified by qPCR. Topmost panel shows design of plasmid construction followed by representative western blot of TIMP-1 expression. The bottom panel shows the average expression of miR-125a-5p transcript conducted in triplicate after rescue experiment.


