

Introduction
Both community-based and laboratory derived data demonstrate that breath alcohol concentrations (BrACs) below the legal limit (.08%) negatively affect performance on a variety of neurobehavioral tasks (Abroms & Fillmore, 2004; Gilbertson et al., 2009) including driving (Calhoun & Pearlson, 2012; NHTSA, 2015, Weafer & Fillmore, 2011; Sklar et al, 2014). Controlled laboratory studies have shown that doses below .065% impact control of speed and steering (Harrison & Fillmore, 2011; Mets et al., 2011; Raemaker et al., 2000) with some suggesting impairments as low as .02% (Irwin et al., 2017). Of interest, delayed responses to relevant stimuli [e.g. red traffic light, potential collisions (Allen et al., 2009; Fillmore et al., 2008; Liu & Ho, 2010)] are also observed under the effects of acute low dose alcohol.
Inappropriate braking reflected in the failure to activate braking with sufficient time and/or pressure to avoid a collision or stop at a light is relatively easy to ascertain and of obvious importance. A second category of inappropriate braking, referring to slowing or braking when unwarranted by current traffic conditions, is equally pertinent and noted as one of the most common behaviors of unsafe drivers (Klauer et al., 2009). To our knowledge, this second category has been examined in alcohol research only in a landmark study by Quillan and colleagues (1999). In that study, BrACs of ≥ .08% were found to increase the frequency of inappropriate braking in an acceleration zone. It is noteworthy that this category of braking has not been assessed at BrACs below .08% or in response to discrete stimuli (i.e. irrelevant stimuli). Given its role in traffic safety, it is essential to examine the effects of low and moderate doses (< .08%) on this braking behavior.
Also meriting programmatic study are the differential effects of acute alcohol on older and younger drivers. There is a substantive literature demonstrating age-related differences in driving simulator performance. Older drivers (≥ 55 years of age) show greater variability in speed and steering as well as impairments in appropriately responding to relevant stimuli (Quillian et al., 1999; Bunce et al., 2012; Polatsek et al., 2012; Reimer et al., 2012). The literature suggests that in order to reconcile these differences in driving behavior older adults adopt compensatory strategies. In some cases, they will limit the environments in which they drive. In others, they may modify their driving behavior [e.g. allowing longer headway time to respond (Andrews & Westerman, 2012; Molnar & Eby, 2008; Walker et al., 1997)]. With the exception of Quillian et al. and our own laboratory (Sklar et al., 2014; Lewis et al., 2016), the large majority of alcohol driving studies engage adult drinkers under the age of 55. Given the increasing numbers of older drinkers (Breslow et al., 2017) and hence an increasing number of older drinkers who drive, integrated studies of aging and alcohol on driving are needed.
Our prior reports on the interaction of age and alcohol on driving revealed differential susceptibility among older adults. In a simulated driving protocol where BrACs were between approximately .03 and .06, older adults exhibited greater deviations in speed and steering than did age cohorts receiving placebo (Sklar et al, 2014). Importantly, younger adults driving behaviors were not affected at these doses. When we examined neural oscillations during the drive, we found that older and younger drivers exhibited divergent patterns of neural activation. Although, posterior alpha power (PAP) was equivalent for older and younger adults receiving placebo doses, it was higher for older drivers receiving a low dose of alcohol relative to placebo, but lower for younger drivers relative to placebo. This pattern suggested a differential engagement of inhibitory processing under alcohol conditions by age. (Lewis et al., 2016). Given this finding, we wanted to examine responding to specific contextual stimuli which were either relevant or irrelevant within the driving scenarios.
Older and younger adults' responses to relevant (i.e., potential collision-inducing objects) and irrelevant stimuli (i.e., stationary objects not in roadway) were assessed before and after acute alcohol consumption. We expected baseline effects of age, with older adults displaying diminished responses to relevant stimuli and an inability to withhold responses to irrelevant stimuli relative to young adults, as well as overall alcohol-related deficits during the study session. More importantly, consistent with our previous work, we anticipated an age by alcohol interaction showing greater alcohol-induced impairments in older adults' ability to appropriately respond to relevant and irrelevant stimuli. We were also interested in whether outcomes would vary between two sub-intoxicating doses (.04% and .065%).
Methods
Participants
Eighty-six young (25-35 years of age) and 41 older (55-70 years of age) nonsmoking social drinkers [i.e. ≤2 drinks per day for men under the age of 65, ≤1 drink per day for men 65+ years and women of all ages (USDA, 2010)] completed this portion of the study. Following removal of outliers on the driving measures [n=10, as determined by Cook's D >.32 (Cook, 1977)] and participants who failed to adhere to driving guidelines (n=3, average speed >2 SDs), a smaller sample of young adults was randomly selected within dose and sex for the purposes of these analyses. The final sample included 33 participants in each age group (11 moderately-dosed, 12 low-dosed, and 10 placebo). The sample was 42% female and 75% Caucasian.
Screening
Participants were recruited from the community via flyers, radio and newspaper ads, and word-of-mouth. Informed consent was obtained prior to screening per the University of Florida's IRB guidelines.
Screening questionnaires consisted of basic demographic and health information, alcohol use questionnaires [average ounces of absolute alcohol consumed per day over previous 6 months, (as derived by the quantity-frequency index, QFI) and the maximum alcohol consumption for a single drinking episode (Max-Q) over the previous 6 months (Cahalan et al., 1969)], questionnaires on driving habits, state anxiety [Speilberg State Anxiety Inventory (STAI), (Spielberger 1983)] and depression [Beck Depression Inventory (BDI-II) for young (Beck et al., 1996) and Geriatric Depression Scale (GDS) (Yesavage et al., 1982) for older participants]. Older adults were also screened for possible cognitive deterioration [≥27 on the Mini-Mental State Exam [(MMSE) (Folstein, Folstein, & McHugh, 1975); ≤15 on Hopkins Verbal Learning Task (HVLT) (Benedict et al., 1998)]. All participants were in good health, had at least 12 years of education, and held an active driver's license.
A computerized clinical research interview based on the DSM-IV criteria for Axis I disorders [cDIS; (Robins et al., 1995)] screened for probabilistic psychiatric diagnoses. Exclusionary psychiatric diagnoses included a) current or lifetime diagnosis of alcohol or substance dependence, b) lifetime diagnosis of any psychotic disorder, c) current diagnosis of major depressive disorder or past use of electroconvulsive shock therapy. Further exclusionary criteria included medical disorders associated with neurocognitive alterations (e.g., epilepsy), women who were pregnant or nursing, and use of medications that contraindicated alcohol use. Use of other over-the-counter and prescription medications such as birth control, cholesterol medication, ≥3-month stabilized dose of serotonin-selective or serotonin-norepinephrine reuptake inhibitors, and antihypertensives was permitted.
Following screening, participants completed a 5-minute familiarization task in the driving simulator to become accustomed to the controls followed by a 20-minute drive that served as the baseline described below.
Alcohol Administration
Participants were randomly assigned within age group to receive a beverage dosed to achieve peak BrAC of 0.0%, 0.04%, or 0.065%. Prior to the study session, participants were instructed to (a) abstain from alcohol for 24 hours, (b) fast for 4 hours prior to the appointment, and (c) avoid sedating over-the-counter allergy or sinus medication on the morning of testing. Participants arrived at the laboratory at approximately 9:30 AM and provided written consent for the study session procedures. Breathalyzer testing, urine drug screen, and urine pregnancy test (for female participants) were collected to confirm eligibility.
Participants received a light (220 kcal) breakfast prior to alcohol consumption. Alcohol dose was calculated for each individual using a modified version of the Widmark equation (Watson et al., 1981), which accounts for age, sex, and body weight. Per standard procedure (Fillmore et al., 2000), alcohol was prepared with 355 mL of sugar-free, caffeine-free lemon-lime soda and given as two separate drinks. Beverages were lightly misted with a negligible amount of alcohol to enhance placebo effectiveness. The participants were given 5 minutes to consume both beverages with one minute between drinks. Beverages were administered 60 minutes prior to the driving task in order to capture the descending limb of sub-intoxication. These time points and BrACs were selected to mimic socially relevant scenarios in which an individual might operate a motor vehicle.
BrAC measurements were collected throughout the study session. Twenty-five minutes after initial consumption participants were administered a third beverage of equal volume. If participants were below 50% of their desired peak BrAC, the beverage contained half of the original dose. If BrAC was at least 50% of target or participant was in the placebo group, the beverage did not contain alcohol. No participants in the moderate dose group received a booster containing alcohol. Three participants in the low-dose group (1 young male, 1 older male, 1 young female) received boosters containing alcohol. Upon starting the drive, booster-receiving participants' BrACs did not exceed .04%. Excluding these participants did not alter the significance, thus they were retained.
Research procedures were conducted by an investigator blinded to dose conditions. Beverage preparation and BrAC testing were conducted by an investigator not participating in data collection. BrAC readings were obscured from participants and blinded investigators.
During breath sampling, participants reported their self-perceived level of intoxication and impairment using 10-point Likert scales anchored from “not at all intoxicated” and “no impairment” to “most intoxicated imaginable” and “extreme impairment”. Following the driving task, participants reported whether they believed they received the placebo or alcohol beverage. Those who had received active doses of alcohol relaxed in the lab lounge until their BrAC returned to ≤ 0.01%. Participants were compensated $120 and driven home by lab personnel.
Driving Simulator
Driving performance was measured using a STISIM Drive Systems simulator (Systems Technology, Hawthorne, CA) in a sound attenuated room. The scenes were presented to the participant on 3 screens for panoramic visualization. The simulator was equipped with accelerator and brake pedals, and a steering wheel. A speedometer and mirrors were presented on the screens. Vehicle sounds as well as driving instructions were presented over a speaker system. Participants were instructed to maintain their lane position, follow speed restrictions posted throughout the drive and to follow audio instructions presented by the simulator.
The task consisted of three scenarios (country, small town, and metropolis) and lasted approximately 20 minutes. For the current project, epochs obtained in two of the scenarios, country and metropolis, were analyzed. The small town scenario was excluded due to overlap in the epochs collected (i.e., 450 ft. prior to stimulus). The country scenario had a speed limit of 55 mph and included stop lights, left and right turns, and oncoming traffic. The metropolis was a more visually complex environment. It was categorized by a 35 mph speed limit, a high volume of traffic and pedestrians, and city streets lined with parked cars.
Each scenario was programmed to have two relevant stimuli in which a car or a pedestrian (metropolis only) would enter the lane of traffic and, without evasive action, would cause a collision (Fig.1A). Relevant stimuli were matched within each scenario with similar but irrelevant stimuli (e.g., a car or pedestrian that does not enter the lane of traffic), in which no evasive action was necessary to avoid a crash (Fig.1B). All outcome variables were measured within a 450-foot window preceding the stimulus. Due to constraints of the data, analyses were not conducted between relevance (i.e. relevant, irrelevant) or scenario (i.e. country, metropolis). Responses to stimuli were instead averaged within relevance resulting in four groups of analyses: Relevant Country, Relevant Metropolis, Irrelevant Country, and Irrelevant Metropolis.
Fig 1.
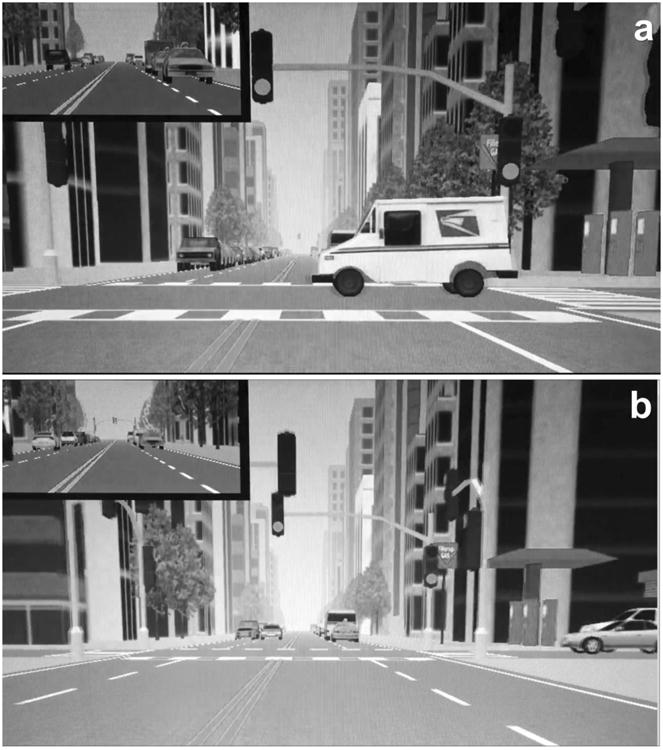
Relevant (a) and irrelevant (b) stimuli in the metropolis. The participant approaches a green traffic-light intersection. Either a vehicle appears and enters the intersection from the right hand side of the screen requiring evasive action in order to avoid a collision (a) or stationary vehicles remain on either side and no evasive action is necessary (b).
Data Analysis
Data were analyzed using SAS Version 9.4 (SAS Institute, Cary, NC). Demographic and alcohol use data were analyzed in 2 (age group) by 3 (dose) ANOVAs to identify potential pre-existing differences between the groups that might confound interpretation. Subjective levels of intoxication and BrAC were analyzed by dose and age group with repeated measures ANOVAs to examine group differences in levels of intoxication throughout the study session.
Due to the large number of driving variables (n=9) output by the STISIM driving simulator involving speed, steering, and braking, an exploratory factor analysis was conducted on the baseline responses to relevant stimuli. Variables with eigenvalues greater than 0.5 were loaded into a factor. The highest loading variable within each factor was retained as the variable of interest for that factor. This analysis resulted in three dependent variables that cumulatively explained 89.85% of the variance: percent deceleration, range of steering, and distance until brake.
Percent deceleration measures the change in speed divided by the initial speed upon entering the measurement window. Range of steering provides the magnitude of change in steering wheel adjustment: higher values are associated with increased steering wheel movement (a .5 radian change reflects about a 30° turn). Distance until brake measures the distance traveled (in feet) from the entry of the measurement window until first brake application; larger values indicate later braking. Distance until brake was only analyzed for relevant stimuli as there were too few instances of brake application in response to irrelevant stimuli in the young age group.
Four multivariate multiple regressions (Relevant Country, Relevant Metropolis, Irrelevant Country, and Irrelevant Metropolis) were first tested for main and interactive effects of age (young vs. older) and dose (placebo, low dose, moderate dose) on the baseline session (no alcohol) to determine age differences and possible pre-existing differences among the randomly assigned dose groups. Regressions were then repeated for the study session and included the baseline drive measures as covariates. Baseline results will first be discussed for relevant and irrelevant stimuli followed by the study session. Multivariate alpha levels were set at .05. Follow-up univariate alpha levels were calculated based on Keppel's suggested Bonferroni multivariate modification and set at .025 (Wickens & Keppel, 2004). Results are reported with Wilk's lambda, F-statistics, and p-values for omnibus tests, and F-statistics, p-values and effect sizes (partial eta squared) for univariate main effects and interactions.
Planned comparisons between doses (i.e. placebo, low, moderate), between doses within each age group (e.g., older adult placebo vs. older adult moderate dose), and between age groups at the same dose (e.g., older vs. younger adults in the placebo group) were conducted for significant main and interactive effects of dose on the univariate tests and reported as appropriate. Because only a priori contrasts were analyzed, t-tests are reported with uncorrected p-values and effect sizes (Cohen's d).
Results
Demographics
The mean age of participants was 27.6 years (SD=2.7) in the young, and 60.1 years (SD=3.8) in the older groups. As seen in Table 1, the groups did not differ in education, driving habits (days driven per week, distance driven per week), typical alcohol consumption (as measured by the QFI), or maximum alcohol consumption (as measured by Max-Q). All participants endorsed drinking alcohol at least once a month. Though participants in both age groups drank an average of ≤1 drink per day, occasional episodes of heavier drinking were noted (see Max-Q in Table 1), suggesting participants had experience with the doses administered in this study.
Table 1. Demographics.
| Young | Older | |
|---|---|---|
| n=33(14 women) | n=33(14 women) | |
| Mean ± SD | Mean ± SD | |
| Age** | 27.59 ± 2.71 | 60.06 ± 3.76 |
| 1STAI* | 39.68 ± 4.83 | 43.06 ± 6.51 |
| 2,3BECK/GDS | 1.15 ± 2.01 | 1.03 ± 1.24 |
| 4BMI | 25.87 ± 5.24 | 26.83 ± 5.04 |
| 5QFI | 0.39 ± 0.27 | 0.36 ± 0.33 |
| 5Max-Q | 3.93 ± 1.77 | 2.23 ± 1.40 |
| Years of Education | 16.56 ± 1.37 | 16.33 ± 1.63 |
| Days Driven/week | 6 ± 1.5 | 5.72 ± 1.99 |
| Miles Driven/week | 18.06 ± 21.35 | 26.16 ± 20.49 |
p<.05,
p<.01
State Anxiety Inventory, (Speilberger,1983),
Beck Depressive Inventory (Beck et al., 1996),
Geriatric Depression Scale (Yesevage et al., 1982),
Body Mass Index,
Quantity Frequency Index and Max Quantity (.6= 1 drink/day; Cahalan et al., 1969)
Older adults had higher state anxiety scores (F1,65=6.8, p=.01). Anxiety scores did not correlate with outcome measures for either age group and were therefore not included in the analyses. There were no pre-existing differences among dose groups on any demographic variables.
Breath Alcohol Concentrations
There was an expected effect of dose (F2,58=215.06, p<.0001) and of time (F4, 232=11.29, p<.0001) on BrAC as well as a dose by time interaction (Fig 2; F8, 110=6.7, p<.0001). By design, the placebo group's BrAC remained at 0.00 throughout the study procedures while the low and moderate groups peaked (.031% SD=.01 for the low dose and .057% SD= .012 for the moderate dose) at 25 minutes post-consumption. As expected, the moderate dose group had a higher BrAC than the low dose group (t45=17.68, p<.0001) throughout the study procedures and both attained greater BrAC than the placebo group across all assessments (t41=35.86, p<.0001, t43=19.20, p<.0001). There were no effects of age or age by dose interactions. At the start of the driving simulation, mean BrACs had decreased to .026% (SD=.005) for the low dose group and .053% (SD=.007) for the moderate dose group.
Fig 2.
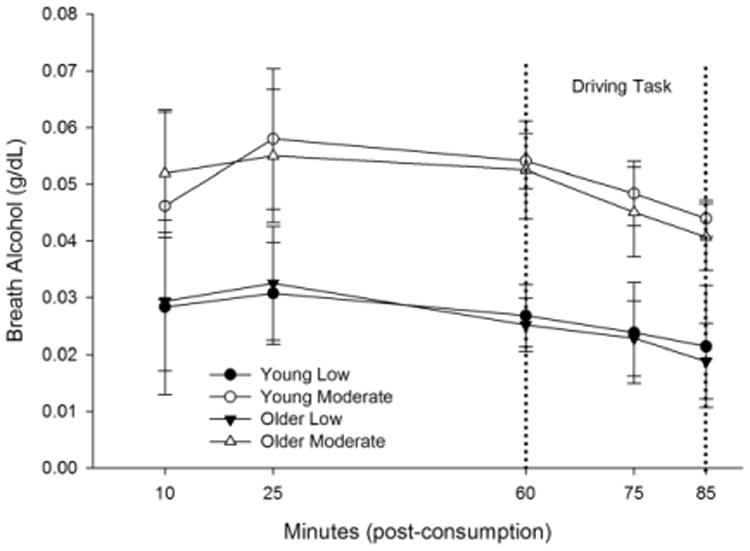
BrAC curves for young and older low and moderate dose groups. There were no main or interactive effects of age. Dashed lines indicate the start and end of the simulated driving task. Error bars depict standard deviation.
Subjective Intoxication and Impairment
There were main effects of dose (F2,60= 17.25, p<.0001) and time (F4,240=5.47, p=.0003) on participants' self-rated feelings of intoxication. Age- and dose- group means for subjective intoxication are presented in Table 2. Collapsed across time, greater levels of intoxication were reported in both the low (3.4± 1.7) and moderate (4.7± 2.1) dose groups relative to placebo group (1.7± .86) (t43=3.31, p=.002; t41=5.87, p<.0001, respectively). The moderate dose group also rated their levels of intoxication higher than the low dose group (t45=2.75, p=.008). There were no effects of age, or age by dose interactions on levels of subjective intoxication.
Table 2. Subjective Intoxication.
| 10 min | 25 min | 60 min | 75 min | 80 min | |
|---|---|---|---|---|---|
| Young Placebo | 1.6± .70 | 1.7± .82 | 2.1± 1.3 | 1.9± 1.3 | 2.0± 1.3 |
| Young Low | 2.9± 1.3 | 2.9± .97 | 3.2± 1.7 | 2.4± .90 | 2.3± .98 |
| Young Moderate | 5.0± 1.6 | 5.0± 1.4 | 5.4± 2.4 | 4.3± 2.4 | 4.5± 2.3 |
| Older Placebo | 1.2± .42 | 1.6± .84 | 1.6± .84 | 1.7± .82 | 1.7± .95 |
| Older Low | 3.4± 2.4 | 3.9± 2.7 | 4.8± 2.2 | 3.9± 2.3 | 3.9± 2.2 |
| Older Moderate | 4.0± 2.6 | 4.9± 2.6 | 5.4± 2.5 | 4.5± 3.1 | 4.4± 3.2 |
Time points are recorded as minutes since beverage consumption. The 60 minute time point (in bold) indicates the start of the driving simulation.
Following completion of the driving task, participants were asked how much they felt their beverage impaired their performance. Significant differences were identified between dose groups (F2,64= 3.95, p=.02). Both the low and moderate dose groups felt their driving performance was more impaired than the placebo group (3.0± 2.1 vs. 1.8± 1.2, t21=2.03, p=.05; 3.5± 2.4 vs. 1.8± 1.2, t20=2.74, p=.008, respectively). There was no difference between the low and moderate dose groups on self-rated impairment. There were no effects of age or age by dose interactions.
There was no difference between age groups on placebo effectiveness (χ21=0.2, p=.65). Approximately half of placebo-dosed participants (50% of older and 40% of younger) believed that their beverages contained alcohol.
Relevant- Country
Baseline
The initial omnibus showed a main effect of age for responses to relevant stimuli in the country (Wilk's λ=.56, F3,58=15.26, p<.0001). Older adults responded with greater deceleration (F1,60=19.97, p<0001 η2=.24), a greater range of steering (F1,60=13.37, p=.0005 η2=.18), and by applying the brake earlier, (F1,60=9.2, p=.004 η2=.13) than younger adults. No main or interactive effects of dose were identified at baseline indicating an absence of differences among pre-existing dose groups.
Study Session
Controlling for baseline performance, the omnibus test on responses to relevant stimuli in the country revealed a significant main effect of dose (Wilk's λ=.76, F6,110=2.63, p=.02) and a dose by age interaction (Wilk's λ=72, F6,110=3.27, p=.005). The main effect of dose did not persist in the follow-up univariates (deceleration: p=.06; range of steering: p=46; distance until brake: p=.21). The interaction was significant for range of steering (Fig 3B. F2,57=4.34, p=.02, η2=.13) and approached significance for deceleration (Fig 3A. F2,57=3.01, p=.05, η2=.10), but not distance until brake.
Fig 3.
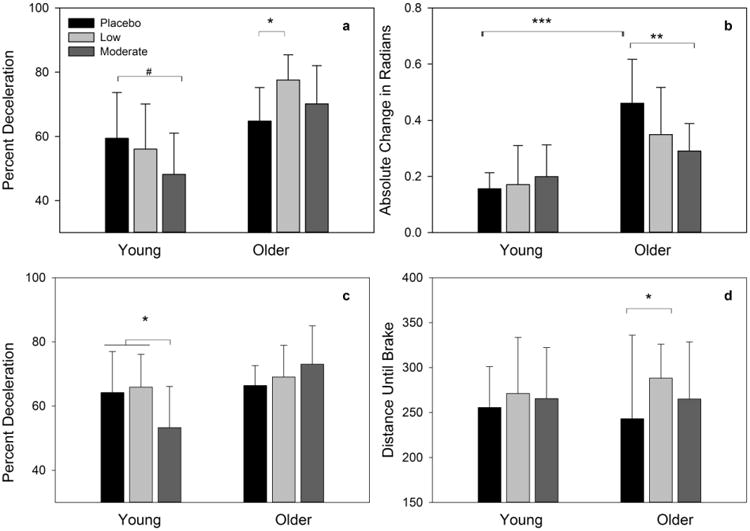
Responses to relevant stimuli under acute alcohol conditions. Young adults under moderate alcohol conditions decelerated less to relevant stimuli than placebo in both the country (a) and the metropolis (c). Placebo dosed older adults had a wider range of steering than both young placebo adults and moderate dosed older adults (b). Under low dose alcohol conditions in the country, older adults decelerated more (a) and applied the brake later (d) than placebo counterparts. Error bars depict standard deviation. # p=.07, * p<.05, ** p<.005, *** p<.0005
Under placebo conditions, older adults displayed significantly greater range of steering than the young adults in the country (t19=3.87, p<.0001, d=2.59). Following moderate alcohol consumption, older adults decreased their range of steering relative to the older placebo group (t20=2.97, p=.006, d=1.31), and did not differ from the young adults under the same dose condition (p=.9).
Young and older placebo groups did not differ in their deceleration (p=.9). There was a divergent effect with young adults under moderate dose conditions decelerating less (t20=-1.80, p=.07, d=.83) and older low-dosed adults decelerating more (t21=2.78. p=.007, d=1.38) than their respective placebo counterparts in response to relevant stimuli in the country.
Relevant- Metropolis
Baseline
A main effect of age was revealed in the omnibus test for relevant stimuli in the metropolis (Wilk's λ=.76, F3,58=6.17, p=.001). The effect of age approached significance, for distance until brake with older adults applying the brake earlier than young adults (F1,60=4.75, p=.03, η2=07). The univariate tests for percent deceleration and steering range were not significant. There were no main or interactive effects of dose at baseline indicating there were no pre-existing differences between randomized dose groups.
Study Session
Controlling for baseline, the omnibus dose by age interaction approached significance (Wilk's λ=.81, F6,110=1.99, p=.07). The trend level interaction was driven by group differences in percent deceleration (Fig 3C. F2,57=3.78, p=.04 η2=.07) in which young adults in the moderate dose group decelerated less to relevant stimuli than either placebo or low dosed young adults (t20=2.53, p=.01, d=.69; t22=2.31, p=.02, d=.36, respectively). There were no main effects of dose. The univariate tests for steering range and distance until brake were not significant.
Irrelevant- Country
Baseline
The omnibus test for responses to irrelevant stimuli in the country showed a main effect of age (Wilk's λ= .70, F2,59= 12.44, p<.0001). Older adults had greater range of steering relative to young adults (F1,60=25.01, p<.0001, η2=29). The univariate for percent deceleration was not significant. There were no main or interactive effects of dose indicating there were no pre-existing differences among dose groups.
Study Session
Controlling for baseline, there were no main or interactive effects of dose in response to irrelevant stimuli in the country (p's> .09).
Irrelevant- Metropolis
Baseline
The omnibus test showed a significant effect of age in response to irrelevant stimuli in the metropolis (Wilk's λ= .78, F2, 59= 7.86, p=.001). Older adults decelerated more (F1,60=3.47, p=.06 η2=05) and had greater range of steering (F1,60=5.47, p=.02 η2=09). As expected, there were no main or interactive effects of dose confirming the absence of pre-existing differences between randomized dose groups.
Study Session
Controlling for baseline performance, the omnibus test for irrelevant stimuli in the metropolis revealed a significant main effect of dose (Wilk's λ= .78, F4,114=3.6, p=.009) and its interaction with age approached significance (Wilk's λ= .85, F4,114= 2.28, p=.07) Both the main effect of dose and the dose by age interaction were significant for percent deceleration (Fig 4. F2,58=5.99, p=.004, η2=.18; F2,58=4.68, p=.01, η2=.14, respectively). Low and moderate dose participants decelerated more than placebo counterparts (t43=3.45, p=.001, d=.66; t41=2.05, p=.05, d=.51, respectively). While there was no difference in deceleration between dose groups in the young adults, older low and moderate dose groups decelerated more than their placebo counterparts (t21=4.54, p<.0001, d=1.19; t20=3.02, p=.004, d=.99, respectively). Based on the average speed of older adults, these differences represent a decrease from approximately 27 mph to 20 mph (∼25%). There were no significant findings for steering range.
Fig 4.
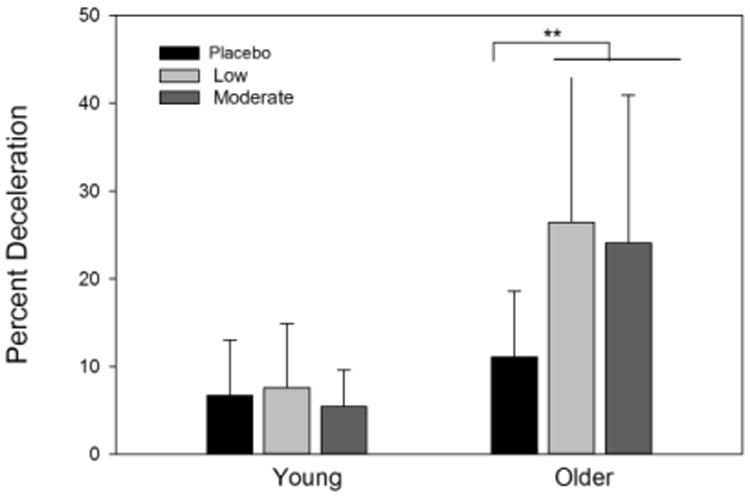
Responses to irrelevant stimuli under acute alcohol conditions in the metropolis. Older adults under both alcohol dose conditions decelerated more than their placebo counterparts. Error bars depict standard deviation. *** p<.005
Post-hoc Analyses of Sex
A post-hoc analysis was conducted to examine possible main effects of sex as well as interactions with dose. There were no main or interactive effects on any of the outcome variables (p's>. 12).
Discussion
Findings
This study examined the differential effects of acute alcohol on older and younger adults' responses to relevant and irrelevant stimuli in a driving simulator. These data illustrate the complex nature by which age and low dose alcohol can affect response allocation to specific driving-related stimuli.
Not unexpectedly, several age-related differences in responding to relevant and irrelevant stimuli were noted at baseline that were consistent with older drivers adopting compensatory strategies (Laver & Burke, 1993; Hakamies-Blomqvist, 1994; Andrews & Westerman, 2012). However, of primary interest were potential age by dose interactions. Following alcohol consumption, a divergent pattern was observed for older and younger drivers' responses to relevant stimuli. Older adults under alcohol conditions decelerated to a greater extent, whereas younger adults decelerated less, relative to placebo controls. The younger adults' reduction in deceleration is consistent with the stimulating effects of alcohol identified in the literature (Corbin et al., 2007; Burian et al., 2002; Hendler et al., 2011; Fillmore, Blackburn, & Harrison, 2008). Interestingly, while older and younger adults adopt opposing strategies in their responses to potential collisions under acute alcohol conditions, both of these behavioral shifts from baseline are consistent with inappropriate braking (Klauer et al., 2009).
In contrast to the divergent pattern noted in responses to relevant stimuli, the age by dose interaction for irrelevant stimuli was characterized by behavioral changes in older, but not younger, adults receiving alcohol. Relative to placebo, older adults under both alcohol dose conditions exhibited a greater degree of deceleration to irrelevant stimuli, decreasing their speed by approximately 25%. This finding was limited to the metropolis suggesting that responding to irrelevance under sub-intoxicating alcohol conditions is restricted to environments with higher cognitive demand (Tipper, 1991; Gazzaley & d'Esposito, 2007).
These findings extend our previous investigations by demonstrating that the age by dose interaction is influenced by contextual relevancy. Taken together, although no drivers were involved in a collision, the divergent pattern of responding is consistent with increased caution in older drivers and increased risk-taking in younger drivers at low BrACs. Thus, despite limits to laboratory testing these patterns suggest mechanisms for differential vulnerability in real-world environments. Further systematic study involving a more inclusive age range and explicit measurement of distracted driving is warranted.
Limitations
Completion of the driving task was limited by participants' susceptibility to simulator-induced motion sickness, particularly in older women. This resulted in a smaller sample than originally anticipated and restricted analyses of main or interactive effects of sex.
Of note, a recent meta-analysis found that simulated driving is less sensitive to the effects of alcohol relative to naturalistic driving (Jongen et al., 2016). As this study was not designed to detect small effects, subtle group differences may not have been identified. The lack of dose effects in the young adult group is largely consistent with our previous work, which identified neurobehavioral impairments only among older adults (Gilbertson et al., 2009). Regardless, recruitment of larger samples is necessary in future work analyzing age and dose interactions in simulated driving.
Driving scenarios were intentionally constructed to vary in speed and visual complexity to better reflect distinct driving environments such as rural or urban areas. While this maximized face validity it impeded direct comparison of scenarios. Future work designed to disentangle the effects of driving speed and environmental complexity will be critical in expanding this work.
A measurement boundary of 450 feet preceding the stimuli was selected to allow the participants' ample time to recognize, identify, and react to the stimuli. However, the exact time a participant identified a stimulus and the amount of time spent processing the stimulus are unknown. Future use of an eye tracker during simulated driving would expand these analyses to include neurobehavioral processes prior to responding.
Conclusion
To our knowledge, this is the first study to analyze the effects of sub-intoxicating doses of alcohol on older and younger adults' responses to specific stimuli in a driving simulator. The reported findings identify novel age by dose interactive effects; under acute alcohol conditions, there is a divergent pattern among older and younger adults' behavioral responses that vary between classes of stimuli and complexity of the environment. The low levels of intoxication at the start of the simulation (.026% and .053%) and low cut-off age in the older adults (<70) at which these differences are observed highlight the pertinence of the findings.
Utilizing innovative techniques, such as the driving simulator, allows for assessment of common cognitive processes during everyday tasks. Continued investigation of the effects of low-to-moderate dose alcohol consumption on neurobehavioral processes (e.g., attention, working memory) in complex paradigms such as simulated driving are necessary for understanding the implications in a real world context. Further use of neurophysiological data and eye-tracking are imperative to fully appreciate the responses associated with these alcohol-induced changes.
Table 3. Driving Measures During the Study Session.
| Young | Older | ||||||
|---|---|---|---|---|---|---|---|
| Mean (SD) | Mean (SD) | ||||||
| Placebo | Low Dose | Moderate Dose | Placebo | Low Dose | Moderate Dose | ||
| Average Speed (ft/s) | Country | 60.23 (3.90) | 61.39 (5.90) | 62.45 (4.87) | 60.09 (3.46) | 58.73 (2.40) | 57.98 (4.01) |
| Metropolis a, c | 44.47 (3.00) | 44.19 (4.21) | 45.16 (3.98) | 40.46 (4.12) | 39.92 (3.24) | 38.11 (4.83) | |
| Percent Deceleration | Country Relevant a, c | 59.42 (14.30) | 56.06 (14.07) | 48.19 (12.82) | 64.82 (10.45) | 77.57 (7.81) | 70.16 (11.85) |
| Metropolis Relevant a, c | 64.17 (12.79) | 65.85 (10.26) | 53.30 (12.78) | 66.39 (6.22) | 69.03 (9.88) | 73.00 (12.00) | |
| Country Irrelevant a | 1.37 (1.91) | 2.06 (2.05) | 1.67 (1.99) | 2.70 (3.05) | 5.66 (5.47) | 2.28 (2.72) | |
| Metropolis Irrelevant a, b | 6.74 (6.28) | 7.61 (7.29) | 5.84 (4.22) | 11.12 (7.50) | 26.44 (16.56) | 24.06 (16.87) | |
| Range of Steering (max radians turned) | Country Relevant a, c | .156 (.057) | .171 (.139) | .200 (.113) | .461 (.156) | .350 (.168) | .291 (.098) |
| Metropolis Relevant | .165 (.115) | .192 (.132) | .273 (.309) | .302 (.232) | .188 (.102) | .249 (.146) | |
| Country Irrelevant a | .247 (.093) | .231 (.105) | .232 (.148) | .380 (.136) | .325 (.167) | .363 (.136) | |
| Metropolis Irrelevant a | .175 (.102) | .189 (.103) | .195 (.106) | .276 (.150) | .223 (.090) | .298 (.195) | |
| Distance Until Brake (ft) | Country Relevant | 255.5 (45.5) | 271.1 (62.3) | 265.4 (56.7) | 242.9 (92.9) | 288.0 (38.0) | 264.8 (63.5) |
| Metropolis Relevant | 327.6 (42.0) | 358.3 (16.9) | 347.6 (13.5) | 345.8 (43.4) | 345.4 (38.4) | 295.8 (111.1) | |
main effect of age, p<.05
main effect of dose, p<.05
age by dose interaction, p<.05
Acknowledgments
The authors would like to acknowledge Dr. Mark Fillmore and Sarah Reaves for their contributions to this project. Support for this project was provided by R01AA019802 (S.J. Nixon, PI); F31AA0919862 (J. Boissoneault, PI; S.J. Nixon, Sponsor). None of the authors maintain any financial agreements that would constitute a conflict of interest.
References
- Abroms BD, Fillmore MT. Alcohol-induced impairment of inhibitory mechanisms involved in visual search. Exp and Clin Psychopharm. 2004;12(4):243–250. doi: 10.1037/1064-1297.12.4.243. [DOI] [PubMed] [Google Scholar]
- Allen AJ, Meda SA, Skudlarski P, Calhoun VD, Astur R, Ruopp KC, Pearlson GD. Effects of alcohol on performance on a distraction task during simulated driving. Alcoholism: clinical and experimental research. 2009;33(4):617–625. doi: 10.1111/j.1530-0277.2008.00876.x. [DOI] [PMC free article] [PubMed] [Google Scholar]
- Andrews EC, Westerman SJ. Age differences in simulated driving performance: Compensatory processes. Accident Analysis & Prevention. 2012;45:660–668. doi: 10.1016/j.aap.2011.09.047. [DOI] [PubMed] [Google Scholar]
- Beck AT, Steer RA, Brown GK. Beck Depression Inventory. Second. San Antonio, TX: The Psychological Corporation; 1996. [Google Scholar]
- Benedict RH, Schretlen D, Groninger L, Brandt J. The Hopkins Verbal Learning Test Revised: Normative data and analysis of inter-form and test-retest reliability. The Clinical Neuropsychologist. 1998;12:43–55. [Google Scholar]
- Boissoneault J, Frazier I, Lewis B, Nixon SJ. Effects of age and acute moderate alcohol administration on electrophysiological correlates of working memory maintenance. Alcoholism: Clinical and Experimental Research. 2016;40(9):1874–1883. doi: 10.1111/acer.13154. [DOI] [PMC free article] [PubMed] [Google Scholar]
- Boissoneault J, Sklar A, Prather R, Nixon SJ. Acute effects of moderate alcohol on psychomotor, set shifting, and working memory function in older and younger social drinkers. Journal of studies on alcohol and drugs. 2014;75(5):870–879. doi: 10.15288/jsad.2014.75.870. [DOI] [PMC free article] [PubMed] [Google Scholar]
- Breslow RA, Castle IJP, Chen CM, Graubard BI. Trends in alcohol consumption among older Americans: National Health Interview Surveys, 1997 to 2014. Alcoholism: clinical and experimental research. 2017;41(5):976–986. doi: 10.1111/acer.13365. [DOI] [PMC free article] [PubMed] [Google Scholar]
- Bunce D, Young MS, Blane A, Khugputh P. Age and inconsistency in driving performance. Accident Analysis & Prevention. 2012;49:293–299. doi: 10.1016/j.aap.2012.01.001. [DOI] [PubMed] [Google Scholar]
- Cahalan D, Cissin L, Crossley H. American drinking practices: A national study of drinking behaviors and attitudes. New Brunswick, NJ: Rutgers Center of Alcohol Studies; 1969. Monograph No. 6. [Google Scholar]
- Calhoun VD, Pearlson GD. A selective review of simulated driving studies: Combining naturalistic and hybrid paradigms, analysis approaches, and future directions. Neuroimage. 2012;59:25–35. doi: 10.1016/j.neuroimage.2011.06.037. [DOI] [PMC free article] [PubMed] [Google Scholar]
- Cook R. Detection of Influential Observation in Linear Regression. Technometrics. 1977;19(1):15–18. doi: 10.2307/1268249. [DOI] [Google Scholar]
- Corbin WR, Gearhardt A, Fromme K. Stimulant alcohol effects prime within session drinking behavior. Psychopharmacology. 2007;197(2):327–337. doi: 10.1007/s00213-007-1039-x. [DOI] [PMC free article] [PubMed] [Google Scholar]
- Fillmore MT, Dixon MJ, Schweizer TA. Alcohol affects processing of ignored stimuli in a negative priming task. J of Stud on Alc. 2000;61:571–578. doi: 10.15288/jsa.2000.61.571. [DOI] [PubMed] [Google Scholar]
- Fillmore MT, Blackburn JS, Harrison EL. Acute disinhibiting effects of alcohol as a factor in risky driving behavior. Drug and alcohol dependence. 2008;95(1):97–106. doi: 10.1016/j.drugalcdep.2007.12.018. [DOI] [PMC free article] [PubMed] [Google Scholar]
- Folstein MF, Folstein SE, McHugh PR. “Mini-mental state”. A practical method for grading the cognitive state of patients for the clinician. J Psychiatr Res. 1975;12(3):189–198. doi: 10.1016/0022-3956(75)90026-6. [DOI] [PubMed] [Google Scholar]
- Gazzaley A, d'Esposito M. Top-down modulation and normal aging. Ann N Y Acad Sci. 2007;1097:67–83. doi: 10.1196/annals.1379.010. [DOI] [PubMed] [Google Scholar]
- Gilbertson R, Ceballos NA, Prather R, Nixon SJ. Effects of acute alcohol consumption in older and younger adults: perceived impairment versus psychomotor performance. Journal of studies on alcohol and drugs. 2009;70(2):242–252. doi: 10.15288/jsad.2009.70.242. [DOI] [PMC free article] [PubMed] [Google Scholar]
- Hakamies-Blomqvist L. Compensation in older drivers as reflected in their fatal accidents. Accident Analysis & Prevention. 1994;26(1):107–112. doi: 10.1016/0001-4575(94)90073-6. [DOI] [PubMed] [Google Scholar]
- Harrison EL, Fillmore MT. Alcohol and distraction interact to impair driving performance. Drug and alcohol dependence. 2011;117(1):31–37. doi: 10.1016/j.drugalcdep.2011.01.002. [DOI] [PMC free article] [PubMed] [Google Scholar]
- Hasher L, Zacks RT, May CP. Attention and Performance. XVII. Cambridge, MA: MIT Press; 1999. Inhibitory control, circadian arousal, and age; pp. 653–675. [Google Scholar]
- Hendler RA, Ramchandani VA, Gilman J, Hommer DW. Stimulant and sedative effects of alcohol. Behavioral Neurobiology and Alcohol and Addiction. 2011;13:489–509. doi: 10.1007/7854_2011_135. [DOI] [PubMed] [Google Scholar]
- Irwin C, Iudakhina E, Desbrow B, McCartney D. Effects of acute alcohol consumption on measures of simulated driving: a systematic review and meta-analysis. Accident Analysis & Prevention. 2017;102:248–266. doi: 10.1016/j.aap.2017.03.001. [DOI] [PubMed] [Google Scholar]
- Klauer SG, Dingus TA, Neale VL, Sudweeks JD, Ramsey DJ. Comparing Real-World Behaviors of Drivers with High Versus Low Rates of Crashes and Near Crashes. 2009 No. DOT-HS-811-091. [Google Scholar]
- Laver GD, Burke DM. Why do semantic priming effects increase in old age? A meta-analysis. 1993 doi: 10.1037//0882-7974.8.1.34. [DOI] [PubMed] [Google Scholar]
- Lewis B, Boissoneault J, Frazier I, Nixon SJ. Effects of Age and Acute Moderate Alcohol Administration on Neurophysiology During Simulated Driving. Alcoholism: Clinical and Experimental Research. 2016;40(12):2519–2527. doi: 10.1111/acer.13243. [DOI] [PMC free article] [PubMed] [Google Scholar]
- Liu YC, Ho CH. Effects of different blood alcohol concentrations and post-alcohol impairment on driving behavior and task performance. Traffic injury prevention. 2010;11(4):334–341. doi: 10.1080/15389581003747522. [DOI] [PubMed] [Google Scholar]
- Mets MA, Kuipers E, Senerpont Domis LM, Leenders M, Olivier B, Verster JC. Effects of alcohol on highway driving in the STISIM driving simulator. Human Psychopharmacology: Clinical and Experimental. 2011;26(6):434–439. doi: 10.1002/hup.1226. [DOI] [PubMed] [Google Scholar]
- National Center for Statistics and Analysis. Alcohol-impaired driving: 2014 data. Washington, DC: National Highway Traffic Safety Administration; 2015. Dec, Traffic Safety Facts. DOT HS 812 231. [Google Scholar]
- Pollatsek A, Romoser MR, Fisher DL. Identifying and remediating failures of selective attention in older drivers. Current directions in psychological science. 2012;21(1):3–7. doi: 10.1177/0963721411429459. [DOI] [PMC free article] [PubMed] [Google Scholar]
- Quillian WC, Cox DJ, Kovatchev BP, Phillips C. The effects of age and alcohol intoxication on simulated driving performance, awareness and self-restraint. Age and ageing. 1999;28(1):59–66. doi: 10.1093/ageing/28.1.59. [DOI] [PubMed] [Google Scholar]
- Ramaekers JG, Robbe HWJ, O'Hanlon JF. Marijuana, alcohol and actual driving performance. Human Psychopharmacology Clinical and Experimental. 2000;15(7):551–558. doi: 10.1002/1099-1077(200010)15:7<551::AID-HUP236>3.0.CO;2-P. [DOI] [PubMed] [Google Scholar]
- Reimer B, Mehler B, Wang Y, Coughlin JF. A field study on the impact of variations in short-term memory demands on drivers' visual attention and driving performance across three age groups. Human Factors. 2012;54(3):454–468. doi: 10.1177/0018720812437274. [DOI] [PubMed] [Google Scholar]
- Robins LN, Cottler L, Bucholz KK, Compton W. The Diagnostic Interview Schedule, Version IV. St Louis: Washington University; 1995. [Google Scholar]
- Sklar AL, Boissoneault J, Fillmore MT, Nixon SJ. Interactions between age and moderate alcohol effects on simulated driving performance. Psychopharmacology. 2014;231(3):557–566. doi: 10.1007/s00213-013-3269-4. [DOI] [PMC free article] [PubMed] [Google Scholar]
- Sklar AL, Gilbertson R, Boissoneault J, Prather R, Nixon SJ. Differential effects of moderate alcohol consumption on performance among older and younger adults. Alcoholism: Clinical and Experimental Research. 2012;36(12):2150–2156. doi: 10.1111/j.1530-0277.2012.01833.x. [DOI] [PMC free article] [PubMed] [Google Scholar]
- Spielberger CD. Manual for state-trait anxiety inventory. Palo Alto, CA: Consulting Psychologists Press; 1983. [Google Scholar]
- Tipper SP. Less Attentional Selectivity as a Result of Declining Inhibition in Older Adults. Bulletin of Psychonomic Society. 1991;29(1):45–47. [Google Scholar]
- United States Department of Agriculture, United States Department of Health and Human Services. Dietary guidlines for Americans, 2010, in Series Dietary guidlines for Americans, 2010. U.S. Government Printing Office; Washington, DC: 2010. [Google Scholar]
- Walker N, Fain B, Fisk AD, McGuire CL. Aging and decision making: driving-related problem solving. Human Factors. 1997;39(3):438–444. doi: 10.1518/001872097778827188. [DOI] [PubMed] [Google Scholar]
- Watson PE, Watson ID, Batt RD. Prediction of blood alcohol concentrations in human subjects. Updating the Widmark equation. J Stud Alcohol. 1981;42(7):547–556. doi: 10.15288/jsa.1981.42.547. [DOI] [PubMed] [Google Scholar]
- Weafer J, Fillmore MT. Acute tolerance to alcohol impairment of behavioral and cognitive mechanisms related to driving: drinking and driving on the descending limb. Psychopharmacology. 2012;220(4):697–706. doi: 10.1007/s00213-011-2519-6. [DOI] [PMC free article] [PubMed] [Google Scholar]
- Wickens TD, Keppel G. Design and analysis: A researcher's handbook 2004 [Google Scholar]
- Yesavage JA, Brink TL, Rose TL, Lum O, Huang V, Adey M, Leirer VO. Development and validation of a geriatric depression screening scale: A preliminary report. Journal of Psychiatric Research. 1982–1983;17:37–49. doi: 10.1016/0022-3956(82)90033-4. [DOI] [PubMed] [Google Scholar]