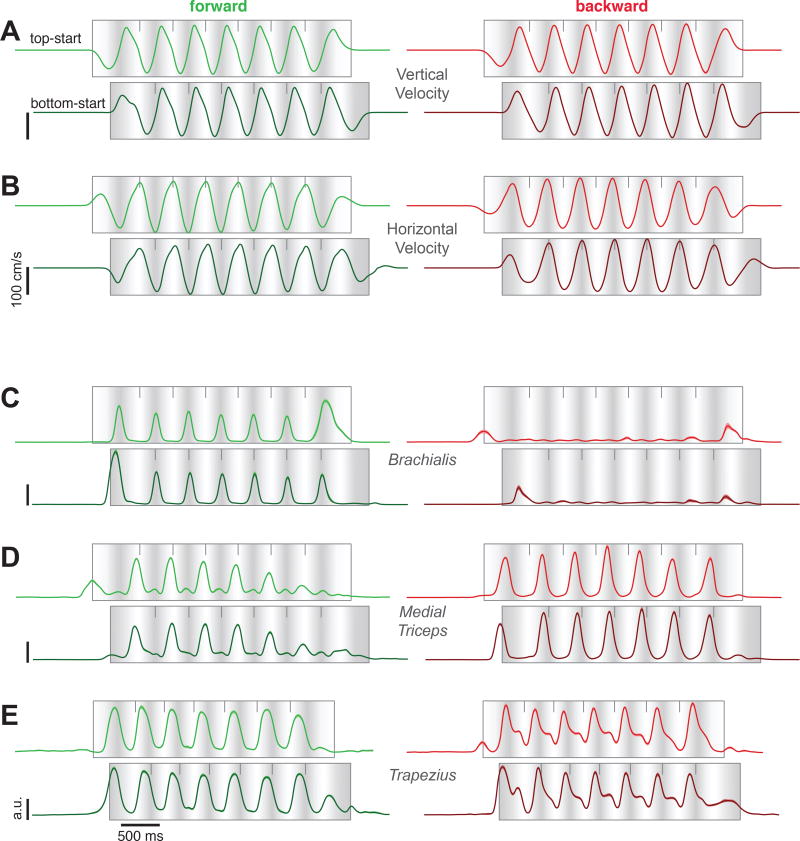
Figure 2.
A. Vertical hand velocity, averaged across trials from a typical session (monkey C). Same format as in Fig 1G. Data are shown for seven-cycle movements for forward cycling (green, left column) and backward cycling (red, right column), and for both top-start and bottom-start movements. The latter have been shifted a half-cycle to visually align hand position between top- and bottom-start movements (light shading indicates the top of each cycle). Flanking traces show the SEM but are generally narrower than the trace width. B. Horizontal hand velocity from the same session, plotted using the same format. C. Activity of brachialis (monkey C) plotted using the same format. Flanking traces (barely visible) show the SEM. D. Activity of the medial triceps (monkey C). E. Activity of the trapezius (monkey D).

