Abstract
Thermal manipulation during embryogenesis has been demonstrated to enhance the thermotolerance capacity of broilers through epigenetic modifications. Heat shock proteins (HSPs) are induced in response to stress for guarding cells against damage. The present study investigates the effect of thermal conditioning during embryogenesis and thermal challenge at 42 days of age on HSP gene and protein expression, DNA methylation and in vitro luciferase assay in brain tissue of Naked Neck (NN) and Punjab Broiler-2 (PB-2) chicken. On the 15th day of incubation, fertile eggs from two breeds, NN and PB-2, were randomly divided in to two groups: control (C)—eggs were incubated under standard incubation conditions, and thermal conditioning (TC)—eggs were exposed to higher incubation temperature (40.5°C) for 3 h on the 15th, 16th, and 17th days of incubation. The chicks obtained from each group were further subdivided and reared under different environmental conditions from the 15th to the 42nd day as normal [N; 25 ± 1 °C, 70% relative humidity (RH)] and heat exposed (HE; 35 ± 1 °C, 50% RH) resulting in four treatment groups (CN, CHE, TCN, and TCHE). The results revealed that HSP promoter activity was stronger in CHE, which had lesser methylation and higher gene expression. The activity of promoter region was lesser in TCHE birds that were thermally manipulated at the embryonic stage, thus reflecting their stress-free condition. This was confirmed by the lower level of mRNA expression of all the HSP genes. In conclusion, thermal conditioning during embryogenesis has a positive impact and improves chicken thermotolerance capacity in postnatal life.
Electronic supplementary material
The online version of this article (10.1007/s12192-017-0837-2) contains supplementary material, which is available to authorized users.
Keywords: Brain, Embryo, Epigenetics, Methylation, Heat shock proteins
Introduction
Summers in tropical countries foster severe heat stress in birds and animals. When the environmental temperature rises as high as 45 °C, it leads to the production of excess quantities of reactive oxygen species (ROS) causing damage to the cellular phospholipid membrane and other macromolecules (Wiseman and Halliwell 1996). Poultry is an important sector of livestock production in the world, particularly in the tropics where it is an affordable source of animal protein to populations generally lacking in acquisitive abilities (Almeida and Cardoso 2001). Higher environmental temperature is the major threat for poultry production in the tropics where birds are generally reared in open sheds.
Poultry performance is impaired by environmental temperature changes; huge losses are incurred due to elevated stress, reduction in reproductive efficacy, loss of productivity, diminished immunological potency, and demand for heavier investment to alleviate the impact produced by climatic fluctuations (Rajkumar et al. 2011). Heat stress results in reduced growth rate, feed efficiency, intestinal injury, egg shell quality, and survivability in chicken (Mashaly et al. 2004; Quinteiro-Filho et al. 2010). To combat physical, chemical, and biological stress situations such as heat stress, a class of proteins called heat shock proteins (HSPs) are synthesized (Staib et al. 2007).
HSPs consist of several families of highly conserved proteins found in all living organisms (Lindquist and Craig 1988). The HSPs are broadly classified into distinct families, viz., HSP 100, HSP 90, HSP 70, HSP 60, and small HSPs, based on their molecular weight. These HSPs might be involved in cellular protection in adverse situations, and a relationship has been proposed between the development of thermotolerance and HSP synthesis (Parsell and Lindquist 1994). HSP expression was regulated at the transcriptional and translational levels (Akerfelt et al. 2010). The part played by heat shock proteins in the intensely complicated process of thermotolerance in poultry has not been fully unveiled.
Epigenetic modifications by prenatal thermal manipulation generate physiological memory that facilitates better thermal adaptation during the postnatal period (Yahav 2009). Epigenetic adaptation is based on the assumption that environmental factors, particularly ambient temperature, have an influence on the physiological control system during the critical phase of development (Dorner 1974) that may stimulate variation in the thermoregulatory system. Epidemiological studies in humans and genetic studies in animals have revealed that, in addition to the DNA sequence, epigenetic markers may be transmitted across generations leaving an impact on the phenotype of offspring (Jablonka and Raz, 2009).
DNA methylation is one of the main epigenetic modification mechanisms in eukaryotic organisms, playing a crucial role in the regulation of gene expression (Jost and Saluz 1993). The DNA methylation occurs mainly within CpG dinucleotide sites, with the exception of some plants, fungi, and invertebrates where it was reported in other C bases (Zemach et al. 2010). In the promoter region, the CpG island methylation blocks binding of protein at these methylated sites, thereby inhibiting gene transcription (Kuroda et al. 2009). However, it is hard to establish the link between methylation and gene expression. However, an alteration in the level of methylation is expected when the organism is subjected to certain specific stimuli. Based on the results of these studies and the functions exerted during gene expression, it may be noted that differences in methylation level and pattern may serve as an important factor in the regulation of tissue-specific genetic expression and cellular differentiation (Yang et al. 2011).
The present study was undertaken to profile the DNA methylation patterns in the brain tissue of HSP promoter region to identify the methylated genes involved in thermal adaptation. Additionally, the transcription profiles of HSP promoter regions were analyzed using dual luciferase assay, and an association analysis between DNA methylation and gene expression level in Naked Neck (NN) and Punjab Broiler-2 (PB-2) chicken was performed.
Material and methods
The experiment was conducted at ICAR-Directorate of Poultry Research, Hyderabad, and Veterinary College and Research Institute, Namakkal, Tamilnadu. The experiment was approved by the Institutional Animal Ethics Committee.
Experimental population
A total of 904 eggs collected from PB-2 (384) and NN (520) lines were incubated at standard temperature and humidity till 14th day. On day 15, the eggs from each breed were randomly distributed into two groups. The group labeled thermal conditioning (TC) comprising of 192 PB-2 and 260 NN eggs were exposed to a higher incubation temperature of 40.5 °C (3 °C above the standard incubation temperature 37.5 °C) for 3 h a day on the 15th, 16th, and 17th days of incubation. The relative humidity was maintained at 65% during the exposure. A similar number of eggs belonging to the control (C) group were kept under standard incubation conditions. On the 18th day of incubation, eggs were candled, and those eggs showing embryonic growth were transferred into a hatcher compartment and incubation continued until the 21st day.
Rearing and management
The chicks reared under deep litter system till day 14 post-hatch were arbitrarily segregated at the rate of six birds per brooder pen in an automatically controlled environmental house. The chicks of each breed were further divided into two groups, namely, normal (N) and heat exposed (HE), in control and embryonic thermal conditioned groups making four groups in total, viz., control normal (CN), control heat exposure (CHE), thermal conditioned normal (TCN), and thermal conditioned heat exposure (TCHE) with 18 replicates. The HE groups were reared at 35 ± 1 °C and 50% relative humidity (RH) throughout the experimental period (15th to 42nd day), while N groups were reared at 25 ± 1 °C, 70% RH. The chicks were vaccinated against Newcastle disease on the 7th day and infectious bursal disease on the 14th and 24th days.
Sample collection
Following strict aseptic precautions, brain tissue was isolated from C and TC embryos (n = 6) of PB-2 and NN breeds at the end of the 17th day of incubation. On day 42, from 10 birds in each group, blood samples were collected in EDTA containing tubes and centrifuged at 3000×g for 10 min to separate plasma for hormonal assay. Six birds from each group were sacrificed by decapitation, exsanguinated, and manually eviscerated, and the brain samples were collected and stored at −70 °C until further analysis.
Hormonal analysis
The total tri-iodothyronine (RFCL Ltd., India) and corticosterone (Neogen Corporation, USA) levels were determined using commercially available kits. The intra-assay coefficient of variation and sensitivity was 10%.
RNA extraction and cDNA synthesis
The total RNA was extracted from brain tissue using SV total RNA isolation system (Promega, USA) according to standard protocol. The purity was determined by measuring absorbance in Genova nano (Jenway, UK). cDNA was built using a high-capacity cDNA reverse transcription kit (Applied Biosystems, USA). With a random primer and reverse transcriptase enzyme, first-strand cDNA was synthesized from 1.5 μg of each of the total RNA samples as per the manufacturer’s protocol.
Real-time quantitative PCR (RT-qPCR)
The relative mRNA expression was assessed by Mx-3000P spectroflurometric thermocycler (Stratagene, USA). The first-strand cDNAs were utilized as a template to amplify gene-specific primers for HSP 90 alpha, HSP 90 beta, HSP 70, HSP 60, HSP 27, Ubiquitin, and reference genes GPDH and HPRT. The reactions were performed in a 25-μl volume of SYBR green master mix (Sigma, USA) with 10 pM of each primer (Table 1). The amplification protocol used is as follows: initial denaturation at 95 °C for 2 min, followed by 40 cycles of cyclic denaturation at 94 °C for 15 s, annealing at 59 °C for 1 min, and extension at 72 °C for 15 s. Relative quantification of mRNA expression was estimated using Ct values. The Ct value is the fractional cycle number at which the amount of amplified target reaches a fixed threshold. The level of target genes relative to endogenous control was assessed by 2−ΔΔCt formula and expressed in fold change.
Table 1.
Primer sequences used for qPCR analysis
| Primers | Sequence (5′…3′) | Product size (bp) | Annealing temperature (°C) | Accession number |
|---|---|---|---|---|
| HSP 90 alpha | F-GCATTCTCAGTTCATTGGCTACC | 122 | 62 | NM_206959.1 |
| R-CTGTCTTCTCCTCCTTCTCCTCT | ||||
| HSP 90 beta | F-CAACGATGACGAGCAGTA | 127 | 54 | X83230.1 |
| R-TCTGTCTGGTCCTCCTTC | ||||
| HSP 70 | F-ATGAGCACAAGCAGAAAGAG | 95 | 61 | J02579 |
| R-TCCCTGGTACAGTTTTGTGA | ||||
| HSP 60 | F-AGAAGAAGGACAGAGTTACC | 116 | 50 | NM_001012916.1 |
| R-GCGTCTAATGCTGGAATG | ||||
| HSP 27 | F-GCGACCAGCCAGGAAGAAGAA | 126 | 61 | NM_205290 |
| R-GGGTCCGTGCTGTGCTTTGA | ||||
| Ubiquitin | F-GAGAGGTGGATGGATACG | 124 | 60 | M14693 |
| R-CCAACGCAAGTCAATCG | ||||
| HPRT | F-CCCAAACATTATGCAGACGA | 66 | 60 | AJ132697 |
| R-TGTCCTGTCCATGATGAGC | ||||
| GAPDH | F-CTGCCGTCCTCTCTGGC | 105 | 60 | NC_006088 |
| R-GACAGTGCCCTTGAAGTGT |
Immunoblot assay
For protein preparation, brain tissue was boiled at 95 °C for 5 min in 2× lysis buffer (Laemmli 1970) and cooled in an ice bath for 5 min. Particulate matter was removed by centrifuging the tubes at 12,000×g for 5 min. The protein content was quantified using Genova nano (Jenway, UK) and about 75 μg of protein was subjected to SDS-PAGE (12–14%). Proteins in the slab gel were transferred to a PVDF membrane (Amersham, USA) which was blocked with 5% bovine serum albumin for western blot analysis. The membrane was then incubated overnight at 4 °C with HSP antibodies, namely, HSP 90 alpha and beta, HSP 70, HSP 60, and ubiquitin (Cell Signaling Technology, USA), and reacted with goat-anti rabbit conjugated with horseradish peroxidase. Diaminobenzidine was the substrate used for the development of color, and intensities of the protein bands were measured using ImageJ software.
Genomic DNA isolation and bisulfite conversion for methylation studies
The purity and quantity of genomic DNA extracted from brain tissue using phenol-chloroform (Sambrook and Russell 2001) were ascertained using Genova nano (UK). Bisulfite reaction mix was prepared in RNase- and DNase-free PCR tubes in strict accordance with the manufacturer’s instructions (EpiTect kit; Qiagen, USA) and DNA bisulfite conversion performed in a thermal cycler (Eppendorf, ROS). The thermal profile of bisulfite conversion is as follows: denaturation at 95 °C for 5 min, incubation at 60 °C for 25 min, denaturation at 95 °C for 5 min, incubation at 60 °C for 85 min, denaturation at 95 °C for 5 min, incubation at 60 °C for 175 min, and hold at 4 °C. After incubation, the product was transferred to a spin column and eluted as per the manufacturer’s directions, and the converted DNA was stored at −40 °C until further studies.
Amplification of the HSP promoter region
The upstream region of all HSP genes (HSP 90 alpha, HSP 90 beta, HSP 70, HSP 60, and ubiquitin) was analyzed using Proscan and Transcription Factor (TF) search software. This analysis helped to define the transcription start site and binding site of the transcription factor. Primers were designed for HSP 90 alpha, HSP 90 beta, HSP 70, HSP 60, and ubiquitin promoter region using MethPrimer online software and Methyl Primer Express software (Table 2). PCR was performed in a total volume of 50 μl with 26.25 μl of Hi fidelity KAPA uracil Taq polymerase, 2.5 μl of the forward and reverse primers each, 5 μl of bisulfite converted DNA, and 13.75 μl of nuclease-free water. The PCR amplification program employed for all the HSP genes is initial denaturation at 95 °C for 2 min followed by 40 cycles of cyclic denaturation at 98 °C for 20 s, annealing at 60 °C for 1 min, extension at 72 °C for 30 s, and a final extension at 72 °C for 10 min. The resultant products were confirmed by agarose gel electrophoresis and purified (QIAquick gel extraction kit Invitrogen) in compliance with the specifications and sequenced to identify the methylation sites of each treatment group (n = 3) in both breeds. The bisulfite converted sequencing outcome was then contrasted against the non-converted sample, which was followed by evaluation of the percentage of CpG based upon the conversion ratio of C to T and C to C.
Table 2.
Primer sequences used for methylation analysis and cloning
| Gene | Sequence (5′…3′) | Size (bp) |
|---|---|---|
| HSP 90 alpha | F-ACGCGTATATTTGTTGTGTGAGTAGTTGGT | 290 |
| R-AAGCTTTCTCCAAAAAAACCTAAAAACT | ||
| HSP 90 beta | F-ACGCGTTTGTGTTTATTATTGTGGGGAATG | 410 |
| R-AAGCTTCCCCCTTAAACTCCCTTATATAAAC | ||
| HSP 70 | F-ACGCGTAAGTTTTTTGTTTTTTGAGAAGGGT | 450 |
| R-AAGCTTAATTCCTCTAATCAATCAACCACT | ||
| HSP 60 | F-ACGCGTGAGTTTTAGAGTGGGGTTTATT | 498 |
| R-AAGCTTTCAAAAATAAACTAACTTCACTTC | ||
| Ubiquitin | F-ACGCGTTAGTAGTTATTTTTTTTATTGTTGTATTAA | 380 |
| R-AAGCTTTCTACTTCCAATACCAATAATCTA |
Restriction sites marked in italic and bold
Expression of HSP promoter regions by cloning, transfection, and dual luciferase reporter assay
The HSP promoter regions of all treatment categories belonging to NN and PB-2 were cloned into a pGL3 basic vector, a promoter-less vector (Promega, USA), between the regions Mlu I and Hind III. The restriction sites were included in the starting region of forward and reverse strands (Table 2).
Chick embryo fibroblast cells were cultured in Dulbecco’s modified Eagle’s medium containing 10% fetal bovine serum (Invitrogen, USA) and 10% antibiotic–antimycotic solution (Himedia, India) and transfected at a density of 1.5 × 10⁵ cells/well with 500 ng of plasmid DNA containing HSP promoter regions using Lipofectamine™ 2000 (Invitrogen, USA) as per the instruction of the manufacturer. An internal control for calculating transfection efficiency, 50 ng of pRL-TK control plasmid encoding renilla reniformis luciferase (Promega, USA) was used. pGL3 basic vector (non-transformant) served as a negative control. After transfection, the plates were incubated for 6 h and replaced with growth medium and incubated for 24 h. Dead cells and debris were removed by washing with phosphate-buffered saline, cells were harvested as per instructions for dual luciferase assay system (Promega, USA), and reporter assay was performed in a single-tube luminometer, Max glow 20/20 (Promega, USA). Each reaction was repeated thrice and the values were normalized with the internal control vector pRLTK. Transcription activity was calculated by fold change method (Schagat et al. 2007).
2DE (two-dimensional gel electrophoresis) and MALDI-TOF
Brain tissue weighing 100 mg was triturated in 750 μl of lysis buffer. The supernatant was separated, precipitated with 800 μl of acetone and 100 μl of Tri chloro aceticacid (TCA) solution, and incubated for 1 h at −20 °C. Then the mixture was centrifuged at 15,000 rpm for 15 min. Supernatants were precipitated by adding 500 μl of ice-cold acetone containing dithiothreitol (DTT) and centrifuged at high speed. Excess of the supernatant was removed by lyophilization. The lyophilized pellet was rehydrated with 100 μl of rehydration buffer and stored at − 80 °C for further use.
Protein was estimated using Qubit™ assays. The absorbance of the sample was measured using a Qubit® fluorometer (Invitrogen) and concentration expressed as micrograms per milliliter. One-dimensional gel electrophoresis was performed using 200 μg of protein. The sample was rehydrated overnight in a 7-cm linear immobilized pH gradient strip (IPG strips) with a broad range of pH (3 to 10). After rehydration, isoelectric focusing was carried out in PROTEAN® IEF CELL (Biorad) by the following programs: 250 V (linear) for 15 min, 4000 V (linear) for 2 h, and 4000 V (rapid) until it reaches 10,000 V. After completing isoelectric focusing, the strips were equilibrated in equilibration buffer I containing DTT for 10 min and equilibration buffer II containing iodoacetamide for 5 min. After completing first-dimensional gel electrophoresis, the second-dimensional gel electrophoresis was performed in 12% SDS-PAGE and electrophoresis was carried out at 100 V for 1 h in a Biorad Mini-PROTEAN system. The slab gel was stained overnight in 0.1% Coomassie brilliant blue R-250 (Sigma) and destained with destaining solution. The gels were placed in triple distilled water and analyzed in a calibrated densitometer scanner (Biorad) using PD quest 8.01 software (Biorad).
The newly identified spot was eluted and digested using trypsin and examined by MALDI-TOF/TOF Biorad mini-protean system instrument. Further analysis was done with flex analysis software for obtaining the peptide mass fingerprint. The obtained peptide mass fingerprint was submitted for Mascot search in “concerned” database for identification of the protein.
Statistical analysis
All data were analyzed using two-factorial ANOVA, and the main effects (breed and treatment) and their interactions were evaluated using the SPSS 15 software. Treatment means that were significant were further subjected to Turkey’s post hoc test. Association between gene expression and methylation was done by Pearson correlation analysis.
Results
Hatchability
No significant effect was observed in the hatchability of the eggs of NN (C, 75.12%; TC, 72.46%) and PB-2 (C, 77.42%; TC, 84.09%) following exposure to a temperature of 3 °C above the standard incubation temperature for 3 h a day. Moreover, notable variations could not be observed in the hatchability rate of the two breeds.
Body weight
Body weight of C and TC chicks demonstrated no significant difference when measured on the 1st and 14th days (Supplemental Table 1). However, a significant difference (P ≤ 0.05) could be made out on recording the body weight of the chicks on days 21, 28, 35, and 42 (Supplemental Table 2). The TCN chicks showed a significantly increased growth rate on comparing with the CHE and TCHE groups, on day 21. In the CN group, the rate of growth was quite similar to the rest of the groups. On the 28th day, TCN chicks weighed highest followed by CN and TCHE, while CHE weighed the least. On day 35, body weight was highest in CN and TCN and minimum in CHE. Body weights illustrated by the 42-day-old chicken closely resembled the weights measured on day 28. There was no noteworthy breed difference in body weight implying a homogeneous growth rate pattern in the PB-2 and NN.
Hormones
Plasma levels of tri-iodothyronine (T3) and corticosterone level were measured on day 42. The T3 concentration was significantly (P ≤ 0.05) elevated in CN in comparison to CHE, TCN and TCHE chicken of both NN and PB-2 breeds (Table 3). On the other hand, corticosterone in birds was significantly (P ≤ 0.05) elevated in CHE than in the TCHE group.
Table 3.
Plasma hormone levels on 42-day-old chicks
| NN | PB-2 | |||||||
|---|---|---|---|---|---|---|---|---|
| CN | CHE | TCN | TCHE | CN | CHE | TCN | TCHE | |
| Tri-iodothyronine | 1.93 ± 0.22a | 1.27 ± 0.08b | 1.37 ± 0.09b | 1.44 ± 0.07b | 1.77 ± 0.2a | 1.31 ± 0.08b | 1.51 ± 0.15b | 1.34 ± 0.03b |
| Corticosterone | 2.25 ± 0.74c | 4.9 ± 0.46a | 2.64 ± 0.76bc | 4.35 ± 0.52b | 3.9 ± 1.16c | 6.66 ± 0.88a | 3.94 ± 1.00bc | 5.3 ± 1.22b |
a, bMean ± SE with different superscripts in a row and within a breed differ significantly (P < 0.05). Means of different treatments were compared with CN group in a breed
Gene expression
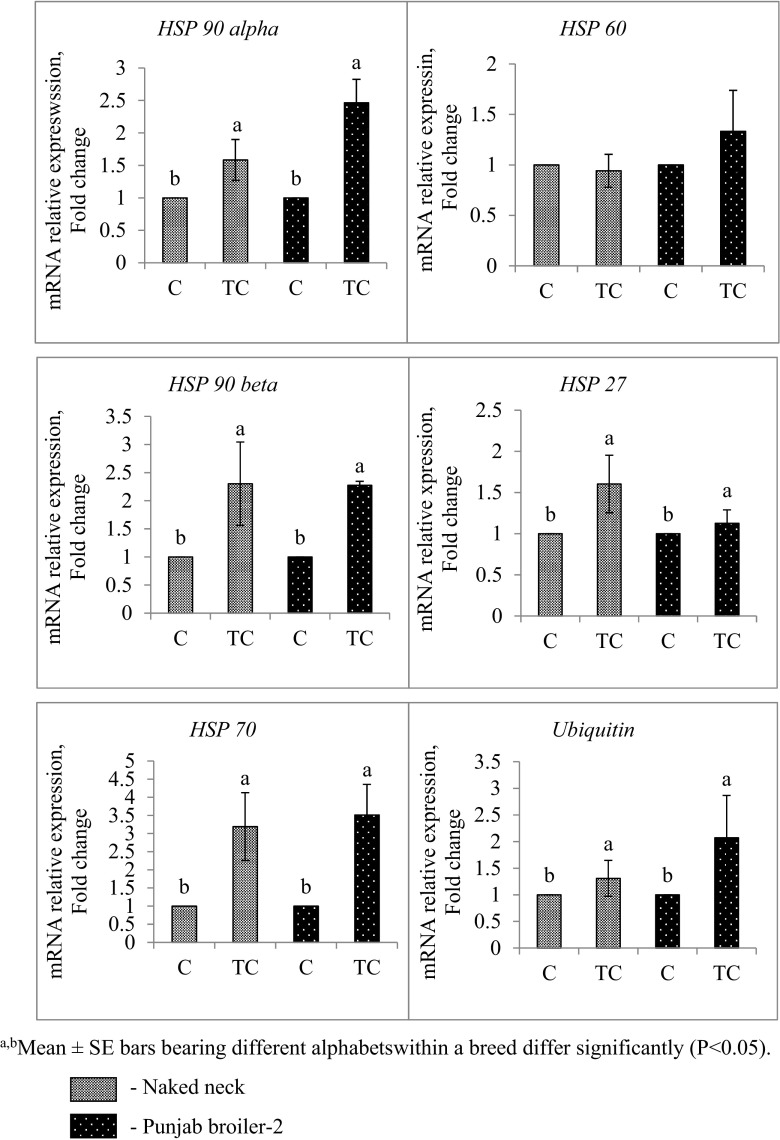
All the HSP genes examined (HSP 27, HSP 60, HSP 70, HSP 90 alpha, HSP 90 beta, and ubiquitin) in the brain tissue of 17th-day TC embryos exhibited a significant upregulation (P ≤ 0.05) in the relative mRNA expression whereas it was downregulated in the C group of both NN and PB-2 (Fig. 1) with the exception of HSP 60 that did not show any significant change in both breeds (Fig. 1).
Fig. 1.
HSP gene expression in brain of the embryos sacrificed on 17th day of incubation a, bMean ± SE bars bearing different alphabets within a breed differ significantly (P < 0.05)
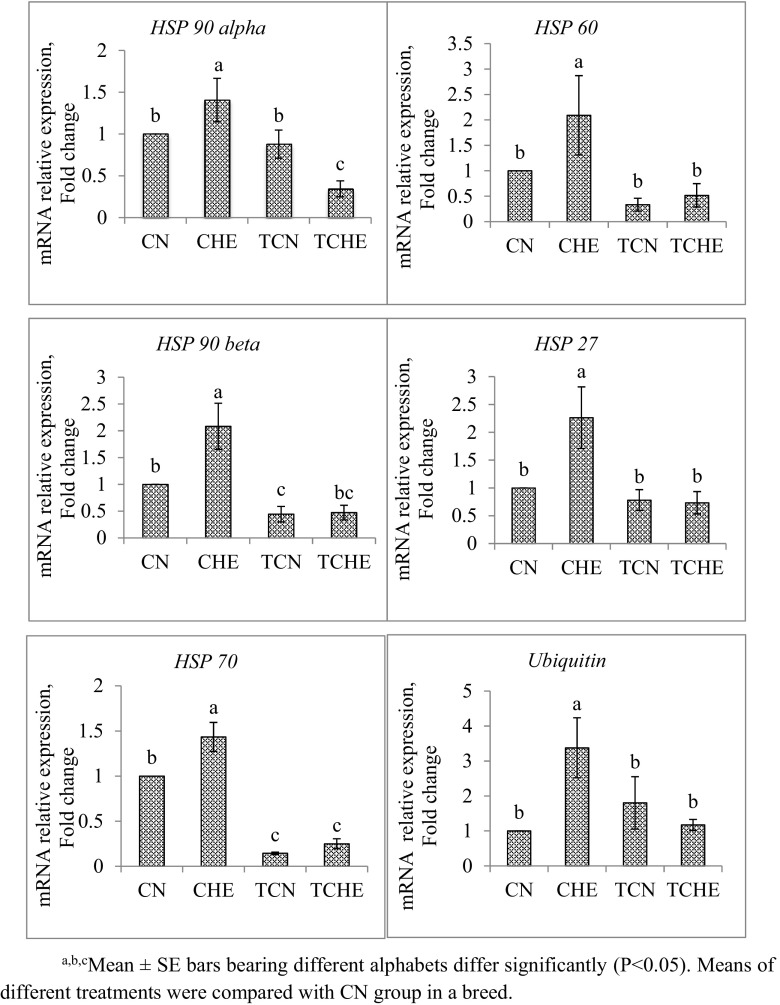
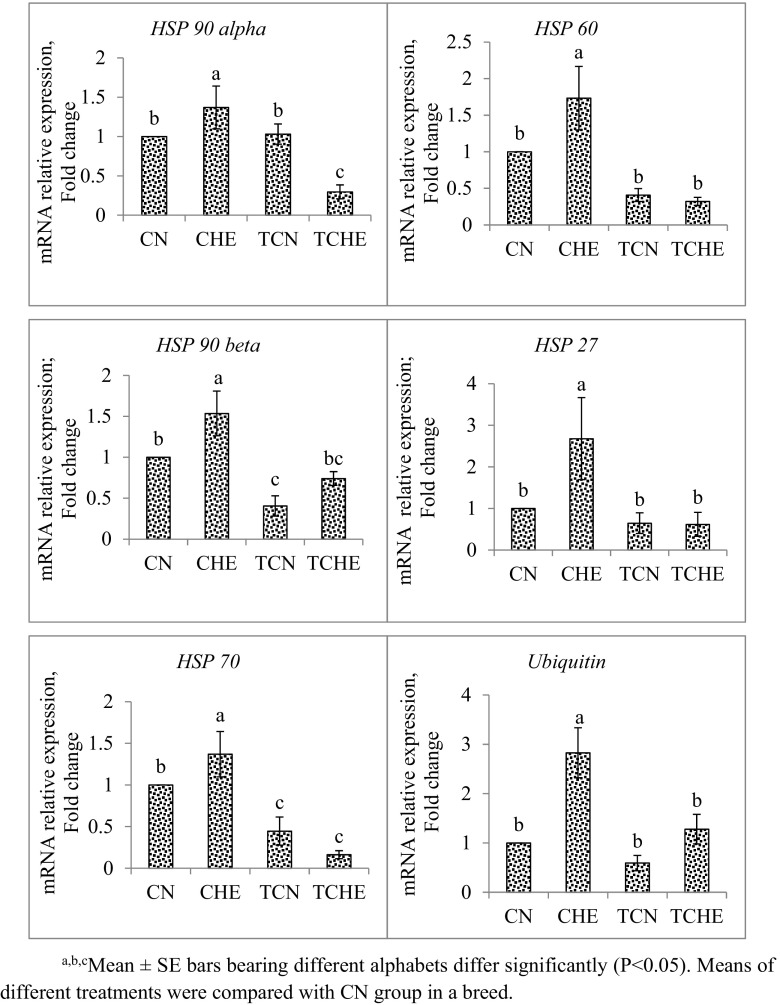
mRNA expression of HSP 90 alpha, HSP 90 beta, HSP 70, HSP 60, HSP 27, and ubiquitin gene in brain tissue of 42-day-old chicks are shown in Figs. 2 and 3. In both NN and PB-2, the mRNA expression of all the HSP genes studied was significantly (P ≤ 0.05) downregulated in TCHE chicks with respect to CHE chicks. Furthermore, CHE chicks showed the highest expression of all HSP genes.
Fig. 2.
HSP gene expression in brain of NN chicks at 42 days of age. a, b, cMean ± SE bars bearing different alphabets differ significantly (P < 0.05). Means of different treatments were compared with CN group in a breed
Fig. 3.
HSP gene expression in brain of PB-2 chicks at 42 days of age. a, b, cMean ± SE bars bearing different alphabets differ significantly (P < 0.05). Means of different treatments were compared with CN group in a breed
Protein expression
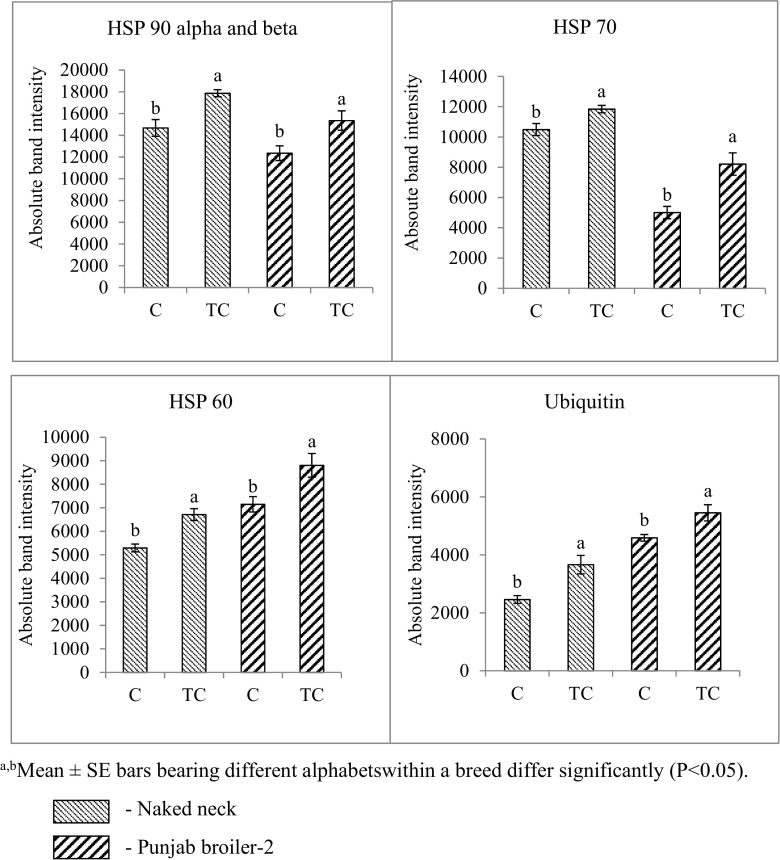
The immunoblot results of HSP 90 alpha and beta, HSP 70, HSP 60, and ubiquitin protein revealed significantly (P ≤ 0.05) higher protein band intensity in TC embryo compared to C embryo of both NN and PB-2 chicken, in brain tissue (Supplemental Fig. 1).
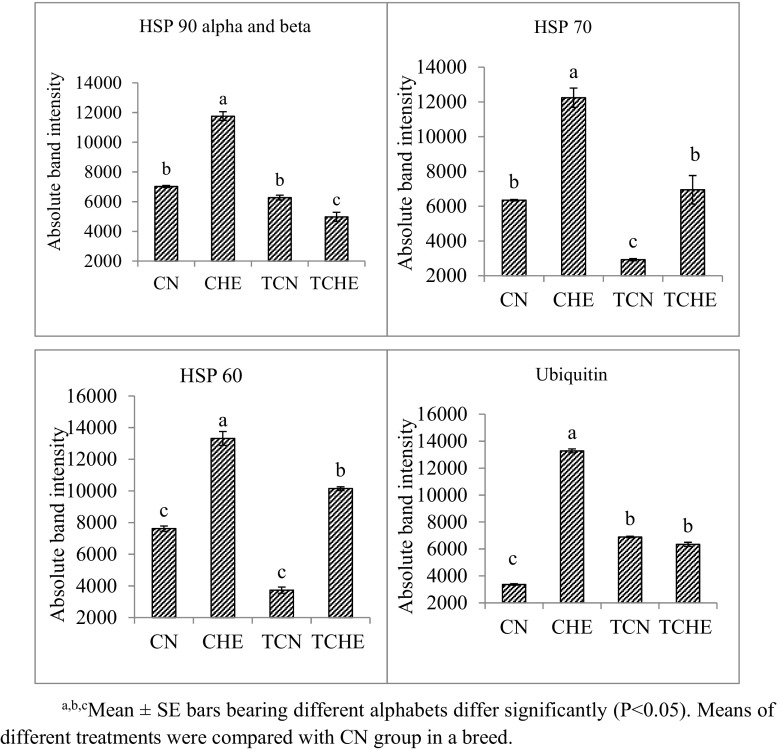
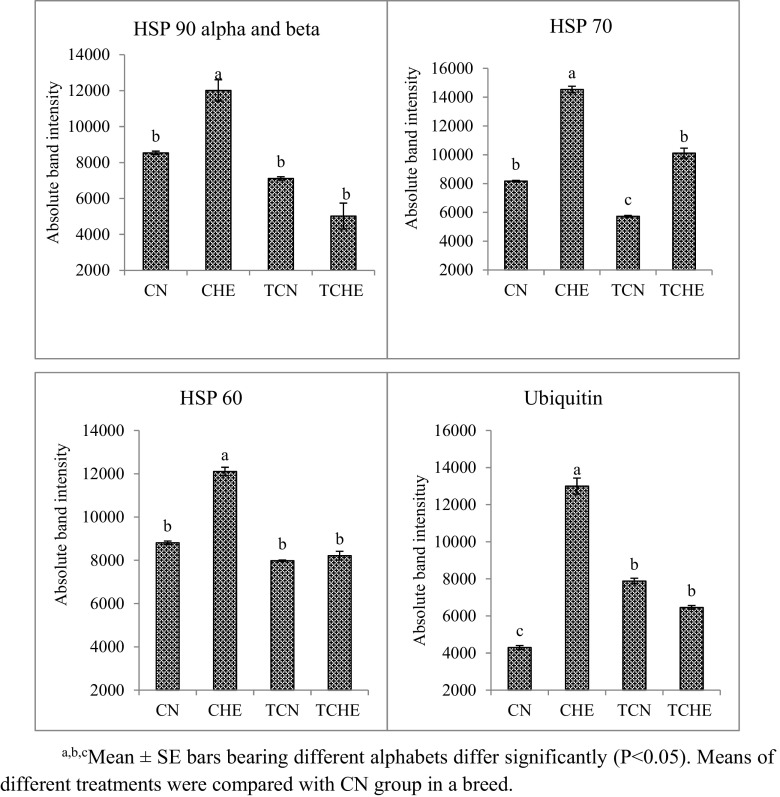
All HSPs studied from brain tissue of 42-day-old chicks had significantly (P ≤ 0.05) lower expression in the TCHE group when compared to the CHE group of both NN and PB-2 (Supplemental Fig. 2; Figs. 4, 5, and 6). The results revealed a direct correlation between protein expression and mRNA expression.
Fig. 4.
Heat shock protein expression in brain of embryos sacrificed on 17th day of incubation. a, bMean ± SE bars bearing different alphabets within a breed differ significantly (P < 0.05)
Fig. 5.
Heat shock protein expression in brain of NN chicks on 42nd day of age. a, b, cMean ± SE bars bearing different alphabets differ significantly (P < 0.05). Means of different treatments were compared with CN group in a breed
Fig. 6.
Heat shock protein expression in brain of PB-2 chicks on 42nd day of age. a, b, cMean ± SE bars bearing different alphabets differ significantly (P < 0.05). Means of different treatments were compared with CN group in a breed
Promoter methylation of HSP 90 alpha gene
The sequencing results revealed that the HSP 90 alpha was methylated in both C and TC groups of 17th-day embryo, with no significant difference between the breed and treatment (Table 4).
Table 4.
DNA methylation in HSP genes of the developing embryos following heat exposure
| Gene | NN (%) | PB-2 (%) | ||
|---|---|---|---|---|
| Control (C) | Thermal conditioning (TC) | Control (C) | Thermal conditioning (TC) | |
| HSP 90 alpha | 18.51 ± 1.85 | 18.51 ± 0.69 | 18.51 ± 1.85 | 18.51 ± 0.69 |
| HSP 90 beta | 6.94 ± 0.69 | 4.86 ± 0.89 | 5.56 ± 1.83 | 5.50 ± 0.69 |
| HSP 70 | 6.30 ± 0.90 | 5.40 ± 0.16 | 9.90 ± 0.90 | 8.10 ± 0.16 |
In 42-day-old chicks of both NN and PB-2, HSP 90 alpha promoter region was significantly (P ≤ 0.05) hypermethylated in the TCHE group and significantly (P ≤ 0.05) hypomethylated in the CN, TCN, and CHE groups. There was no significant difference observed among CN, TCN, and CHE chicks (Table 5). The overall methylation is higher in PB-2 (21.08 ± 0.38%) and lower in NN (19.87 ± 0.37%); however, the difference was not significant (Table 6).
Table 5.
DNA methylation in HSP genes in the chicks
| Gene | NN (%) | PB-2 (%) | ||||||
|---|---|---|---|---|---|---|---|---|
| CN | CHE | TCN | TCHE | CN | CHE | TCN | TCHE | |
| HSP 90 alpha | 17.85 ± 1.30b | 18.51 ± 1.06b | 17.18 ± 0.29b | 25.92 ± 1.06a | 18.51 ± 1.06b | 19.51 ± 0.92b | 18.51 ± 1.06b | 27.7 ± 0.08a |
| HSP 90 beta | 17.36 ± 0.69b | 12.50 ± 1.20c | 15.97 ± 1.83b | 18.75 ± 0.8a | 18.05 ± 0.69b | 12.50 ± 1.20c | 14.58 ± 1.20b | 25.00 ± 1.20a |
| HSP 70 | 6.30 ± 0.52c | 12.6 ± 1.04b | 6.30 ± 0.55c | 14.4 ± 1.04a | 9.90 ± 0.51d | 16.21 ± 0.08b | 13.51 ± 0.10c | 24.3 ± 0.13a |
a, b, cMean ± SE with different superscripts in a row and within a breed differ significantly (P < 0.05). Means of different treatments were compared with CN group in a breed
Table 6.
Overall DNA methylation of HSP genes in NN and PB-2 breeds of chicken
| Gene | NN (%) | PB-2 (%) |
|---|---|---|
| HSP 90 alpha | 19.87 ± 0.37 | 21.08 ± 0.38 |
| HSP 90 beta | 16.14 ± 0.85 | 17.53 ± 1.50 |
| HSP 70 | 9.90 ± 0.36b | 15.99 ± 0.46a |
a, bMean ± SE with different superscripts in a row differ significantly (P < 0.05)
CpG positions at 281, 310, and 329 were methylated in the 17th-day embryo as well as 42nd-day chick of both PB-2 and NN. In addition, the CpG site positioned at 320 and 352 had newly occurred in the TCHE group of 42nd-day chicks of both lines. Moreover, CpG located at regions 155, 160, 175, 192, 198, 208, 213, 231, 241, 259, 274, 278, 305, and 384 were completely unmethylated throughout the experimental period.
Correlation analysis between the frequency of methylation and gene expression of HSP 90 alpha indicated that in 42-day-old chicken, methylation had an inverse relation with gene expression in all the treatment groups of NN birds. However, such an inverse relation could not be traced in PB-2 except the TCN group (Table 7).
Table 7.
Comparison of HSP 90 alpha gene expression and methylation between different treatments in NN and PB-2 chicken
| HSP 90 alpha | NN | PB-2 | ||||||
|---|---|---|---|---|---|---|---|---|
| CN | CHE | TCN | TCHE | CN | CHE | TCN | TCHE | |
| Gene expression (40 − ΔCt) | 42.86 ± 0.26b | 43.7 ± 0.18a | 42.90 ± 0.20b | 41.41 ± 0.34c | 43.14 ± 0.44b | 44.68 ± 0.21a | 42.06 ± 0.20b | 40.25 ± 0.83c |
| Methylation (%) | 17.85 ± 1.30b | 18.51 ± 1.06b | 17.18 ± 0.29b | 25.92 ± 1.06a | 18.51 ± 1.06b | 19.51 ± 0.92b | 18.51 ± 1.06b | 27.7 ± 0.08a |
| Pearson correlation | −0.65 | −0.05 | −0.68 | −0.66 | 0.96 | 0.98 | −1.00 | 0.41 |
a, b, cMean ± SE with different superscripts in a row and within a breed differ significantly (P < 0.05). Means of different treatments were compared with CN group in a breed
Promoter methylation of HSP 90 beta gene
Sequencing revealed no significant difference in the 17th-day embryo in both NN and PB-2 embryos. The average methylation of C and TC groups in NN was 6.94 ± 0.69% and 4.86 ± 0.89%. In PB-2, it was similar in both C and TC groups (5.56 ± 1.83% and 5.5 ± 0.69%) (Table 4).
At 42 days of age, the average methylation of CN, CHE, TCN, and TCHE groups were 17.36 ± 0.69%, 12.50 ± 1.20%, 15.97 ± 1.83%, and 18.75 ± 0.8% in NN chicks and 18.05 ± 0.69%, 12.50 ± 1.20%, 14.58 ± 1.20%, and 25.00 ± 1.20% in PB-2 chicks, respectively. This demonstrated that the methylation frequency was significantly (P ≤ 0.05) higher in the TCHE group followed by CN and TCN groups, and it was significantly (P ≤ 0.05) lower in the CHE group of both lines (Table 5). However, there was no significant difference between NN and PB-2. However, with regard to the overall methylation incidence, it was higher in PB-2 (17.53 ± 1.50%) and lower in NN chicks (16.14 ± 0.85%) (Table 6).
The individual CpG dinucleotide profile of HSP 90 beta gene in both NN and PB-2 revealed different methylation patterns among the treatment groups at CpG regions 694, 723, 759, 798, 800, 897, and 924. These regions were also spanned by transcription factor binding sites, namely UCE, PEBP-2, GCF, and SP-1. Apart from these sites, CpG at positions 630, 742, 762, 771, 779, 805, 808, 811, 856, and 884 were also methylated in both lines. However, CpG at positions 615, 621, 638, 648, 665, 676, 681, 698, 705, 707, 730, 733, 740, 762, 782, 811, 824, 839, 841, 843, 860, 869, 874, 878, 881, 907, 917, 919, 929, and 933 were unmethylated in both breeds.
Comparative analysis drawn between methylation and gene expression of HSP 90 beta gene (Table 8) revealed that the gene expression and methylation of HSP 90 beta were negatively correlated in the CN, CHE, TCN, and TCHE groups of both NN and PB-2 chicks.
Table 8.
Comparison of HSP 90 beta gene expression and methylation between different treatments in NN and PB-2 chicken
| HSP 90 beta | NN | PB-2 | ||||||
|---|---|---|---|---|---|---|---|---|
| CN | CHE | TCN | TCHE | CN | CHE | TCN | TCHE | |
| Gene expression (40 − ΔCt) | 35.11 ± 0.36b | 40.23 ± 0.90a | 32.75 ± 0.14c | 33.18 ± 0.62bc | 35.78 ± 0.18b | 39.82 ± 0.82a | 33.39 ± 0.44c | 34.74 ± 0.33bc |
| Methylation (%) | 17.36 ± 0.69b | 12.50 ± 1.20c | 15.97 ± 1.83b | 18.75 ± 0.8a | 18.05 ± 0.69b | 12.50 ± 1.20c | 14.58 ± 1.20b | 25.00 ± 1.20a |
| Pearson correlation | −0.18 | −0.55 | −0.56 | −0.14 | −0.90 | −0.06 | −0.29 | −0.63 |
a, b, cMean ± SE with different superscripts in a row and within a breed differ significantly (P < 0.05). Means of different treatments were compared with CN group in a breed
Promoter methylation of HSP 70 gene
The methylation of HSP 70 promoter region was insignificant in the 17th-day embryo. The average methylation incidence of C and TC groups was 6.30 ± 0.90%, 5.40 ± 0.16% in NN chicks and 9.90 ± .90%, 8.10 ± .16% in PB-2 chicks. Thus, the percentage of methylation was higher in the C group of both lines (Table 9).
Table 9.
Comparison of HSP 70 gene expression and methylation between different treatments in NN and PB-2 chicken
| HSP 70 | NN | PB-2 | ||||||
|---|---|---|---|---|---|---|---|---|
| CN | CHE | TCN | TCHE | CN | CHE | TCN | TCHE | |
| Gene expression (40 − ΔCt) | 41.79 ± 0.37b | 43.78 ± 0.18a | 39.9 ± 0.22c | 39.95 ± 0.36c | 42.18 ± 0.57b | 44.04 ± 0.27a | 40.28 ± 0.33c | 40.30 ± 0.06c |
| Methylation (%) | 6.30 ± 0.52c | 12.6 ± 1.04b | 6.30 ± 0.55c | 14.4 ± 1.04a | 9.90 ± 0.51d | 16.21 ± 0.08b | 13.51 ± 0.10c | 24.3 ± 0.13a |
| Pearson correlation | −0.39 | −0.52 | −0.45 | −0.26 | 0.99 | 0.99 | −0.42 | 0.96 |
a, b, cMean ± SE with different superscripts in a row and within a breed differ significantly (P < 0.05). Means of different treatments were compared with CN group in a breed
Sequencing results of 42-day-old chicks revealed noteworthy differences in the methylation pattern of the promoter region of HSP 70. Among NN chicken, TCHE showed significantly (P ≤ 0.05) higher methylation (14.4 ± 1.04%) in comparison with the other three treatments, which had significantly (P ≤ 0.05) reduced methylation: CN (6.30 ± 0.52%), TCN (6.30 ± 0.55%), and CHE (12.6 ± 1.04%). In NN, methylation occurred in sites 519, 583, 757, 767, 785, and 789. CN group was significantly (P ≤ 0.05) hypomethylated in PB-2 than the rest, while TCHE was significantly (P ≤ 0.05) hypermethylated, followed by CHE (16.21 ± 0.08%) and TCN (13.51 ± 0.10%) (Table 4).
The overall methylation frequency was significantly (P ≤ 0.05) higher in PB-2 (15.99 ± 0.46%), in comparison with NN (9.90 ± 0.36%) (Table 6).
Methylation had emerged at sites 519, 583, 757, 761, and 767 in both NN and PB-2. In addition, PB-2 birds were also methylated at positions 543, 634, 653, 683, 680, and 729. Nonetheless, CpG located at sites 425, 432, 438, 442, 452, 460, 478, 495, 498, 502, 536, 550, 554, 578, 589, 607, 609, 638, 648, 653, 658, 698, 725, 769, 778, and 806 were completely unmethylated in both breeds.
Promoter region methylation of HSP 70 as well as its mRNA expression was negatively associated in the control and heat-treated batches (CN, CHE, TCN, and TCHE) of NN chicken. Similar results were observed in the TCN group of PB-2, whereas CN, CHE, and TCHE group of PB-2 failed to demonstrate any such association (Table 9).
Promoter methylation of HSP 60 gene
No methylation could be detected in the promoter region of HSP 60 in both NN and PB-2. The region also displayed 67 dinucleotides and transcription factor binding sites (SP-1, AP-2, GCF, and JCV).
Promoter methylation of ubiquitin gene
Ubiquitin promoter region did not show any methylation neither in NN nor in PB-2, which contain 18 CpG dinucleotides, heat shock element, and numerous transcription factor binding sites. This includes TFII-1, CTF, CREB, E4F1, NF-S, SP-1, JCV, GCF, AP-2, and APRT.
Luciferase reporter assay
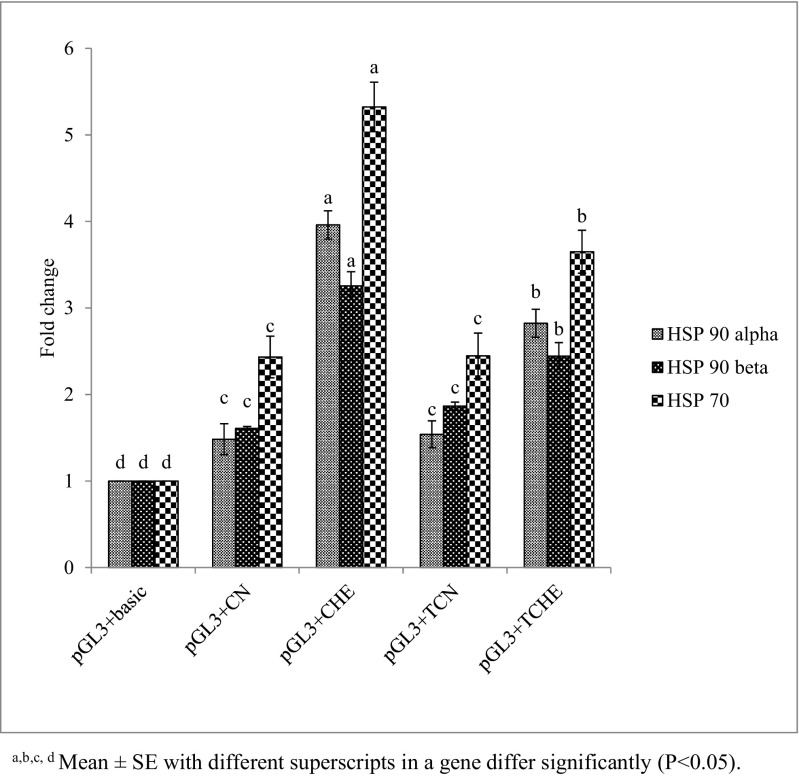
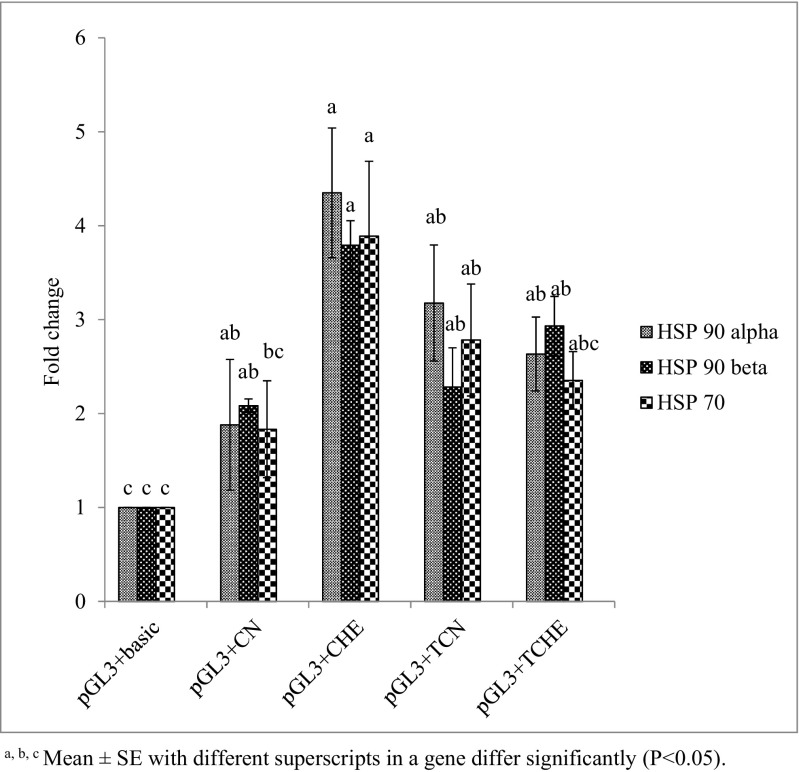
In both NN and PB-2 chicks, HSP 90 beta exhibited significantly (P ≤ 0.05) decreased activity in TCHE and significantly (P ≤ 0.05) increased activity in CHE. However, the CN and TCN groups showed homogenous results (Fig. 7). Similar findings were noticed in HSP 90 alpha and HSP 70 of NN. However, in PB-2, these genes displayed no modifications (Fig. 8). This outcome shows that the weak activity of HSP 90 alpha, HSP 90 beta, and HSP 70 promoter region in the TCHE group was the sequel of high levels of methylation which in turn affected the luciferase activity. On the other hand, promoter activity was strong in CHE, which was less methylated.
Fig. 7.
Luciferase activity in NN chicks. a, b, c, dMean ± SE with different superscripts in a gene differ significantly (P < 0.05)
Fig. 8.
Luciferase activity in PB-2 chicks. a, b, cMean ± SE with different superscripts in a gene differ significantly (P < 0.05)
2DE and MALDI-TOF
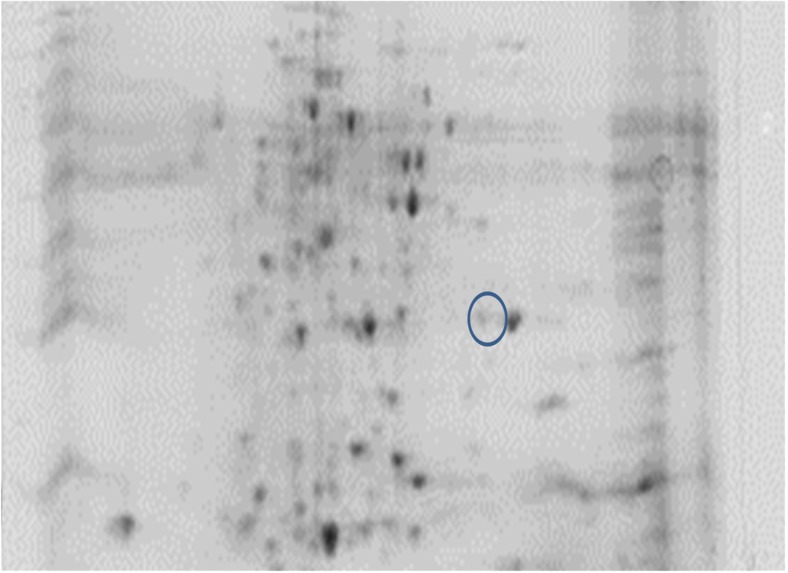
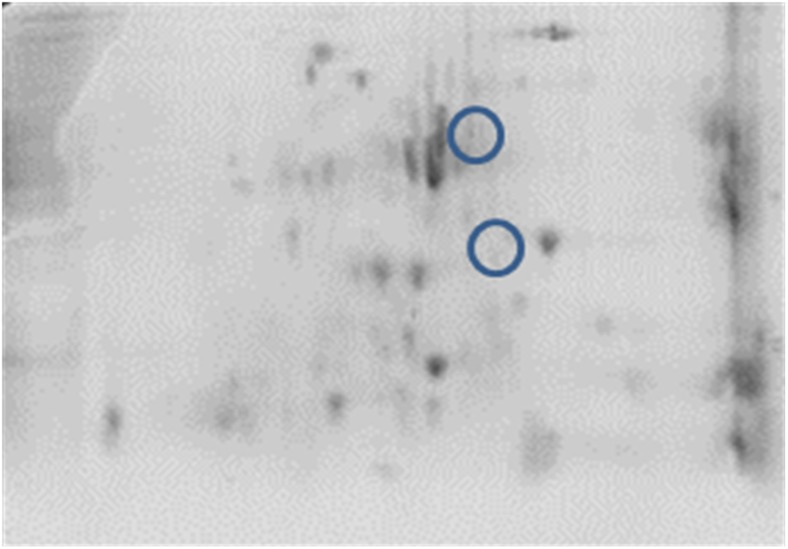
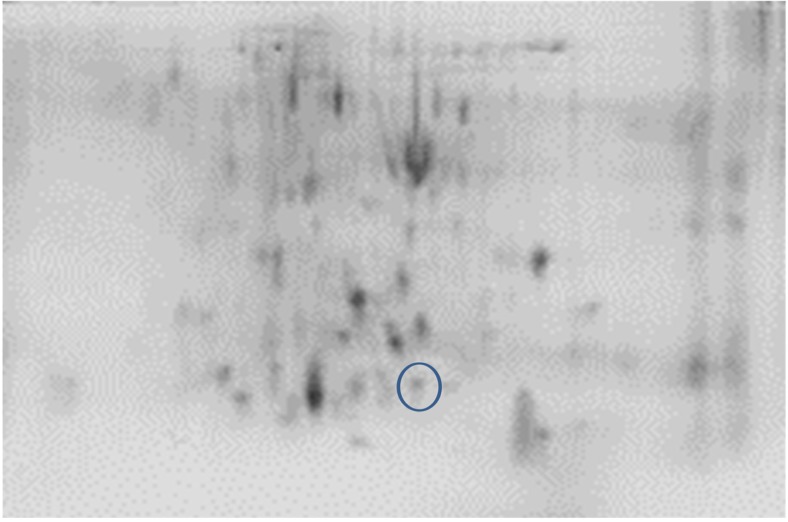
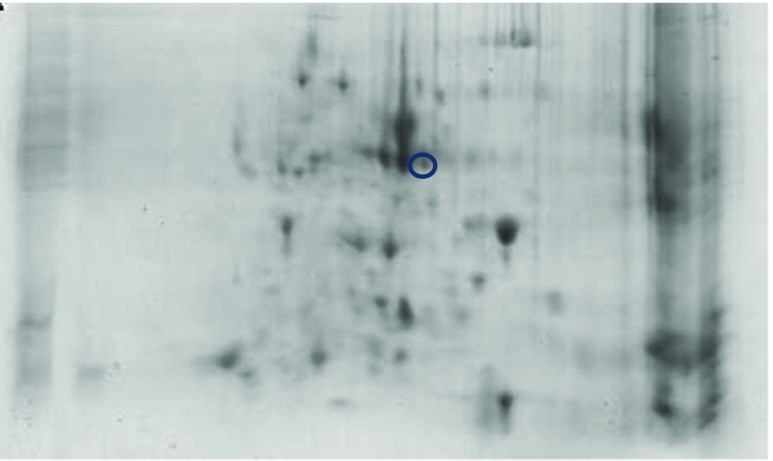
Comparative analysis between the treatments was executed using PD quest software. In NN, two new spots were discovered in TC and one in C group (Figs. 9 and 10). However, no new protein was seen in the PB-2 17th-day embryo. On the 42nd day of age, two spots were tracked in TCN and TCHE group of PB-2 birds and the intensity of NN was indistinguishable (Figs. 11 and 12).
Fig. 9.
2-DE of control group on NN embryo
Fig. 10.
2-DE of thermal conditioning on NN embryo
Fig. 11.
2-DE of TCN group on PB-2 chicks
Fig. 12.
2-DE of TCHE group on PB-2 chicks
The new spots identified were subjected to MALDI-TOF analysis and were identified as cytochrome p450, alpha enolase, microtubule-actin cross-linking factor 1, UMP-CMP kinase, and fructose-bisphosphate aldolase C. Protein score greater than 73 were considered as significant (Table 10).
Table 10.
Protein identified by MALDI-TOF analysis
| Accession number | Name of protein | Protein score | Mass |
|---|---|---|---|
| gi|471411753 | Cytochrome p450 | 92 | 57,726 |
| ENOA_CHICK | Alpha enolase | 92 | 47,617 |
| gi|961792163 | Microtubule-actin cross-linking factor 1 | 106 | 911,088 |
| KCY_CHICK | UMP-CMP kinase | 74 | 22,386 |
| gi|330417943 | Fructose-bisphosphate aldolase C | 111 | 39,735 |
Discussion
Thermal adaptation at the time of embryogenesis is a valuable option to lessen the impact of heat stress in postnatal life. Changes in the incubatory temperature induced during the late stages of embryo development have been shown to influence the neuronal thermoregulatory mechanisms at the center and periphery (Tzschentke 2007) and epigenetic temperature adaptation (Loh et al. 2004). Though higher incubatory temperature reduces hatchability, the effect mainly depends on the duration and strength of heat exposure, apart from the phase of embryonic growth (Halle and Tzschentke 2011; Narinc et al. 2016). Similar to the present findings, other workers too have reported no difference in hatchability (Yahav et al. 2004; Werner et al. 2010; Loyau et al. 2013; Rajkumar et al. 2015b) in broiler and turkeys. Alteration in cFos expression in the hypothalamus (Janke and Tzschentke 2010) has been shown to be responsible for the long-lasting sequel of change in incubation temperature which provided the embryos the capacity to adjust to the short-term rise in temperature without any ill effects on hatching.
The prenatal heat exposure did not cause any significant variation in body weight of 1- and 14-day-old chicks. The lower body weight in the CHE group during the 21- to 42-day period indicates that the birds were in a state of stress, as a result of which their feed consumption was reduced in order to lower heat production. Meanwhile, the higher body weight achieved in the TCHE group implies that embryonic thermal conditioning has had a positive impact on the birds that enabled them to mitigate the heat stress even though they were reared at a temperature of 35 °C. In contrast, others had reported that increased incubation temperature did not affect growth traits in broiler chicks (Werner et al. 2010; Narinc et al. 2016; Morita et al. 2016). Recently, Rajkumar et al. (2015b) reported higher body weight in thermal manipulated NN chicken but not in PB-2.
Thyroid hormones play a key role in the regulation of metabolism and in the maintenance of the milieu interior of birds (Mcnabb and King 1993; Renden et al. 1994). Heat stress markedly reduces the thyrotropic axis as revealed by reduced plasma T3 concentration (Williamson et al. 1985; Decuypere and Kühn, 1988) culminating in functional hypothyroidism (Mitchell and Carlisle 1992). Furthermore, to reduce metabolic heat production, peripheral T3 is maintained low during high ambient temperature (Melesse et al. 2011). Other reports have also described a significant drop in levels of T3 and decreased metabolic rate in thermally conditioned chicken (Piestun et al. 2011; Al-Zghoul et al. 2015; Al- Rukibat et al. 2017). The present observations differ from that of Rajkumar et al. (2015a) where thermal manipulation did not alter the T3 level chicken.
Heat stress kindles the hypothalamus–pituitary–adrenal axis resulting in elevated plasma concentrations of corticosterone in chicken (Zulkifli et al. 2009). The higher increase in corticosterone levels in heat-exposed groups in the present study is similar to other reports (Piestun et al. 2008; Melesse et al. 2011). Al-Zghoul et al. (2015) had reported no change in corticosterone concentration after thermal challenge in birds that underwent thermal manipulation during the embryonic age.
Environmental stress agents evoke a cellular and molecular response in all living organisms, the most important being stimulation of HSP protein synthesis (Lindquist 1986). These HSPs enable the cells to conserve their metabolic homeostasis and structural integrity and also guard against stressors like heat stress, ischemia, cytotoxicity, etc. (Hagiwara et al. 2007).
Ubiquitin has been shown to be expressed in heat shocked chick embryo fibroblasts (Bond and Schlesinger 1985). Heat stress causes raised expression of HSP 27 and HSP 70 genes in chicken (Liu et al. 2014; Vinoth et al. 2015). Among all, a small HSP 27 appears to be most strongly induced by stress. Small HSP 27 oligomers aid in the confrontation of thermal challenge through their interaction with the actin cytoskeleton (Landry and Huot 1995). Furthermore, HSP 27 multi-subunit complex also contributes to ubiquitin-mediated protein degradation.
In the present experiment, the relative mRNA expression of all HSP genes studied in brain tissue of 17-day-old embryos were upregulated in the TC group of both NN and PB-2 chicken, excluding HSP 60 which failed to exhibit any significant change in both breeds. Thus, the results imply that the raised incubatory temperature was indeed stressful to the embryos. Indistinguishable observations were made in muscle mRNA level of HSP 70 in chicks that were thermal manipulated (Al-Zghoul et al. 2013), and HSP 90 and HSP 60 in muscle, heart, and brain (Al-Zghoul et al. 2015).
The HSP’s mRNA expressions in brain tissue were lower in TCHE birds of NN and PB-2, thus establishing evidence on the valuable role played by embryonic heat exposure. CHE chicks exhibited the maximum expression of all HSP genes. The heat-stressed state of CHE chicken was ascertained by the higher HSP expression when compared with the TCHE group of both NN and PB-2 lines.
The contribution of cellular mechanisms to the long-term effect of thermal manipulation is quite complex, and contradicting observations were often encountered. One school of thought suggests that high HSP expression is linked with better heat tolerance (Wang and Edens 1998; Al-Zghoul et al. 2013) while the other proposes lower levels of expression (Yahav et al. 1997). The present findings were in accordance with Yahav et al. (1997) and Rajkumar et al., 2015a, 2016) wherein thermal conditioning during early age induced thermotolerance by means of enhanced adaptation, with the outcome of low degree of HSP expression. In addition, heat-accustomed bovine manifested lower HSP 70 and better cell survival during heat challenge than the less adapted bovines (Kamwanja et al. 1994; Lacetera et al. 2006). Similar speculation has been put forth in chicken by Mazzi et al. (2002). They reported that when heat stress is targeted on heat-resistant, naked neck label rouge, their hepatic HSP 70 expression was much lesser than the full-feathered bird. The genes which serve as regulators of energy metabolism were reduced in the thermal manipulated group asserting that embryonic thermal manipulation had decreased the metabolic heat production to be capable of tolerating higher temperature scenarios at later life (Loyau et al. 2014).
Following exposure to adverse environmental factors, animals may develop changes in the stability of their epigenomes throughout their lifetimes (Daxinger and Whitelaw 2010). Alterations that happen during the short critical developmental period of pre- and early postnatal ontogeny are described as an epigenetic thermal adaptation. This modifies the physiological control system to cause lifelong adaptation to manage an expected postnatal environmental situation (Tzschentke and Plagemann 2006). One among the epigenetic modifications that contribute to the modulation of gene expression is DNA methylation. The 5′ position of cytosine in CpG dinucleotides, generally found in clusters called CpG islands, is the usual site of DNA methylation (Gardiner and Frommer 1987). In the present study, the methylation levels of HSP 90 alpha, beta, and 70 isolated from the brain tissue of 17-day-old embryos failed to express any significant difference between the C and TC treatments of both NN and PB-2 chicken. The methylation level in all HSP promoter regions was numerically lower in TC and their mRNA expression was higher. This is consistent with the findings of Yossifoff et al. (2008) where thermal conditioning of early-age birds caused transient changes in the mRNA expression of brain-derived neurotrophic factor that coincided with the changes in the CpG methylation pattern of the promoter region.
The present study results clearly demonstrated a higher methylation level of HSP 90 alpha, beta, and HSP 70 in TCHE compared to CHE and was related to their mRNA expression at 42 days of age. In NN birds, mRNA expression was lower in TCHE and higher in CHE. A similar observation was made in chicken (Li et al. 2011) and bovine (Su et al. 2014) where promoter methylation acts as a repressive epigenetic marker which downregulates gene expression. This is consistent with the studies of Gan et al. (2013) where an inverse relationship between mRNA expression and methylation in the promoter region of HSP 70 in leg muscle of chicken when subjected to a stressful condition was described. However, no such relationship could be made out with respect to HSP 90 alpha and HSP 70 gene in the treatment groups of PB-2 chicks except TCN group. This may be due to the effect of breed or tissue studied and the different function of genes.
In the present study, the overall methylation frequency of HSP 70 was significantly higher in PB-2 and lower in NN. According to Xu et al. (2007), the overall methylation varied among the different tissues and strains of chicken, which could be assigned to gene expression and the developmental stage of tissue. The individual CpG dinucleotide profile of HSP 90 alpha, beta, and HSP 70 gene of both NN and PB-2 of this study revealed differential methylation patterns among the treatment groups.
In the present study, transcription factor binding sites were also noticed in the promoter region of HSP 90 beta (APRT, SEQ-1, AP-2, UCE, PEBP-2, GCF, and SP-1) and HSP 70 (CTF, T-Ag, and SP-1). Methylation at specific CpG positions may exert an influence over the affinity exerted by specific transcription factors toward the DNA molecule (Deaton and Bird 2011).
The 17th-day embryos and 42-day-old chicken of both NN and PB-2 demonstrated no methylation in the HSP 60 and ubiquitin promoter regions containing 67 and 18 CpG dinucleotides, respectively. Similar results were obtained by Rocamora and Agell (1990) where liver tissue was almost unmethylated in the 5′ non-coding region of ubiquitin gene which contains the heat shock promoter element. In a study conducted using microarray, the muscle tissue of wild and domesticated chicken did not show any methylation in the proximal promoter region of the genes responsible for growth and development (Li et al. 2015). There is evidence that the methylation-free state of CpG island (CGI) is causally related to their function as promoters. Deletion or mutation of Sp1 transcription factor binding sites in the mouse Aprt promoter results in a failure to maintain the unmethylated state of the Aprt CGI in transgenic experiments (Macleod et al. 1994). This implies that the transcription factor binding site and their regulation during the developmental stage is necessary for the establishment of the DNA methylation-free state.
Luciferase reporter gene assay was chosen to evaluate the function of HSP 90 alpha, beta, and HSP 70 promoter regions which contained differentially methylated CpG dinucleotides in the different treatment groups (CN, CHE, TCN, and TCHE) of both NN and PB-2 at 42 days of age. This study finding suggests that promoter function was affected in TCHE compared to CHE in all the HSP genes of NN birds, while CN and TCN groups maintained at 25 °C demonstrated similar activity in their promoter regions. High levels of methylation could be the cause for the weak activity of HSP 90 alpha, HSP 90 beta, and HSP 70 promoter regions in the TCHE batch, which in turn affected the luciferase activity. However, promoter activity was strong in CHE, which was less methylated. The higher promoter activity of all the HSP genes of CHE was functional in enhancing transcription factor binding and in amplifying the synthesis of HSP. This was also related to the low methylation status. In contrast to CHE, the activity of promoter region and the resultant transcription factor binding was less in TCHE birds which were thermally manipulated at the embryonic stage; this reflects their stress-free condition. The promoter activity was insignificant in all HSP genes (HSP 90 alpha, beta, and HSP 70) of the PB-2 breed; nonetheless, the trend in NN was followed here, too. Due to the presence of numerous CpG dinucleotides and since transcription factors were covered in the promoter regions of HSP genes studied, we failed to discriminate which CpG dinucleotide and transcription binding factor are responsible for the epigenetic adaptation. Further research is needed to study the individual CpG dinucleotide expression.
Two-dimensional gel electrophoresis
Earlier studies have discussed about the differential expression of proteins due to abiotic challenges such as heat (Tomanek and Zuzow 2010), drought (Durand et al. 2011; Kang et al. 2012), salt (Guo et al. 2012), cold (Yan et al. 2006), and oxidative stress (Turk et al. 2012) using proteomics-based technologies. In 17th-day NN embryos, 402 spots were analyzed using PD quest software, with the discovery of two new spots unique to TC group and one new spot in C group which was absent in TC. Nevertheless, no new protein could be seen in the PB-2. At 42 days of age, the consistency of protein was nil in the observations made. However, two new spots were detected in the TCN and TCHE groups of 42-day-old PB-2 birds. To confirm the protein, peptide sequencing was performed and bioinformatics analysis made with the help of NCBInr or Swiss-Prot database using MASCOT-PMF program (Table 10). Protein score greater than 70 was considered significant (P ≤ 0.05), and they were cytochrome p450 and alpha enolase in TC group, microtubule-actin cross-linking factor-1 in C group of 17th-day embryos, and UMP-CMP kinase and fructose-bisphosphate aldolase C in 42-day-old TCHE and TCN chicks, respectively. The higher protein expression of alpha enolase (ENO1) in TC birds with reduced or absent expression in C group resembles the observations made by Zeng et al. (2013), who reported enhanced alpha enolase activity in heat-stressed Muscovy and Pekin ducks. Alpha enolase (ENO1) has a key role in the development of stress responses (Ji et al. 2016). Proteomic studies on the mechanisms underlying the development of cellular stress responses have shown that ENO1 is one of the proteins that are expressed differentially before and after stress exposure. In order to accustom to high temperatures and glucose deprivation, specific proteins such as heat shock proteins and glucose-regulated proteins like ENO1 are expressed at the cellular level (Young and Elliott 1989). Another enzyme, cytochrome p450, which is responsible for synthesizing various hormones including progesterone, was upregulated in the TC group embryos. McCracken et al. (2015) suggested that adverse reproductive outcomes may be encountered due to heat stress because of the reduction of enzymes essential for progesterone breakdown. The decreased mRNA expression of cytochrome p450 in heat-stressed laying hens may affect their ovaries (Rozenboim et al. 2007). However, this contradicts the current findings. A 600-kDa spectraplakin called microtubule-actin cross-linking factor synchronizes the cytostructural response to environmental cues by guiding the microtubules along actin stress fibers (Wu et al. 2008) and regulates cardiomyocyte microtubule distribution and adaptation to hemodynamic overload (Fassett et al. 2013). The genes encoding glycolytic enzymes such as fructose-bisphosphate aldolase C (ALDOC) are expressed in nearly every animal cell; they are crucial in cellular ATP production during hypoxia (Wang et al. 2007). The transcriptional level of the ALDOC gene was seven to nine times higher in embryos that grew normally compared to the dead embryos of Tibetan and White Leghorn chicken (Wang et al. 2007). The enzyme UMP-CMP kinase is involved in both the de novo and salvage pathways of nucleosides and catalyzes the synthesis of UTP, CTP, and dCTP (Pasti et al. 2003), and it was highly expressed in human liver, pancreas, and muscle tissues (Rompay et al. 1999).
This study concludes that thermal conditioning during embryogenesis has a positive impact and improves their thermotolerance capacity in postnatal life, as revealed by the reduced expression of HSP genes and proteins in colored broiler chicken. Changes in the methylation level of HSP promoter region involved in heat stress might serve as an important factor contributing to epigenetic adaptation.
Electronic supplementary material
(PDF 58 kb).
(PDF 63 kb).
(PDF 50 kb).
(PDF 53 kb).
Footnotes
Electronic supplementary material
The online version of this article (10.1007/s12192-017-0837-2) contains supplementary material, which is available to authorized users.
References
- Almeida AD, Cardoso LGA (2001) African poultry—limitations and development perspectives. Rev Port Cienc Vet 96:114–124.
- Al-Rukibat RK, Al-Zhgoul MB, Hanenah WM, Al-Natour MQ, Abu-Basha EA. Thermal manipulation during late embryogenesis: effect on body weight and temperature, thyroid hormones and differential white blood cell counts in broiler chicken. Poult Sci. 2017;96:234–240. doi: 10.3382/ps/pew298. [DOI] [PubMed] [Google Scholar]
- Al-Zhgoul MB, Dala AES, Ababneh MM, Jawasreh KI, Al Busadah KA, Ismail ZB. Thermal manipulation during chicken embryogenesis results in enhanced Hsp70 gene expression and the acquisition of thermotolerance. Res Vet Sci. 2013;95:502–507. doi: 10.1016/j.rvsc.2013.05.012. [DOI] [PubMed] [Google Scholar]
- Al-Zghoul MB, Ismail ZB, Dalab AES, Al-Ramadan A, Althnaian TA, Al-ramadan SY, Ali AM, Albokhadaim IF, Al Busadah KA, Eljarah A. Hsp90, Hsp60 and HSF-1 genes expression in muscle, heart and brain of thermally manipulated broiler chicken. Res Vet Sci. 2015;99:105–111. doi: 10.1016/j.rvsc.2014.12.014. [DOI] [PubMed] [Google Scholar]
- Akerfelt M, Morimoto RI, Sistonen L. Heat shock factors: integrators of cell stress, development and lifespan. Nat Rev Mol Cell Biol. 2010;11:545–555. doi: 10.1038/nrm2938. [DOI] [PMC free article] [PubMed] [Google Scholar]
- Bond U, Schlesinger MJ. Ubiquitin is a heat shock protein in chicken embryo fibroblasts. Mol Cell Biol. 1985;5:949–956. doi: 10.1128/MCB.5.5.949. [DOI] [PMC free article] [PubMed] [Google Scholar]
- Daxinger L, Whitelaw E. Transgenerational epigenetic inheritance: more questions than answers. Genome Res. 2010;20:1623–1628. doi: 10.1101/gr.106138.110. [DOI] [PMC free article] [PubMed] [Google Scholar]
- Deaton AM, Bird A. CpG islands and the regulation of transcription. Genes Dev. 2011;25:1010–1022. doi: 10.1101/gad.2037511. [DOI] [PMC free article] [PubMed] [Google Scholar]
- Decuypere E, Kühn ER. Thyroid hormone physiology in galliformes: age and strain related changes in physiological control. Am Zool. 1988;28:401–415. doi: 10.1093/icb/28.2.401. [DOI] [Google Scholar]
- Dorner G. Environment-dependent brain differentiation and fundamental processes of life. Acta Biologica et Medica Germanica. 1974;33(2):129. [PubMed] [Google Scholar]
- Durand TC, Sergeant K, Renaut J, Planchon S, Hoffmann L, Carpin S, Label P, Morabito D, Hausman JF. Poplar under drought: comparison of leaf and cambial proteomic responses. J Proteome. 2011;74:1396–1410. doi: 10.1016/j.jprot.2011.03.013. [DOI] [PubMed] [Google Scholar]
- Fassett JT, Xu X, Kwak D, Wang H, Liu X, Hu X, Bache RJ, Chen Y. Microtubule actin cross-linking factor 1 regulates cardiomyocyte microtubule distribution and adaptation to hemodynamic overload. PLoS One. 2013;8:e73887. doi: 10.1371/journal.pone.0073887. [DOI] [PMC free article] [PubMed] [Google Scholar]
- Gan J, Zhang D, He D, Zhang X, Chen Z, Luo Q. Promoter methylation negatively correlated with mRNA expression but not tissue differential expression after heat stress. Genet Mol Res. 2013;12:809–819. doi: 10.4238/2013.March.15.1. [DOI] [PubMed] [Google Scholar]
- Gardiner-Garden M, Frommer M. CpG islands in vertebrate genomes. J Mol Biol. 1987;196:261–282. doi: 10.1016/0022-2836(87)90689-9. [DOI] [PubMed] [Google Scholar]
- Guo G, Ge P, Ma C, Li X, Lv D, Wang S, Ma W, Yan Y. Comparative proteomic analysis of salt response proteins in seedling roots of two wheat varieties. J Proteome. 2012;75:1867–1885. doi: 10.1016/j.jprot.2011.12.032. [DOI] [PubMed] [Google Scholar]
- Hagiwara S, Iwasaka H, Matsumoto S, Noguchi T, Yoshioka H. Association between heat stress protein 70 induction and decreased pulmonary fibrosis in an animal model of acute lung injury. Lung. 2007;185:287–293. doi: 10.1007/s00408-007-9018-x. [DOI] [PubMed] [Google Scholar]
- Halle I, Tzschentke B. Influence of temperature manipulation during the last 4 days of incubation on hatching results, post-hatching performance and adaptability to warm growing conditions in broiler chickens. J Poult Sci. 2011;48:97–105. doi: 10.2141/jpsa.010056. [DOI] [Google Scholar]
- Jablonka E, Raz G. Transgenerational epigenetic inheritance: prevalence, mechanisms, and implications for the study of heredity and evolution. Q Rev Biol. 2009;84:131–176. doi: 10.1086/598822. [DOI] [PubMed] [Google Scholar]
- Janke O, Tzschentke B. Long-lasting effect of changes in incubation temperature on heat stress induced neuronal hypothalamic c-Fos expression in chickens. Open Ornithol. 2010;3:150–155. doi: 10.2174/1874453201003010150. [DOI] [Google Scholar]
- Ji H, Wang J, Guo J, Li Y, Lian S, Guo W, Yang H, Kong F, Zhen L, Guo L. Progress in the biological function of alpha-enolase. Anim Nutr. 2016;2:12–17. doi: 10.1016/j.aninu.2016.02.005. [DOI] [PMC free article] [PubMed] [Google Scholar]
- Jost J, Saluz H (1993) Steroid hormone dependent changes in DNA methylation and its significance for the activation or silencing of specific genes. DNA Methylation: Springer P425–451 [DOI] [PubMed]
- Kamwanja L, Chase C, Gutierrez J, Guerriero V, Olson T, Hammond A, Hansen P. Responses of bovine lymphocytes to heat shock as modified by breed and antioxidant status. J Anim Sci. 1994;72:438–444. doi: 10.2527/1994.722438x. [DOI] [PubMed] [Google Scholar]
- Kang G, Li G, Xu W, Peng X, Han Q, Zhu Y, Guo T. Proteomics reveals the effects of salicylic acid on growth and tolerance to subsequent drought stress in wheat. J Proteome Res1. 2012;1:6066–6079. doi: 10.1021/pr300728y. [DOI] [PubMed] [Google Scholar]
- Kuroda A, Rauch TA, Todorov I, Ku HT, Al-Abdullah IH, Kandeel F, Mullen Y, Pfeifer GP, Ferreri K. Insulin gene expression is regulated by DNA methylation. PLoS One. 2009;4:e6953. doi: 10.1371/journal.pone.0006953. [DOI] [PMC free article] [PubMed] [Google Scholar]
- Lacetera N, Bernabucci U, Scalia D, Basiricò L, Morera P, Nardone A. Heat stress elicits different responses in peripheral blood mononuclear cells from Brown Swiss and Holstein cows. J Dairy Sci. 2006;89:4606–4612. doi: 10.3168/jds.S0022-0302(06)72510-3. [DOI] [PubMed] [Google Scholar]
- Laemmli UK. Cleavage of structural proteins during the assembly of the head of bacteriophage T4. Nature. 1970;227:680–685. doi: 10.1038/227680a0. [DOI] [PubMed] [Google Scholar]
- Landry J, Huot J. Modulation of actin dynamics during stress and physiological stimulation by a signaling pathway involving p38 MAP kinase and heat-shock protein 27. Biochem Cell Biol. 1995;73:703–707. doi: 10.1139/o95-078. [DOI] [PubMed] [Google Scholar]
- Li Q, Li N, Hu X, Li J, Du Z, Chen L, Yin G, Duan J, Zhang H, Zhao Y. Genome-wide mapping of DNA methylation in chicken. PLoS One. 2011;6:e19428. doi: 10.1371/journal.pone.0019428. [DOI] [PMC free article] [PubMed] [Google Scholar]
- Li Q, Wang Y, Hu X, Zhao Y, Li N (2015) Genome-wide mapping reveals conservation of promoter DNA methylation following chicken domestication. Sci Rep 5 [DOI] [PMC free article] [PubMed]
- Lindquist S. The heat-shock response. Annu Rev Biochem. 1986;55:1151–1191. doi: 10.1146/annurev.bi.55.070186.005443. [DOI] [PubMed] [Google Scholar]
- Lindquist S, Craig EA. The heat-shock proteins. Annu Rev Genet. 1988;22:631–677. doi: 10.1146/annurev.ge.22.120188.003215. [DOI] [PubMed] [Google Scholar]
- Liu L, He J, Xie H, Yang Y, Li J, Zou Y. Resveratrol induces antioxidant and heat shock protein mRNA expression in response to heat stress in black-boned chickens. Poult Sci. 2014;93:54–62. doi: 10.3382/ps.2013-03423. [DOI] [PubMed] [Google Scholar]
- Loh B, Maier I, Winar A, Janke O, Tzschentke B. Prenatal development of epigenetic adaptation processes in poultry: changes in metabolic and neuronal thermoregulatory mechanisms. Avian Poult Biol Rev. 2004;15:119–128. doi: 10.3184/147020604783637976. [DOI] [Google Scholar]
- Loyau T, Métayer-Coustard S, Berri C, Crochet S, Cailleau-Audouin E, Sannier M, Chartrin P, Praud C, Hennequet-Antier C, Rideau N. Thermal manipulation during embryogenesis has long-term effects on muscle and liver metabolism in fast-growing chickens. PLoS One. 2014;9:e105339. doi: 10.1371/journal.pone.0105339. [DOI] [PMC free article] [PubMed] [Google Scholar]
- Loyau T, Berri C, Bedrani L, Métayer-Coustard S, Praud C, Duclos MJ, Tesseraud S, Rideau N, Everaert N, Yahav S, Mignon-Grasteau S, Collin A. Thermal manipulation of embryo modifies the physiology and body composition of broiler chickens reared in floor pen without affecting breast meat processing quality. J Anim Sci. 2013;91:3674–3685. doi: 10.2527/jas.2013-6445. [DOI] [PubMed] [Google Scholar]
- Macleod D, Charlton J, Mullins J, Bird AP. Sp1 sites in the mouse aprt gene promoter are required to prevent methylation of the CpG island. Genes Dev. 1994;8:2282–2292. doi: 10.1101/gad.8.19.2282. [DOI] [PubMed] [Google Scholar]
- Mashaly M, Hendricks G, Kalama M, Gehad A, Abbas A, Patterson P. Effect of heat stress on production parameters and immune responses of commercial laying hens. Poult Sci. 2004;83:889–894. doi: 10.1093/ps/83.6.889. [DOI] [PubMed] [Google Scholar]
- Mazzi C, Ferro M, Coelho A, Savino V, Macari M, Ferro J, Givisiez P, Giachetto P, Silva M, Dionello N. Effect of heat exposure on the thermoregulatory responses of selected naked neck chickens. Arq Bras Med Vet Zootec. 2002;54:35–41. doi: 10.1590/S0102-09352002000100006. [DOI] [Google Scholar]
- McCracken V, Xie G, Deaver S, Baumgard L, Rhoads R, Rhoads M. Short communication: hepatic progesterone-metabolizing enzymes cytochrome P450 2C and 3A in lactating cows during thermoneutral and heat stress conditions. J Dairy Sci. 2015;98:3152–3157. doi: 10.3168/jds.2014-8826. [DOI] [PubMed] [Google Scholar]
- McNabb FA, King DB (1993) Thyroid hormone effects on growth, development, and metabolism. The Endocrinology of Growth, Development, and Metabolism of Vertebrates:393–417
- Melesse A, Maak S, Schmidt R, Von Lengerken G. Effect of long-term heat stress on key enzyme activities and T3 levels in commercial layer hens. Int J Livest Prod. 2011;2:107–116. [Google Scholar]
- Mitchell M, Carlisle A. The effects of chronic exposure to elevated environmental temperature on intestinal morphology and nutrient absorption in the domestic fowl (Gallus domesticus) Comp Biochem Physiol A Comp Physiol. 1992;101:137–142. doi: 10.1016/0300-9629(92)90641-3. [DOI] [PubMed] [Google Scholar]
- Morita NDS, Almeida VRD, Junior JBM, Vicentini TI, Brand HVD, Bolei IC. Incubation temperature during fetal developmental influences morphophysiological characteristics and preferred ambient temperature of chicken hatchling. PLoS One. 2016;11:e0154928. doi: 10.1371/journal.pone.0154928. [DOI] [PMC free article] [PubMed] [Google Scholar]
- Narinc D, Erdogan S, Tahtabicen E, Aksoy T. Effect of thermal manipulations during embryogenesis of broiler chicken on developmental stability, hatchability and chicks quality. Animal. 2016;10:1328–1335. doi: 10.1017/S1751731116000276. [DOI] [PubMed] [Google Scholar]
- Parsell DA, Lindquist S. Heat shock proteins and stress tolerance. Cold Spring Harbor Monograph Archive. 1994;26:457–494. [Google Scholar]
- Pasti C, Gallois-Montbrun S, Munier-Lehmann H, Veron M, Gilles AM, Deville-Bonne D. Reaction of human UMP-CMP kinase with natural and analog substrates. FEBS J. 2003;270:1784–1790. doi: 10.1046/j.1432-1033.2003.03537.x. [DOI] [PubMed] [Google Scholar]
- Piestun Y, Shinder D, Ruzal M, Halevy O, Brake J, Yahav S. Thermal manipulations during broiler embryogenesis: effect on the acquisition of thermotolerance. Poult Sci. 2008;87:1516–1525. doi: 10.3382/ps.2008-00030. [DOI] [PubMed] [Google Scholar]
- Piestun Y, Halevy O, Shinder D, Ruzal M, Druyan S, Yahav S. Thermal manipulations during broiler embryogenesis improves post-hatch performance under hot conditions. J Therm Bio. 2011;36:469–474. doi: 10.1016/j.jtherbio.2011.08.003. [DOI] [Google Scholar]
- Quinteiro-Filho W, Ribeiro A, Ferraz-de-Paula V, Pinheiro M, Sakain M, Sa L, Ferreira A, Palermo-Neto J. Heat stress impairs performance parameters, induces intestinal injury, and decreases macrophage activity in broiler chickens. Poult Sci. 2010;89:1905–1914. doi: 10.3382/ps.2010-00812. [DOI] [PubMed] [Google Scholar]
- Rajkumar U, Reddy M, Rao S, Radhika K, Shanmugam M. Evaluation of growth, carcass, immune response and stress parameters in naked neck chicken and their normal siblings under tropical winter and summer temperatures. Asian-Australas J Anim Sci. 2011;24:509–516. doi: 10.5713/ajas.2011.10312. [DOI] [Google Scholar]
- Rajkumar U, Shanmugam M, Rajaravindra K, Vinoth A, Rao SR. (2015a) Effect of increased incubation temperature on juvenile growth, immune and serum biochemical parameters in selected chicken populations. Ind J Ani Sci 85
- Rajkumar U, Vinoth A, Shanmugam M, Rajaravindra K, Rama Rao S. Effect of embryonic thermal exposure on heat shock proteins (HSPs) gene expression and serum T3 concentration in two broiler populations. Anim Biotechnol. 2015;26:260–267. doi: 10.1080/10495398.2015.1022183. [DOI] [PubMed] [Google Scholar]
- Rajkumar U, Vinoth A, Shanmugam M, Rajaravindra K, Rama Rao S (2016) Effect of increased incubation temperature on Hsp 90 and 60 gene expressions in coloured broiler chickens. J Appl Anim Res 1–6. 10.1080/09712119.2016.1174128
- Rocamora N, Agell N. Methylation of chick UbI and UbII polyubiquitin genes and their differential expression during spermatogenesis. Biochem J. 1990;267:821–829. doi: 10.1042/bj2670821. [DOI] [PMC free article] [PubMed] [Google Scholar]
- Rompay ARV, Johansson M, Karlsson A. Phosphorylation of deoxycytidine analog monophosphates by UMP-CMP kinase: molecular characterization of the human enzyme. Mol Pharmacol. 1999;56:562–569. doi: 10.1124/mol.56.3.562. [DOI] [PubMed] [Google Scholar]
- Renden J, Lien R, Oates S, Bilgili S. Plasma concentrations of corticosterone and thyroid hormones in broilers provided various lighting schedules. Poult Sci. 1994;73:186–193. doi: 10.3382/ps.0730186. [DOI] [PubMed] [Google Scholar]
- Rozenboim I, Tako E, Gal-Garber O, Proudman J, Uni Z (2007) The effect of heat stress on ovarian function of laying hens. Poult Sci 86:1760–1765. 10.1093/ps/86.8.1760 [DOI] [PubMed]
- Sambrook J, Russell DW. Molecular cloning: a laboratory manual. 3. UK: Cold Spring Harbour Laboratory Press; 2001. [Google Scholar]
- Schagat T, Paguio A, Kopish K. Normalizing genetic reporter assays: approaches and considerations for increasing consistency and statistical significance. Cell Notes. 2007;17:9–12. [Google Scholar]
- Staib JL, Quindry JC, French JP, Criswell DS, Powers SK. Increased temperature, not cardiac load, activates heat shock transcription factor 1 and heat shock protein 72 expression in the heart. Am J Physiol Regul Integr Comp physiol. 2007;292:R432–R439. doi: 10.1152/ajpregu.00895.2005. [DOI] [PubMed] [Google Scholar]
- Su J, Wang Y, Xing X, Liu J, Zhang Y. Genome-wide analysis of DNA methylation in bovine placenta. BMC Genomics. 2014;15:1. doi: 10.1186/1471-2164-15-12. [DOI] [PMC free article] [PubMed] [Google Scholar]
- Tomanek L, Zuzow MJ. The proteomic response of the mussel congeners Mytilus galloprovincialis and M. trossulus to acute heat stress: implications for thermal tolerance limits and metabolic costs of thermal stress. J Exp Biol. 2010;213:3559–3574. doi: 10.1242/jeb.041228. [DOI] [PubMed] [Google Scholar]
- Turk R, Piras C, Kovacic M, Samardzija M, Ahmed H, De Canio M, Urbani A, Mestric ZF, Soggiu A, Bonizzi L. Proteomics of inflammatory and oxidative stress response in cows with subclinical and clinical mastitis. J Proteome. 2012;75:4412–4428. doi: 10.1016/j.jprot.2012.05.021. [DOI] [PubMed] [Google Scholar]
- Tzschentke B, Plagemann A. Imprinting and critical periods in early development. World Poult Sci J. 2006;62:626–637. doi: 10.1079/WPS2006117. [DOI] [Google Scholar]
- Tzschentke B. Attainment of thermoregulation as affected by environmental factors. Poult Sci. 2007;86:1025–1036. doi: 10.1093/ps/86.5.1025. [DOI] [PubMed] [Google Scholar]
- Vinoth A, Thirunalasundari T, Tharian JA, Shanmugam M, Rajkumar U. Effect of thermal manipulation during embryogenesis on liver heat shock protein expression in chronic heat stressed colored broilers chicken. J Therm Biol. 2015;53:162–171. doi: 10.1016/j.jtherbio.2015.10.010. [DOI] [PubMed] [Google Scholar]
- Wang S, Edens F. Heat conditioning induces heat shock proteins in broiler chickens and turkey poults. Poult Sci. 1998;77:1636–1645. doi: 10.1093/ps/77.11.1636. [DOI] [PubMed] [Google Scholar]
- Wang C, Yuan C, Wang S, Zhang H, Hu X, Zhang L, Wu C, Li N. Differential gene expression of aldolase C (ALDOC) and hypoxic adaptation in chickens. Anim Genet. 2007;38:203–210. doi: 10.1111/j.1365-2052.2007.01605.x. [DOI] [PubMed] [Google Scholar]
- Werner C, Wecke C, Liebert F, Wicke M. Increasing the incubation temperature between embryonic day 7 and 10 has no influence on the growth and slaughter characteristics as well as meat quality of broilers. Animal. 2010;4:810–816. doi: 10.1017/S1751731109991698. [DOI] [PubMed] [Google Scholar]
- Williamson R, Misson B, Davison T. The effect of exposure to 40 on the heat production and the serum concentrations of triiodothyronine, thyroxine, and corticosterone in immature domestic fowl. Gen Comp Endocrinol. 1985;60:178–186. doi: 10.1016/0016-6480(85)90312-0. [DOI] [PubMed] [Google Scholar]
- Wiseman H, Halliwell B. Damage to DNA by reactive oxygen and nitrogen species: role in inflammatory disease and progression to cancer. Biochem J. 1996;313:17. doi: 10.1042/bj3130017. [DOI] [PMC free article] [PubMed] [Google Scholar]
- Wu X, Kodama A, Fuchs E. ACF7 regulates cytoskeletal-focal adhesion dynamics and migration and has ATPase activity. Cell. 2008;135:137–148. doi: 10.1016/j.cell.2008.07.045. [DOI] [PMC free article] [PubMed] [Google Scholar]
- Xu Q, Zhang Y, Sun D, Wang Y, Yu Y. Analysis on DNA methylation of various tissues in chicken. Anim Biotechnol. 2007;18:231–241. doi: 10.1080/10495390701574838. [DOI] [PubMed] [Google Scholar]
- Yahav S, Collin A, Shinder D, Picard M. Thermal manipulations during broiler chick embryogenesis: effects of timing and temperature. Poult Sci. 2004;83(12):1959–1963. doi: 10.1093/ps/83.12.1959. [DOI] [PubMed] [Google Scholar]
- Yahav S. Alleviating heat stress in domestic fowl: different strategies. World's Poult Sci J. 2009;65:719–732. doi: 10.1017/S004393390900049X. [DOI] [Google Scholar]
- Yahav S, Straschnow A, Plavnik I, Hurwitz S. Blood system response of chickens to changes in environmental temperature. Poult Sci. 1997;76:627–633. doi: 10.1093/ps/76.4.627. [DOI] [PubMed] [Google Scholar]
- Yan SP, Zhang QY, Tang ZC, Su WA, Sun WN. Comparative proteomic analysis provides new insights into chilling stress responses in rice. Mol Cell Proteomics. 2006;5:484–496. doi: 10.1074/mcp.M500251-MCP200. [DOI] [PubMed] [Google Scholar]
- Yang C, Zhang M, Niu W, Yang R, Zhang Y, Qiu Z, Sun B, Zhao Z. Analysis of DNA methylation in various swine tissues. PLoS One. 2011;6:e16229. doi: 10.1371/journal.pone.0016229. [DOI] [PMC free article] [PubMed] [Google Scholar]
- Yossifoff M, Kisliouk T, Meiri N. Dynamic changes in DNA methylation during thermal control establishment affect CREB binding to the brain-derived neurotrophic factor promoter. Eur J Neurosci. 2008;28:2267–2277. doi: 10.1111/j.1460-9568.2008.06532.x. [DOI] [PubMed] [Google Scholar]
- Young RA, Elliott TJ. Stress proteins, infection, and immune surveillance. Cell. 1989;59:5–8. doi: 10.1016/0092-8674(89)90861-1. [DOI] [PubMed] [Google Scholar]
- Zemach A, McDaniel IE, Silva P, Zilberman D. Genome-wide evolutionary analysis of eukaryotic DNA methylation. Science. 2010;328:916–919. doi: 10.1126/science.1186366. [DOI] [PubMed] [Google Scholar]
- Zeng T, Jiang X, Li J, Wang D, Li G, Lu L, Wang G. Comparative proteomic analysis of the hepatic response to heat stress in Muscovy and Pekin ducks: insight into thermal tolerance related to energy metabolism. PLoS ONE. 2013;8:e76917. doi: 10.1371/journal.pone.0076917. [DOI] [PMC free article] [PubMed] [Google Scholar]
- Zulkifli I, Al-Aqil A, Omar AR, Sazili AQ, Rajion MA. Crating and heat stress influence blood parameters and heat shock protein 70 expression in broiler chickens showing short or long tonic immobility reactions. Poult Sci. 2009;88:471–476. doi: 10.3382/ps.2008-00287. [DOI] [PubMed] [Google Scholar]
Associated Data
This section collects any data citations, data availability statements, or supplementary materials included in this article.
Supplementary Materials
(PDF 58 kb).
(PDF 63 kb).
(PDF 50 kb).
(PDF 53 kb).


