

Abstract
A comprehensive search in literature and published US Food and Drug Administration reviews was conducted to assess whether physiologically based pharmacokinetic (PBPK) modeling could be prospectively used to predict clinical food effect on oral drug absorption. Among the 48 resulted food effect predictions, ∼50% were predicted within 1.25‐fold of observed, and 75% within 2‐fold. Dissolution rate and precipitation time were commonly optimized parameters when PBPK modeling was not able to capture the food effect. The current work presents a knowledgebase for documenting PBPK experience to predict food effect.
IMPACT OF FOOD ON ORAL DRUG ABSORPTION
It is well known that food may induce changes in human physiology, leading to potential impact on drug pharmacokinetics (PK), especially drug absorption. The effects of food include, but are not limited to, delay in gastric emptying, alternation in gastrointestinal (GI) pH, stimulation of bile flow, increase in splanchnic and hepatic blood flow, changes in hepatic/GI metabolism of drug substance, and physical and/or chemical interaction with the formulation or drugs released from the formulation.1, 2 Furthermore, different food types may vary in nutrition composition (protein, carbohydrate‐rich, or high‐fat meal), calorie content (low vs. high calorie meals), volume, temperature, and fluid ingestion,3 producing different food effects on the drug product transit time, luminal dissolution, drug permeability, and systemic availability.
CURRENT REGULATORY REQUIREMENTS
Assessment of the food effect on the rate and extent of absorption is part of the development of an orally administered drug product. According to “Food‐Effect Bioavailability and Bioequivalence Studies” from the US Food and Drug Administration (FDA), a food effect bioavailability study should be conducted for all new chemical entities during the investigational new drug application period. For abbreviated new drug applications of immediate‐release drug products, when the active pharmaceutical ingredient (API) is Biopharmaceutical Classification System (BCS) class I,1 a bioequivalence study under fed state may be waived.1 For abbreviated new drug applications of modified‐release products, a fed bioequivalence study is recommended for all BCS classes.4 The food effect is concluded if the 90% confidence interval for the ratio of the population geometric means between fed and fasted treatments, based on log‐transformed data, fails to meet the limits of 80–125% for either area under the concentration‐time profile (AUC) or maximal concentration (Cmax).1
METHODS TO PREDICT FOOD EFFECT
Several in vitro/in vivo/in silico approaches have been applied in predicting human food effect at the early stage of drug development. Fleisher et al.5 suggested that the food effect on the extent of bioavailability (Fextent) of an immediate‐release drug product could be generally predicted based on the BCS class of the drug, and Wu and Benet6 added the time‐to‐peak exposure (tmax) designations. In addition, several groups7, 8, 9 have conducted in vitro dissolution studies in biorelevant media to predict PK profiles for lipophilic compounds under fed condition, which allows the comparison of various formulations prior to conducting clinical studies. In addition, in vivo food effect studies in animals, especially in dogs, are commonly conducted prior to clinical studies to anticipate the potential food effect in humans. However, predictions using these methods usually do not provide sufficient confidence in supporting the decision on replacing a food effect clinical study. Each of the methods has disadvantages that limit their applications in human food effect predictions: the BCS method is unable to quantitatively predict the magnitude of change in drug exposure metrics; in vitro dissolution studies seem to qualitatively predict the food effect only for poor solubility drugs (ignoring the impact of food on all other aspects); in vivo dog studies may not accurately predict food effect in humans due to the critical anatomic and physiological species differences, such as epithelial junction, fluid pH, colon anatomy, drug transporters, and drug metabolizing enzymes.
In recent years, physiologically based pharmacokinetic (PBPK) modeling has been widely used to evaluate oral drug absorption,10, 11 including food effect. During an American Association of Pharmaceutical Scientist (AAPS) workshop held in 2015 entitled “Evaluating and Modernizing Our Approaches for Food‐Effect Assessment,” PBPK modeling was regarded as a useful tool to predict food effect. Compared to aforementioned prediction methods, PBPK has several advantages. It can be used to simulate dynamic PK profiles under fasted and fed stages and to investigate variability, as the models can be conditioned by the demographics (age, sex, race, genetics, etc), disease status of the patients, and by the intake of food. PBPK modeling has the potential to integrate the changes induced by food on formulation, API, and human physiology. However, knowledge gaps on the three aspects may prevent the effective use of PBPK to predict food effect. To our knowledge, predictive performance of PBPK for this intended purpose has not been examined.12
OUR ANALYSIS TO ASSESS PREDICTIVE PERFORMANCE OF PBPK ON FOOD EFFECT PREDICTIONS
As a step towards establishing the predictive performance of PBPK for predicting the food effect in humans, we built a knowledgebase specific for documenting food effect predictions using PBPK, including peer‐reviewed publications and new drug approval (NDA) reviews by the FDA. The underlying research question is whether PBPK modeling can be prospectively used to predict the clinical food effect.
DATA COLLECTION AND PREDICTIVE PERFORMANCE ASSESSMENT
Data collection
Published peer‐reviewed journal articles that used PBPK models to evaluate food effect on a drug's PK were searched in PubMed/Medline, using “food effect” and “PBPK” as search terms, with a cutoff publication date of April 30, 2016. The FDA NDA reviews were searched within the internal PBPK submission database, with the same cutoff date. Because there is no systematic approach to account for food effect on GI/hepatic enzymes and transporters, the food effect on presystemic metabolic enzymes and transporters are out of the scope of this analysis, and one article13 that assessed grape fruit juice's effect on nifedipine was excluded. In this analysis, positive food effect, absence of food effect, and negative food effect were defined if observed AUC or Cmax ratio (AUCR or CmaxR, with/without food) was >1.25, 0.8 ≤ ratio (AUCR or CmaxR) ≤1.25, and <0.8, respectively.
Predictive performance of PBPK to predict food effect
Predictive performance of PBPK to predict food effect was evaluated among cases in which PBPK models were used to prospectively predict food effect (e.g., absorption parameters (see Figure 1) in the PBPK model under fed conditions were not optimized to match the observed food effect). For these cases, model‐predicted AUCR or CmaxR was compared with observed AUCR or CmaxR to assess predictive performance. Stringent criterion of deviation (%) of predicted AUCR or CmaxR within 25% (1.25‐fold) of observed value and a wider boundary of 100% (2‐fold) were applied. The deviation (%) of predicted AUCR and CmaxR from observed values was calculated by Eqs. (1) and (2):
| (1) |
| (2) |
Figure 1.
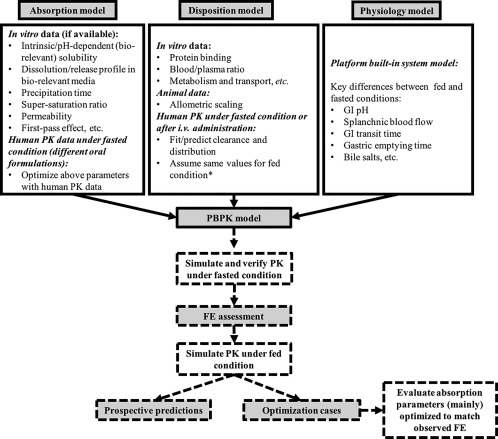
A general workflow to use physiologically based pharmacokinetic (PBPK) model to predict food effect (FE) based on cases analyzed. *Vd was individually fitted to clinical pharmacokinetic (PK) data under fasted and fed states in Shono et al.14 (2009) and Shono et al.15 (2010). CL was separately fitted to clinical PK data under fasted and fed states in Shono et al.14 (2009). GI, gastrointestinal.
When available, tmax change (tmaxR) was also compared between predicted and observed data.
Evaluation of parameters optimized according to observed food effect
For cases in which one or more absorption parameters (mainly) in the PBPK model under fed conditions were optimized to match the observed food effect (see Figure 1), optimized parameters were summarized.
SUMMARY OF LITERATURE/NDA REVIEW RESULTS
Workflow for predicting food effect using PBPK models
A general workflow to use the PBPK model to predict food effect is illustrated in Figure 1. A drug's PBPK model is composed of three pillars: absorption model, disposition model, and physiology model. The absorption model is developed using in vitro experimental data (solubility, permeability, etc), and different values may be used under fasted and fed conditions. Additionally, formulation and/or dosing regimen difference may result in different input parameter values in the absorption model. In many cases, absorption parameters may be optimized using PK under fasted condition to verify base models. The disposition model was developed using parameters from in vitro or in vivo experiments. In some studies, volume of distribution (Vd) and clearance (CL) were fitted/optimized with observed clinical PK data under fasted conditions or i.v. administration, and the same values were assumed for fed conditions. The Vd or CL in other studies were predicted by allometric scaling or physicochemical properties of the drugs, whereas the same Vd or CL was still assumed under both fasted and fed states. Shono et al.14 (2009) and Shono et al.15 (2010)15 individually fit Vd or CL to clinical PK data with/without food, thus different disposition model parameters were used in these two papers. For all cases, PBPK models under fasted state were verified by observed PK data (see Supplementary Table S1), by (a) optimizing parameters using observed PK profiles (oral fasted PK or i.v. PK), (b) AUC prediction bias within two‐fold, and (c) comparable observed and simulated PK profiles under fasted condition. The verified PBPK models with input parameters relevant to fed conditions were used to simulate PK profiles under fed conditions. At this stage, if input absorption parameters under fed conditions were further optimized to match the observed food effect, the cases were categorized as optimization cases; otherwise the cases were categorized as prospective predictions. For all prospective predictions, the predicted food effects were calculated as AUCR, CmaxR, and tmaxR between fed and fasted conditions.
Summary of basic information of the final knowledgebase
The final knowledgebase included 15 documents (13 peer‐reviewed publications14, 15, 16, 17, 18, 19, 20, 21, 22, 23, 24, 25, 26 and 2 FDA reviews27, 28), consisting of 27 compounds, 36 PBPK models, and 48 food effect simulation cases. Of the 27 drugs, there were 22 bases, 2 acids, 2 ampholytes, and 1 neutral. Some compounds have more than one formulation, thus more than one PBPK model were developed for a specific compound; some PBPK models were used to predict the food effect at various doses. Of the 48 cases, the fraction absorbed under fasted state (Fa (%)) was reported in 25 cases, within which Fa values were ≥50% in 11 cases. Thirty‐nine of 48 (81%) food effect cases were prospective predictions and the rest (9 of 48; 19%) were optimized cases. Relevant information (API, drug product, food, PBPK modeling, predictive performance, model optimization, and publication) of the 15 documents is summarized in Supplementary Table S1. Of note, these tables follow similar knowledgebase structure and can be expanded.
Publication years of the 15 documents ranged from 2006–2016. Among the 27 compounds (Figure 2), 7% (2/27) were BCS class I drugs; 37% (10/27) were BCS class II drugs; 7% (2/27) were BCS class III drugs; 19% (5/27) were BCS class IV drugs; 7% (2/27) were BCS class II/IV borderline drugs; and 22% (6/27) were drugs with BCS class information unknown. With regard to platforms (Figure 3), 40% (6/15) used Gastroplus (with its advanced compartmental absorption and transit (ACAT) model), 33% (5/15) used STELLA (with a self‐developed absorption model), and 27% (4/15) used Simcyp (with its advanced dissolution, absorption, metabolism (ADAM) model). A comparison of physiological parameters used in the three platforms is summarized in Supplementary Table S2.
Figure 2.
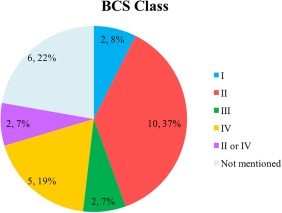
Pie chart of Biopharmaceutics Classification System (BCS) class distribution for 27 compounds (n, % total).
Figure 3.
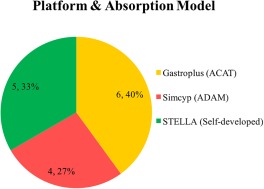
Pie chart of physiologically based pharmacokinetic (PBPK) model platforms (absorption models) used in the 15 documents (n, % total). ACAT, Advanced Compartmental Absorption and Transit; ADAM, advanced dissolution, absorption, and metabolism.
Summary of predictive performance
Predictive performance of PBPK models to characterize food effect (AUCR, CmaxR, tmaxR, and ratio with/without food) is summarized in Figure 4. For 39 prospective AUCR predictions, the observed positive food effect, absence of food effect, and negative food effect accounted for 74% (29/39), 23% (9/39), and 3% (1/39) cases, respectively. Figure 4 a shows that 90% (35/39) of the predicted food effects (AUCRs) were within 2‐fold of the observed AUCR, whereas 59% (23/39) predicted AUCRs were within 1.25‐fold of the observed. Comparison of predictive performance among BCS classes was not feasible because of the limited number of drugs in each class. For example, only one drug each was categorized as BCS class I and III, both of which predicted AUCR within 1.25‐fold of observed; food effect predictions for 69% (9/13) and 63% (5/8) of BCS class II and IV drugs, respectively, were predicted within 1.25‐fold of observed. The PBPK models seemed to predict negative or insignificant (observed AUCR <1.25; n = 10) food effect reasonably well, with 90% (9/10) predictions within 1.25‐fold of observed. The CmaxR comparison showed a similar trend. The PBPK models prospectively predicted 90% (35/39) CmaxR within 2‐fold of the observed CmaxR, and predicted 49% (19/39) CmaxR within 1.25‐fold of the observed (Figure 4 b). For CmaxR <1.25 (negative or insignificant food effect; n =12), 67% (8/12) CmaxR predictions were within 1.25‐fold of the observed. Only 14 tmaxRs were available, and 79% (11/14) and 50% (7/14) tmaxR predictions were within 2‐fold and 1.25‐fold of observed tmaxRs, respectively.
Figure 4.
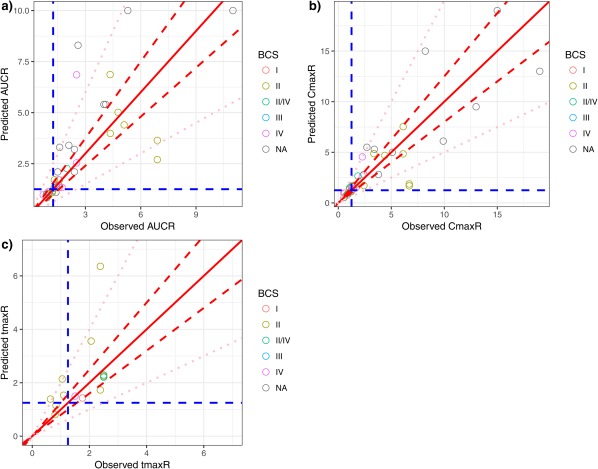
Predictive performance assessment of physiologically based pharmacokinetic (PBPK) models that had prospective predictions. (a) Predicted area under the concentration‐time ratio (AUCR) vs. observed AUCR. (b) Predicted peak plasma concentration ratio (CmaxR) vs. the observed CmaxR. (c) Predicted time of maximum plasma concentration ratio (tmaxR) vs. the observed tmaxR. The red solid lines in all plots are lines of identity (y = x). Red dashed lines in all plots represent y = 0.8x and y = 1.25x. Blue dashed in all plots represent y = 1.25 and x = 1.25. Pink dotted lines in all plots represent y = 0.5x and y = 2x. BCS, Biopharmaceutics Classification System. NA, Not Available.
Summary of optimized parameters to match observed food effect
For 9 PBPK cases, input absorption and disposition parameters were optimized to match the observed food effect. The optimized parameters are summarized in Figure 5. Dissolution rate and precipitation time, the most commonly optimized parameters when PBPK models cannot capture the food effect, were adjusted in 33% (3/9) of the cases each, respectively. The pH‐dependent (biorelevant) solubility, disposition parameters (Vd and CL), in vitro release rate, and apparent permeability were also adjusted in 22% (2/9), 22% (2/9), 11% (1/9), and 11% (1/9) of the cases, respectively. Overall, parameters that govern the dissolution profiles of drug in biorelevant media were optimized in most cases.
Figure 5.
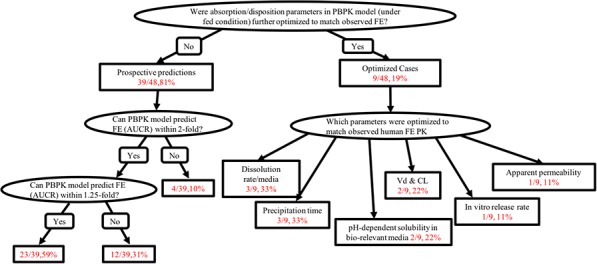
Summary of predictive performance (prospective predictions, left) and optimization cases (right) to match observed food effect (FE). AUCR, area under the concentration‐time ratio; PBPK, physiologically based pharmacokinetic; PK, pharmacokinetic.
Some discussion points of our analysis
The PBPK modeling has been increasingly used in drug development and regulatory reviews to address different clinical pharmacology questions. Applications of PBPK modeling include but are not limited to drug‐drug interactions, absorptions, pediatrics, organ impairment, and pharmacogenetics.12, 29 At present, confidence in using PBPK to prospectively predict the food effect is considered low.12, 30 During the 2015 AAPS workshop on food effect, Heimbach et al.18 proposed a decision tree for practical food effect predictions based on BCS and biopharmaceutics drug disposition classification system determined from in silico, in vitro, and preclinical in vivo data, and they also proposed a general flow‐chat for quantitatively predicting food effect using PBPK models.
As a first step toward establishing predictive performance of PBPK to prospectively predict food effect, we built a knowledgebase to document and analyze published PBPK experiences for this purpose. As shown in Figure 1, input parameters for both absorption and disposition models could be obtained from various sources, reflecting a lack of standardization and large variability in the quality of input data. Figure 1 intends to summarize the various sources of input parameters, and generalize the workflow for investigators to develop a PBPK model to predict food effect. All cases in our database verified the base model for oral PK data in humans under fasted condition. This is logical both from a scientific point of view (e.g., ensuring high quality PBPK model for food effect prediction) and a drug development process point of view (e.g., assessing the food effect during early clinical development when fasted PK results in humans are often available).
The PBPK models have been used to predict the food effect across various BCS classes, with the majority of models focusing on BCS class II or IV compounds. This is because BCS class I drugs generally have negligible food effect, and the food effect on BCS class III compounds may highly involve transporter interactions, which is not typically incorporated in the models listed in the knowledgebase. Given the limited number of BCS class I and III compounds in our knowledgebase, it is difficult to generalize the predictability of PBPK within each BCS class, whereas similar predictabilities of PBPK models were shown for BCS class II and class IV drugs.
The current knowledgebase included 39 cases of prospective predictions and 11 cases of optimized cases (assuming prospective predictions of these cases initially failed to describe observed food effect within 2‐fold), and, in total, the PBPK simulations were able to describe the observed food effect within a stringent 25% boundary (1.25‐fold) for ∼50% of total cases (23 of 48). When the boundary was widened to 100% (2‐fold), 75% of simulated AUCR or CmaxR described the total observed cases (36 of 48). Cautions should be exercised when determining the predictive performance of PBPK to predict the food effect due to the following reasons:
The food effect may affect intestinal enzymes and transporters. Food is shown to have inhibitory effect on intestinal metabolism and transport,31 resulting in negative or positive food effect depending on the enzymes or transporters involved. It is difficult to quantitatively measure the inhibitory effect due to the complex ingredients in different types of food and the confounding mechanisms of food effect. None of the platforms adequately captured in the knowledgebase consider the enzyme or transporter inhibition by food. Further analysis assessing the food effect on enzymes or transporters should be explored.
The mobility of food components is largely affected by the presence of fluids in the GI tract. Sutton32 suggested that the small and large intestines' water volumes that best fit for several solubility‐limited compounds were on average 130 mL and 10 mL (ranged as large as 125 mL), accounting for 10% and 1–10% of organ volumes of small and large intestines, whereas the default corresponding values in the ACAT model of Gastroplus were 40% and 10%. Pepin et al.33 also indicated that the percentage of water content in the small and large intestines for lesinurad, a weak acid, had to be adjusted to 7.5% and 2%, to best characterize the dissolution rates anticipated to occur in the intestines and colon. Sensitivity analysis results showed the volume of luminal water is limiting the absorption in the duodenum through limitation of the amount of drug dissolved but not in the jejunum, and, thus, the amount of water in the GI tract is a key factor to control the drug bioavailability.32 At this moment, manual adjustment of regional‐dependent water content may be required for individual drugs, limiting the predictive power of PBPK for food effect.
Among optimization cases, dissolution rate and precipitation time were the most commonly adjusted parameters to match the observed food effect. The “true” in vivo precipitation behavior of a drug strongly depends on the drug characteristics, formulation, and physiology, and is technically difficult to measure.26 Therefore, precipitation time under fasted and fed conditions were adjusted to best fit the in vivo human PK profiles in some literatures21, 26, 34 because no feasible in vitro method is currently available to quantitatively determine the precipitation time. Especially for highly permeable weak bases, in vitro setups to measure precipitation, such as the transfer model,35 were demonstrated to overpredict the extent of precipitation in vivo.24, 36, 37 These learning exercises via PBPK modeling call for refinement of existing methods and development of novel methods that can be used to generate parameters for effective predictions of oral drug absorption and the effect of food using PBPK. For the two studies14, 15 that adjusted Vd and CL, human PK profiles under fasted and fed states were individually fitted to obtain separate sets of disposition parameters. In most studies, the same values of Vd and CL were assumed for the fasted and fed states PK profiles, which should be generally true except for flip‐flop kinetics and enterohepatic recycling. Under the flip‐flop kinetics or enterohepatic recycling circumstances, systemic parameters will be affected by absorption processes, and food may alter the disposition parameters of a drug. Because the main focus of this work is absorption models, we could have included the two optimization cases14, 15 that adjusted Vd and CL in the analysis of predictive performance (Supplementary Figure S1). Both studies predicted the AUCR within 1.25‐fold of the observed. However, optimization of parameters that are not directly related to oral absorption indeed used PK data under fed conditions. It is also noteworthy that except for the two cases that optimized Vd and CL, all the other optimized cases had Fa (%) values ≤30% under fasted state (one case did not report Fa (%)), which implies that predicting food effect prospectively using PBPK models may be difficult for compounds with relatively low Fa (%).
To date, a number of mechanistic models for the prediction of intestinal absorption have been published and several commercial software packages are available. In our knowledgebase, GastroPlus, Simcyp, and STELLA are the software platforms used to establish the PBPK models for food effect predictions, and parameterization of food effect seems to be platform‐specific. GastroPlus does not distinguish between various meal types but takes into account timing of food, which allows flexibility in study design. Simcyp has the options of “high fat” and “low fat” meals when predicting food effect, which is mainly accounted for by varying the gastric emptying time for different types of meals, whereas the potential difference in bile salts concentration, and the flexibility to change drug‐food staggering time are not built‐in for the current Simcyp version (V16, personal communication with Dr Nikunjkumar Patel from Certara). Self‐built fit‐for‐purpose models, such as the STELLA software, provide more flexibility, whereas it highly relies on the availability of in vitro information as input data to conduct simulations. Neither GastroPlus nor Simcyp's default food effect model capture the effect of food components, such as lipids, proteins, and carbohydrates, on the gastric solubility of drugs, which, in turn, may lead to a pronounced underestimation of gastric dissolution and, therefore, absorption of poorly soluble compounds under fed condition. Nevertheless, knowledge gaps on the effect of food on formulation, API, and human physiology hinder the application of software, and a better scientific understanding of these factors is required to refine the platforms. Currently, all three software programs allow the flexibility of optimizing dissolution, release, and permeability profiles based on in vitro or in vivo experimental data.
Although ∼50% food effect predictions were within 1.25‐fold of observed, and 75% within 2‐fold of observed, the experience to draw any conclusion is still limited.12 The published literature and perhaps also the results from submissions to the FDA may be biased, because only the “good” results tend to be published or submitted, whereas the “true” picture may be lost. It is always important to consider the “publication bias” when interpreting the results, especially when the knowledgebase is still small. There is a need to expand the knowledgebase across drug products with various BCS classes, formulations, physicochemical properties, or different meal types before any solid conclusions could be drawn.
SUMMARY AND FUTURE IMPLICATIONS
In summary, PBPK models developed based on in vitro solubility, permeability, and dissolution tests, together with clinical PK profile under fasted condition described ∼50% observed food effect within a predefined boundary of 25%. Dissolution rate and precipitation time were the parameters most commonly optimized when PBPK modeling cannot capture the food effect. The large knowledge gaps in the three determinants (product, API, and physiology) hinder the ability of PBPK to prospectively predict the food effect. As new data become available, this knowledgebase may be expanded and utilized to re‐assess predictive performance of food effect. Our analyses have three main implications: (1) laying out the strategy of using PBPK to predict food effect after the model has been verified with fasted/i.v. PK data; (2) identifying key parameters commonly optimized in PBPK analysis to better describe food effect and inform the optimization of in vitro studies characterizing oral drug absorption; and (3) providing a knowledgebase that can be expanded to ultimately establish predictive performance of PBPK to predict food effect.
Conflict of Interest
The findings and conclusions in this work have not been formally disseminated by the United States Food and Drug Administration and should not be construed to represent any Agency determination or policy. The views expressed in this manuscript do not reflect those of the Bill & Melinda Gates Foundation. As an Associate Editor for CPT: Pharmacometrics & Systems Pharmacology, Ping Zhao was not involved in the review or decision process for this paper.
Supporting information
Supplementary Figure S1 Predictive performance assessment of physiologically based pharmacokinetic (PBPK) models that have prospective predictions (including Shono et al.14 (2009) and Shono et al.15 (2010)). (a) Predicted AUCR vs. observed AUCR. b) Predicted CmaxR vs. observed CmaxR. (c) Predicted tmaxR vs. observed tmaxR. Red solid lines in all plots are lines of identity (y = x). Red dashed lines in all plots represent y = 0.8x and y = 1.25x. Pink dotted lines in all plots represent y = 0.5x and y = 2x. Blue dashed lines in all plots represents y = 1.25 and x = 1.25.
Supplementary Table S1 Detailed summary of the final knowledgebase for prospective predictions and optimization cases.
Supplementary Table S2 Comparison of physiological parameters used in different platforms.
Source of Funding
Dr Li was supported in part by the appointments to the Research Participation Program at the Center for Drug Evaluation and Research, administered by the Oak Ridge Institute for Science and Education through an interagency agreement between the US Department of Energy and the FDA.
Author Contributions
M.L. drafted the manuscript. P.Z. designed the research. M.L., P.Z., Y.P., and C.W. performed the literature and submissions review. M.L. analyzed the data.
A part of this work was presented in poster form at the American Society for Clinical Pharmacology and Therapeutics 2017 Annual Meeting, Washington, DC, March 15–18, 2017.
References
- 1.U.S. Department of Health and Human Services, Food and Drug Administration, Center for Drug Evaluation and Research (CDER). Guidance for Industry ‐ Food‐Effect Bioavailability and Fed Bioequivalence Studies. <https://www.fda.gov/downloads/regulatoryinformation/guidances/ucm126833.pdf> (2002).
- 2. Rose, R.H. , Turner, D.B. , Neuhoff, S. & Jamei, M. Incorporation of the time‐varying postprandial increase in splanchnic blood flow into a PBPK model to predict the effect of food on the pharmacokinetics of orally administered high‐extraction drugs. AAPS J. 19, 1205–1217 (2017). [DOI] [PubMed] [Google Scholar]
- 3. Lentz, K.A. Current methods for predicting human food effect. AAPS J. 10, 282–288 (2008). [DOI] [PMC free article] [PubMed] [Google Scholar]
- 4.U.S. Department of Health and Human Services, Food and Drug Administration, Center for Drug Evaluation and Research (CDER). Guidance for Industry – Bioequivalence Studies with Pharmacokinetic Endpoints for Drugs Submitted Under an ANDA. <https://www.fda.gov/downloads/drugs/guidances/ucm377465.pdf> (2013).
- 5. Fleisher, D. , Li, C. , Zhou, Y. , Pao, L.H. & Karim, A. Drug, meal and formulation interactions influencing drug absorption after oral administration. Clinical implications. Clin. Pharmacokinet. 36, 233–254 (1999). [DOI] [PubMed] [Google Scholar]
- 6. Wu, C.Y. & Benet, L.Z. Predicting drug disposition via application of BCS: transport/absorption/elimination interplay and development of a biopharmaceutics drug disposition classification system. Pharm. Res. 22, 11–23 (2005). [DOI] [PubMed] [Google Scholar]
- 7. Dressman, J.B. & Reppas, C. In vitro‐in vivo correlations for lipophilic, poorly water‐soluble drugs. Eur. J. Pharm. Sci. 11Suppl2, S73–S80 (2000). [DOI] [PubMed] [Google Scholar]
- 8. Nicolaides, E. , Symillides, M. , Dressman, J.B. & Reppas, C. Biorelevant dissolution testing to predict the plasma profile of lipophilic drugs after oral administration. Pharm. Res. 18, 380–388 (2001). [DOI] [PubMed] [Google Scholar]
- 9. Nicolaides, E. , Galia, E. , Efthymiopoulos, C. , Dressman, J.B. & Reppas, C. Forecasting the in vivo performance of four low solubility drugs from their in vitro dissolution data. Pharm. Res. 16, 1876–1882 (1999). [DOI] [PubMed] [Google Scholar]
- 10. Sjögren, E. et al In vivo methods for drug absorption – comparative physiologies, model selection, correlations with in vitro methods (IVIVC), and applications for formulation/API/excipient characterization including food effects. Eur. J. Pharm. Sci. 57, 99–151 (2014). [DOI] [PubMed] [Google Scholar]
- 11. Zhang, X. , Lionberger, R.A. , Davit, B.M. & Yu, L.X. Utility of physiologically based absorption modeling in implementing quality by design in drug development. AAPS J. 13, 59–71 (2011). [DOI] [PMC free article] [PubMed] [Google Scholar]
- 12. Wagner, C. et al Application of physiologically based pharmacokinetic (PBPK) modeling to support dose selection: report of an FDA public workshop on PBPK. CPT Pharmacometrics Syst. Pharmacol. 4, 226–230 (2015). [DOI] [PMC free article] [PubMed] [Google Scholar]
- 13. Wagner, C. , Thelen, K. , Willmann, S. , Selen, A. & Dressman, J.B. Utilizing in vitro and PBPK tools to link ADME characteristics to plasma profiles: case example nifedipine immediate release formulation. J. Pharm. Sci. 102, 3205–3219 (2013). [DOI] [PubMed] [Google Scholar]
- 14. Shono, Y. et al Prediction of food effects on the absorption of celecoxib based on biorelevant dissolution testing coupled with physiologically based pharmacokinetic modeling. Eur. J. Pharm. Biopharm. 73, 107–114 (2009). [DOI] [PubMed] [Google Scholar]
- 15. Shono, Y. , Jantratid, E. , Kesisoglou, F. , Reppas, C. & Dressman J.B. Forecasting in vivo oral absorption and food effect of micronized and nanosized aprepitant formulations in humans. Eur. J. Pharm. Biopharm. 76, 95–104 (2010). [DOI] [PubMed] [Google Scholar]
- 16. Berlin, M. , Przyklenk, K.H. , Richtberg, A. , Baumann, W. & Dressman J.B. Prediction of oral absorption of cinnarizine – a highly supersaturating poorly soluble weak base with borderline permeability. Eur. J. Pharm. Biopharm. 88, 795–806 (2014). [DOI] [PubMed] [Google Scholar]
- 17. Cristofoletti, R. , Patel, N. & Dressman, J.B. Differences in food effects for 2 weak bases with similar BCS drug‐related properties: what is happening in the intestinal lumen? J. Pharm. Sci. 105, 2712–2722 (2016). [DOI] [PubMed] [Google Scholar]
- 18. Heimbach, T. , Xia, B. , Lin, T.H. & He, H. Case studies for practical food effect assessments across BCS/BDDCS class compounds using in silico, in vitro, and preclinical in vivo data. AAPS J. 15, 143–158 (2013). [DOI] [PMC free article] [PubMed] [Google Scholar]
- 19. Jones, H.M. , Parrott, N. , Ohlenbusch, G. & Lavé, T. Predicting pharmacokinetic food effects using biorelevant solubility media and physiologically based modelling. Clin. Pharmacokinet. 45, 1213–1226 (2006). [DOI] [PubMed] [Google Scholar]
- 20. Kesisoglou, F. , Chung, J. , van Asperen, J. & Heimbach, T. Physiologically based absorption modeling to impact biopharmaceutics and formulation strategies in drug development – industry case studies. J. Pharm. Sci. 105, 2723–2734 (2016). [DOI] [PubMed] [Google Scholar]
- 21. Parrott, N. , Lukacova, V. , Fraczkiewicz, G. & Bolger, M.B. Predicting pharmacokinetics of drugs using physiologically based modeling – application to food effects. AAPS J. 11, 45–53 (2009). [DOI] [PMC free article] [PubMed] [Google Scholar]
- 22. Patel, N. , Polak, S. , Jamei, M. , Rostami‐Hodjegan, A. & Turner, D.B. Quantitative prediction of formulation‐specific food effects and their population variability from in vitro data with the physiologically‐based ADAM model: a case study using the BCS/BDDCS class II drug nifedipine. Eur. J. Pharm. Sci. 57, 240–249 (2014). [DOI] [PubMed] [Google Scholar]
- 23. Shono, Y. , Jantratid, E. & Dressman, J.B. Precipitation in the small intestine may play a more important role in the in vivo performance of poorly soluble weak bases in the fasted state: case example nelfinavir. Eur. J. Pharm. Biopharm. 79, 349–356 (2011). [DOI] [PubMed] [Google Scholar]
- 24. Wagner, C. , Jantratid, E. , Kesisoglou, F. , Vertzoni, M. , Reppas, C. & Dressman, J.B. Predicting the oral absorption of a poorly soluble, poorly permeable weak base using biorelevant dissolution and transfer model tests coupled with a physiologically based pharmacokinetic model. Eur. J. Pharm. Biopharm. 82, 127–138 (2012). [DOI] [PubMed] [Google Scholar]
- 25. Xia, B. et al Utility of physiologically based modeling and preclinical in vitro/in vivo data to mitigate positive food effect in a BCS class 2 compound. AAPS PharmSciTech. 14, 1255–1266 (2013). [DOI] [PMC free article] [PubMed] [Google Scholar]
- 26. Zhang, H. et al Application of physiologically based absorption modeling to formulation development of a low solubility, low permeability weak base: mechanistic investigation of food effect. AAPS PharmSciTech. 15, 400–406 (2014). [DOI] [PMC free article] [PubMed] [Google Scholar]
- 27.Center for Drug Evaluation and Research. Sonidegib (LDE255) physiological‐based pharmacokinetic modeling review memo NDA 205266. <https://www.accessdata.fda.gov/drugsatfda_docs/nda/2015/205266Orig1s000Approv.pdf> (2015).
- 28.Center for Drug Evaluation and Research. Ceritinib (LDK378) physiological‐based pharmacokinetic modeling review memo NDA 205755. <https://www.accessdata.fda.gov/drugsatfda_docs/nda/2014/205755Orig1s000SumR.pdf> (2014).
- 29. Huang, S.M. , Abernethy, D.R. , Wang, Y. , Zhao, P & Zineh, I. The utility of modeling and simulation in drug development and regulatory review. J. Pharm. Sci. 102, 2912–2923 (2013). [DOI] [PubMed] [Google Scholar]
- 30. Jones, H.M. et al Physiologically based pharmacokinetic modeling in drug discovery and development: a pharmaceutical industry perspective. Clin. Pharmacol. Ther. 97, 247–262 (2015). [DOI] [PubMed] [Google Scholar]
- 31. Won, C.S. , Oberlies, N.H. & Paine, M.F. Mechanisms underlying food‐drug interactions: inhibition of intestinal metabolism and transport. Pharmacol. Ther. 136, 186–201 (2012). [DOI] [PMC free article] [PubMed] [Google Scholar]
- 32. Sutton, S.C. Role of physiological intestinal water in oral absorption. AAPS J. 11, 277–285 (2009). [DOI] [PMC free article] [PubMed] [Google Scholar]
- 33. Pepin, X.J. , Flanagan, T.R. , Holt, D.J. , Eidelman, A. , Treacy, D. & Rowlings, C.E. Justification of drug product dissolution rate and drug substance particle size specifications based on absorption PBPK modeling for lesinurad immediate release tablets. Mol. Pharm. 13, 3256–3269 (2016). [DOI] [PubMed] [Google Scholar]
- 34. Chung, J. et al Utilizing physiologically based pharmacokinetic modeling to inform formulation and clinical development for a compound with pH‐dependent solubility. J. Pharm. Sci. 104, 1522–1532 (2015). [DOI] [PubMed] [Google Scholar]
- 35. Kostewicz, E.S. , Wunderlich, M. , Brauns, U. , Becker, R. , Bock, T. & Dressman, J.B. Predicting the precipitation of poorly soluble weak bases upon entry in the small intestine. J. Pharm. Pharmacol. 56, 43–51 (2014). [DOI] [PubMed] [Google Scholar]
- 36. Psachoulias, D. et al Precipitation in and supersaturation of contents of the upper small intestine after administration of two weak bases to fasted adults. Pharm. Res. 28, 3145–3158 (2011). [DOI] [PubMed] [Google Scholar]
- 37. Carlert, S. et al Predicting intestinal precipitation – a case example for a basic BCS class II drug. Pharm. Res. 27, 2119–2130 (2010). [DOI] [PubMed] [Google Scholar]
Associated Data
This section collects any data citations, data availability statements, or supplementary materials included in this article.
Supplementary Materials
Supplementary Figure S1 Predictive performance assessment of physiologically based pharmacokinetic (PBPK) models that have prospective predictions (including Shono et al.14 (2009) and Shono et al.15 (2010)). (a) Predicted AUCR vs. observed AUCR. b) Predicted CmaxR vs. observed CmaxR. (c) Predicted tmaxR vs. observed tmaxR. Red solid lines in all plots are lines of identity (y = x). Red dashed lines in all plots represent y = 0.8x and y = 1.25x. Pink dotted lines in all plots represent y = 0.5x and y = 2x. Blue dashed lines in all plots represents y = 1.25 and x = 1.25.
Supplementary Table S1 Detailed summary of the final knowledgebase for prospective predictions and optimization cases.
Supplementary Table S2 Comparison of physiological parameters used in different platforms.