Abstract
Chronic infection with human T-cell leukemia virus type 1 (HTLV1) can lead to adult T-cell leukemia (ATL). In contrast, infection with HTLV2 does not lead to leukemia, potentially because of distinct virus–host interactions and an active immune response that controls virus replication and, therefore, leukemia development. We created a humanized mouse model by injecting human umbilical-cord stem cells into the livers of immunodeficient neonatal NSG mice, resulting in the development of human lymphocytes that cannot mount an adaptive immune response. We used these mice to compare the ability of molecular clones of HTLV1, HTLV2, and select recombinant viruses to induce leukemia–lymphoma in vivo. Infection with HTLV1 strongly stimulated the proliferation of CD4+ T cells, whereas HTLV2 preferentially stimulated the proliferation of CD8+ T cells; both HTLV1 and HTLV2 induced lymphoproliferative disease. Uninfected and HTLV-infected humanized mice both showed granulomatous inflammation as a background lesion. Similarly, recombinant viruses that expressed the HTLV1 envelope protein (Env) on an HTLV2 background (HTLV2–Env1) or Env2 on an HTLV1 background (HTLV1–Env2) induced lymphoproliferative disease. HTLV2–Env1 stimulated the proliferation of CD4+ T cells, whereas HTLV1–Env2 stimulated both CD4+ and CD8+ T-cell subsets. Our results show that T-cell transformation in vivo is guided by the Env protein of the virus. Furthermore, our humanized mouse model is useful for exploring the preferred T-cell tropisms of HTLV1 and HTLV2.
Abbreviations: ATL, adult T-cell leukemia; Env, envelope protein; GvHD, graft-versus-host disease; HTLV, human T-cell leukemia virus; HUSC, human umbilical cord stem cells
Adult T-cell leukemia/lymphoma (ATL) is an aggressive lymphoproliferative disorder that arises in 2% to 5% of men and women chronically infected with human T-cell leukemia virus (HTLV) type 1.1 This disease is a form of nonHodgkin lymphoma and is characterized by the proliferation of infected CD4+ T cells with a mature T-cell phenotype (that is, CD3+CD4+CD25+) and increased blood levels of soluble IL2 receptor α-chain. Although originally defined as a monoclonal disease in nature, improved sequencing techniques have revealed oligoclonal proliferation of CD4+ T cells.1 The presence of infection with HTLV1 (as detected by antibody or PCR screening), subsequent expansion of the CD4+ T-cell population, and histologically detectable lymphoma are sufficient to diagnose ATL.,8 Atypical lymphocytes are pathognomonic when they have a ‘flower-shaped’ nucleus, but they can also have a variety of other phenotypes.3,28 Other defining features of acute ATL are high WBC counts, eosinophilia, hepatosplenomegaly, lymphadenopathy, bone marrow infiltration, variable lytic bone lesions resulting in hypercalcemia, and skin plaques and ulcers.12 The prognosis for patients with acute ATL is poor, with a median survival of less than 1 y despite chemotherapy.12
In contrast, people infected with HTLV2 typically do not develop leukemia–lymphoma even though HTLV2 preferentially and persistently replicates in CD8+ T cells and induces lymphocyte proliferation in vivo.2,5,11
In cell culture, HTLV1 and HTLV2 infect a variety of cell types; however, preferential infection of CD4+ cells by HTLV1 or of CD8+ T cells by HTLV2 leads to cell immortalization.15,30,31 We have shown that HTLV envelope proteins (Env) dictate cellular tropism and subsequent immortalization in vitro.31 Furthermore, infection with a recombinant virus expressing Env of HTLV1 on an HTLV2 virus background (HTLV2–Env1) led to immortalization of CD4+ T cells in vitro, and the recombinant virus HTLV1-Env2 transformed CD8+ T cells in culture.31
Sublethally irradiated immunodeficient mice whose immune systems are reconstituted with human umbilical cord stem cells (HUSC) develop mature human lymphocyte populations.9 Injection of irradiated HTLV1-infected cells into these ‘humanized mice’ resulted in the development of lymphoproliferative disease characterized by oligoclonal proliferation of CD4+ T cells, as observed in humans.9 In this mouse model, an increase in the number of human lymphocytes infected with HTLV1 correlated (not surprisingly) with an increase in proviral load and resulted in splenomegaly, lymphadenopathy, lymphoma, and thymoma.9 In that study,9 mice were euthanized according to a preset schedule (not clinical criteria), and histologic investigation was confined to the spleen, lymph nodes, and thymus. To investigate the association between HTLV Env and the ability to selectively transform human T cells in vivo, we induced lymphoproliferative disorders in humanized mice by infecting them with molecularly cloned HTLV1 or HTLV2; we then compared the subsequent pathogenesis with that after infection with the recombinant viruses HTLV2–Env1 and HTLV1–Env2. These analyses evaluated disease development and included complete clinical and anatomic pathology evaluation. Whereas HTLV1 and HTLV2–Env1 infection primarily drove the proliferation of CD4+ T cells, HTLV2 primarily induced CD8+ T-cell proliferation, and HTLV1–Env2 infection resulted in the expansion of both CD4+ and CD8+ T-cell populations. Regardless of their T-cell preference, all wildtype and recombinant viruses induced lymphoproliferative disorder in these mice.
Materials and Methods
Animals.
Breeding pairs of NOD.Cg-Prkdcscid Il2rgtm1Wjl/SzJ mice (NSG strain) were purchased from The Jackson Laboratory (Bar Harbor, ME). These mice lack mature T cells, B cells, or functional NK cells, and are deficient in cytokine signaling. Animals were housed in individually ventilated microisolation cages with corncob bedding and provided with commercial pelleted rodent chow and chlorinated reverse-osmosis–purified water without restriction. Cages containing autoclaved bedding were used for cage changes, which were performed in a ventilated biosafety cabinet. Mice were maintained in a room with constant temperature (20 ± 2 °C) and relative humidity (50% ± 20%) under a 12:12-h light-dark cycle. The animal use protocol received prior approval by the Institutional Animal Care and Use Committee of The Ohio State University. Mice were purchased SPF and maintained in colonies free of endo- and ectoparasites, mouse parvovirus 1 and 2, minute virus of mice, mouse hepatitis virus, murine norovirus, Theiler murine encephalomyelitis virus, mouse rotavirus, Sendai virus, pneumonia virus of mice, reovirus, Mycoplasma pulmonis, lymphocytic choriomenginitis virus, mouse adenovirus, and ectromelia virus according to quarterly health monitoring of sentinel (CD1) mice exposed to 100% pooled dirty bedding from colony animals at each cage change.
Generation of humanized mice.
Shortly (24 to 48 h) after birth, pups were removed temporarily from the dam and treated with whole-body irradiation at 100 cGy (RS 2000, Rad Source, Suwanee, GA). Each mouse then was injected into the liver with 3 × 10⁴ to 1 × 10⁵ CD34+ HUSC (Lonza, Allendale, NJ) in 50 μL PBS (pH 7.4) by using a sterile 26-gauge hypodermic needle. After recovery, pups were returned to their dams, allowed to mature normally, weaned at 21 d, and then housed in groups (maximum, 5 mice per cage). At 10 wk after HUSC engraftment, mice were infected by intraperitoneal inoculation of 107 lethally irradiated (100 Gy) HTLV-producing cells; an aliquot of cells was maintained in culture to control for irradiation treatment. Animals were euthanized when they lost more than 20% of their body weight within 48 h.
Cell lines and viruses.
MT2 cells were produced by coculturing normal human umbilical-cord blood leukocytes with leukemic T cells from a patient with ATL; these cells produce wildtype HTLV1.33 ACH.2 cells are human CD4+ T cells that were transformed in culture by using a molecular clone of HTLV1, pACH.11 To generate 729.wtHTLV2,35 729.HTLV1–Env2, and 729.HTLV2–Env1,31 729B cells (a human B-lymphoblastoid cell line) were transfected with a molecular clone of HTLV2 (pH6neo), a molecular clone of HTLV1 (ACHneo) in which Env1 was replaced by Env2 (HTLV1–Env2), or a molecular clone of HTLV2 carrying Env1 (HTLV2–Env1), respectively.31 The HTLV1-producing cell lines were maintained in Advanced RPMI 1640 medium (Gibco, Thermo Fisher Scientific, Waltham, MA) supplemented with 10% FBS; for the ACH.2 cell line, 10 IU/mL recombinant IL2 was added. For each cell line, the level of p19 expression (a surrogate marker of virus replication) was measured by ELISA as described;35 p19 levels were: MT2, 180,000 ng/mL; ACH.2, 10,800 ng/mL; 729.wtHTLV2, 2600 ng/mL; 729.HTLV1–Env2, 3965 ng/mL; and 729.HTLV2–Env1 cells, 0.5 ng/mL.
Flow cytometry.
Leukocyte populations in the peripheral blood of all mice were monitored by immunophenotyping. At various time points after inoculation with HUSC, whole blood (50 µL) was collected from the facial vein into a vacuum phlebotomy tube containing EDTA. Aliquots of blood were mixed with commercially available fluorophore-labeled monoclonal antibodies specific for multiple leukocyte classes: human CD3, CD4, CD8, CD25, and CD45 and mouse CD45 (BD Biosciences, Franklin Lakes, NJ; Figure 1). Cells and antibodies were incubated for 30 min at room temperature, and RBC were lysed by using Pharm Lyse (BD Biosciences). Samples were analyzed by flow cytometry (FACSCalibur, BD Biosciences).
Figure 1.
Fluorophore-labeled antibodies used for cell identification by flow cytometry.
PCR analysis.
PCR assays were used to detect HTLV genomic DNA in the inoculated mice. DNA was extracted from mouse spleens by using the DNeasy Blood and Tissue Kit (Qiagen, Rockville, MD) according to the manufacturer's instructions. Quantitative PCR (qPCR) amplification was carried out in a final reaction volume of 50μl. The nested reaction conditions were 95˚C for 10 min, followed by 30 cycles of 30 sec at 94˚C, 30 sec at 57˚C, and 30 sec at 72˚C, using the primer pair HTLV1 forward (5′ TGT ACA AGG CGA CTG GTG CCC 3′) and HTLV1 reverse (5′ ATG AGG GGT GGT AGG CCT TGG T 3′), which resulted in an 800-bp product. The second reaction conditions were 95˚C for 10 min, followed by 30 cycles of 30 sec at 94˚C, 30 sec at 56˚C, and 30 sec at 72˚C using primer pair HTLV2 forward (5′ GGG GAG GCT CCG TTG TCT GC 3′) and HTLV2 reverse (5′ GTT AGC GTG ACG GGT GCC CT 3′), which generated a 244-bp product. PSE356 CMV Rex1–Tax116 was used as a standard template under these conditions.
Proviral DNA assay.
Genomic DNA was extracted from the PBMC of ATL patients or mouse spleens. The HTLV1 DNA assay measured the number of copies of integrated viral genome by using a droplet digital PCR assay (BioRad, Hercules, CA) with tax primers that amplify a 154-bp region, and a FAM–MGB probe.32 In addition, the cellular housekeeping gene ribonuclease P protein subunit P30 was amplified in a duplex PCR assay and detected with a VIC–MGB probe. DNA was digested with BamHI; mixed with the primers, probes, and 2× Supermix (BioRad); emulsified by using a droplet generator (model QX200, BioRad); PCR-amplified in a 96-well plate, and analyzed on the droplet reader (model QX200, BioRad); Quanta Software (version 1.3.2.0, Quanta Software Solutions, Dubai, United Arab Emirates) was used to quantify the number of viral genome copies per microliter.
Thresholds were determined manually for each experiment, according to the negative controls, which include a no-template control and DNA from a healthy volunteer. Fluorescence intensity determined droplet positivity; only droplets above a minimum amplitude threshold were counted as positive. The proviral load (PVL) was calculated as the percentage of infected cells Data normalization was accomplished by applying log2 transformation, calculating the mean and standard deviation, and defining the lower (mean – 2 SD) and upper (mean + 2 SD) values of the expected range for each assay type. These values were used to convert the log-transformed values to a percentage of the expected range for each assay type, by first subtracting the lower range value for the assay from the test result and then dividing by the difference of the upper and lower values of the expected assay range. The linear relationship of the normalized values was assessed by using Pearson correlation.
Pathology assessment.
In all humanized mice, engraftment in multiple organs and systems was determined by evaluating for HUSC-associated phenotypes in a conventional battery of clinical pathology assays and anatomic pathology measurements. HTLV-infected mice were euthanized according to clinical signs (early removal criteria). Noninfected mice were euthanized 25 wk after reconstitution with HUSC.
Clinical pathology analysis.
For necropsy, mice were euthanized by CO2 inhalation. Whole blood was collected by percutaneous cardiocentesis and separated into 2 aliquots. One aliquot mixed with EDTA was used to perform a CBC count with WBC differential by using an automated hematology analyzer (FORCYTE Autosampler 10, Oxford Science, Oxford, CT). The remaining blood aliquot was allowed to clot at room temperature for 30 min and then centrifuged at 1000 × g for 5 to 10 min at 4 °C, after which serum was subjected to a routine battery of clinical chemistry analyses using an automated analyzer (VetACE, Alfa Wasserman, West Caldwell, NJ).
Anatomic pathology evaluation.
All mice underwent complete necropsies. Whole-body and individual organ weights were obtained. All tissues were fixed by immersion in 10% neutral buffered formalin; bones of the skull, sternum, vertebral column, and rear limbs subsequently were demineralized for 48 h at room temperature in Decalcifier I containing formic acid (Surgipath Medical Industries, Richmond, IL). All tissues were processed by routine methods and embedded in paraffin. Sections (5 μm thick) were stained with hematoxylin and eosin and assessed under bright-field microscopy (Olympus BX, B and B Microscopes, Pittsburgh, PA) by a board-certified veterinary anatomic pathologist.
Immunohistochemistry.
Foci of infiltrating cells identified in stained sections of selected organs (especially bone marrow, liver, and lymphoid organs) were characterized further by using an indirect immunoperoxidase method and antibodies specific for several leukocyte biomarkers: human CD3 and CD79a (Dako, Carpenteria, CA), human CD45 (BD Pharmingen, San Diego, CA), and mouse F4/80 (Serotec, Raleigh, NC) to define the species origin of the cells (Figure 2). Briefly, by using an automated immunostainer (Autostainer Universal Staining System, Dako), primary antibodies were applied for 30 min at room temperature. After cells were rinsed with wash buffer (Dako Cat. No S3006), biotinylated secondary antibodies were applied for 30 min at room temperature. The detection signal was amplified by using a standard avidin–biotin complex kit (Vector Laboratories, Burlingame, CA), and the reaction was developed by using 3,3′-diaminobenzidine. Sections were counterstained with hematoxylin.
Figure 2.
Primary and antibodies used for cell identification by immunohistochemistry.
Statistical analysis.
Data are represented as means ± SEM unless otherwise stated. Data were analyzed by using GraphPad Prism 6.05 (GraphPad Software, La Jolla, CA), and a P value less than 0.05 was considered statistically significant.
Results
Generation and characterization of humanized mice.
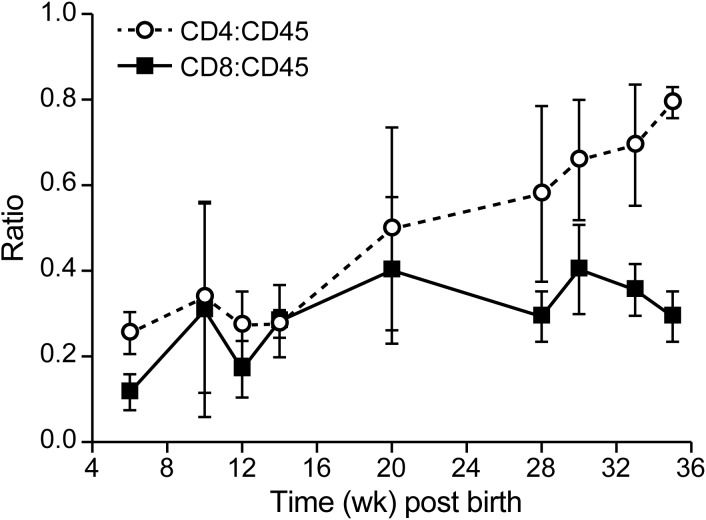
Humanized mice were generated by injecting HUSC into the livers of sublethally irradiated neonatal NSG mice. At 4 w after the inoculation of HUSC, flow cytometry revealed human peripheral blood lymphocytes (stained for human CD3, CD4, CD8, CD25, and CD45) in the circulation, and after 8 wk, 10% to 60% of the total mononuclear cells in the blood were human leukocytes (data not shown). A small proportion of the human peripheral blood lymphocytes (5%) expressed CD25, which is a marker of T-cell activation.8 The remaining cells stained positively for mouse CD45 and were determined to be neutrophils and monocytes on differential blood cell evaluation. The ratio of human CD4+ T cells:CD45+ lymphocytes slowly increased from 0.2 to about 0.6 (Figure 3), whereas the CD8:CD45 ratio remained constant. In agreement with published reports,8 we found that a large proportion of T cells (15% to 47%) was positive for both CD4 and CD8 at week 10 after inoculation of HUSC, whereas very few (2% to 3%) T cells were double-positive at 22 wk after inoculation. Although populated by human lymphocytes, the lymphoid organs of these immunodeficient mice were small, with a typical spleen weight of 60 ± 20 mg (normal range, 30–50 mg). The overall WBC count for humanized NSG mice was 2700 ± 1300 cells/μL, with a lymphocyte count of 540 ± 400 cells/μL; eosinophils were nearly undetectable (Table 1).
Figure 3.
CD4+ and CD8+ T cell development in humanized mice. Human CD4+ and CD8+ T cells were measured as the percentage of the total human CD45+ lymphocyte population in blood. Group sizes were 10 for early (10 wk) time points and 3 for late (22 wk) time points. After mice were inoculated with human umbilical cord stem cells at 24 to 48 h after birth, the proportion of CD4+ T cells slowly increased. Data are presented as means ± 1 SD.
Table 1.
Comparison of leukogram and macroscopic findings among different HTLV viruses
| Virus used to infect human umbilical cord stem cells | Cell count (×103/µL) (no. of mice) |
No. of mice affected/ no. of mice evaluated |
|||||
| WBC | Lymphocytes | Macrophages | Neutrophils | Eosinophils | Atypical cells | Splenomegaly or lymphadenopathy | |
| None | 2.7 ± 1.3 (7) | 0.6 ± 0.4 | 0.2 ± 0.2 | 1.9 ± 1.0 | 0.1 ± 0.1 | None | None |
| HTLV1 (MT2) | 52.0 ± 36.5 (5) | 14.0 ± 25.7 | 9.8 ± 7.2 | 26.2 ± 17.2 | 2.0 ± 1.2 | 5/10 | 4/6 |
| HTLV1 (ACH.2) | 5.9 ± 4.9 (6) | 2.2 ± 2 | 0.7 ± 0.5 | 2.7 ± 2.0 | 0.2 ± 0.4 | 3/6 | 2/5 |
| HTLV2 (729.wt.) | 12.2 ± 13.6 (5) | 2.9 ± 3 | 2.5 ± 3 | 9.5 ± 9.9 | 0.8 ± 1.0 | 1/5 | 3/5 |
| HTLV1–Env2 | 7.0 ± 8.1 (5) | 1.9 ± 3.5 | 1.3 ± 2.3 | 3.9 ± 2.8 | 0.1 ± 0.1 | 1/6 | 2/6 |
| HTLV2–Env1 | 2.5 ± 1.3 (6) | 0.8 ± 0.5 | 0.3 ± 0.1 | 1.3 ± 0.7 | 0.1 ± 0.1 | 1/5 | 0/5 |
Mice were euthanized according to clinical signs (early removal criteria) at the respective time points (see Table 2). WBC counts were performed at euthanasia and included both human and mouse cells.
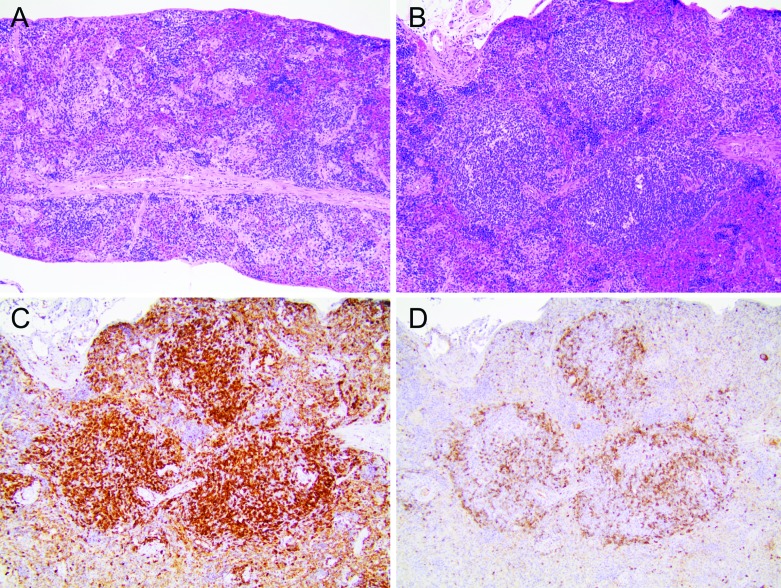
After HUSC engraftment, the splenic white pulp of NSG mice underwent overall expansion, with the development of prominent periarteriolar lymphoid sheaths (Figure 4 A and B). Immunohistochemistry revealed lymphocytes positive for human CD45 in both the B- and T-cell regions of the major lymphoid organs (data not shown). Colonization of the spleen by human CD3+ T cells (Figure 4 C), which comprised the majority of lymphocytes in the new lymphoid follicles, was much more extensive than was the infiltration of the marginal zone by human CD79+ B cells (Figure 4 D); these findings indicate that, over time, the development of T cells was a more prominent outcome of HUSC engraftment relative to B cells.
Figure 4.
Reconstitution of the immune system of NSG mice by using human lymphocytes. Inoculation of NSG mice with human umbilical cord stem cells (HUSC) led to the development of human lymphocytes that reconstituted the spleen and other lymphoid organs. (A) Spleen size was reduced overall (noted as few, small white pulp lining muscular arterioles) in naïve adult NSG mice compared with immunocompetent mice. The red pulp of humanized mice contained modest numbers of hematopoietic (mainly erythrocyte) precursors. Hematoxylin and eosin stain; original magnification, 10×. (B) Spleen of an adult NSG mouse engrafted with HUSC, showing pronounced expansion of white pulp. Hematoxylin and eosin stain; original magnification, 10×. (C) Spleen of an adult NSG mouse engrafted with HUSC demonstrates that the majority of lymphocytes within the reconstituted white pulp expressed human CD3 (thus compatible with human T lymphocytes). Antihuman CD3 indirect immunoperoxidase with hematoxylin counterstain; original magnification, 10×. (D) Spleen of an adult NSG mouse engrafted with HUSC, illustrating that the expression of the human B-lymphocyte marker CD79 was limited chiefly to the periphery (marginal zones) of white pulp foci. Antihuman CD79 indirect immunoperoxidase with hematoxylin counterstain; original magnification, 10×.
Systemic granulomatosis after human cell engraftment.
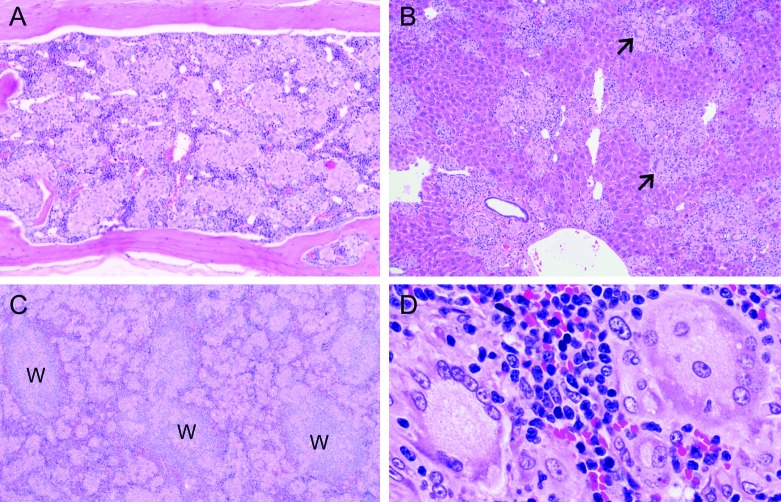
Systemic granulomatosis complicated the histologic analysis of tissues from humanized NSG mice. Widespread granulomatosis was present in the bone marrow (Figure 5 A), liver (Figure 5 B), and spleen (Figure 5 C) of mice engrafted with HUSC. Histologically, granulomas presented as multiple small, randomly dispersed, coalescing leukocytic foci consisting mainly of epithelioid macrophages (large, pale, oval, mononuclear cells with abundant cytoplasm) often in association with few to many syncytial giant cells consistent with classic Langerhans-type giant cells (very large cells with multiple peripheral nuclei and abundant, often foamy cytoplasm; Figure 5 D). Modest numbers of lymphocytes (small basophilic cells with scant cytoplasm) were scattered within and around the margins of granulomatous foci. In addition, the mouse innate immune response appeared to be induced in engrafted mice, as evidenced by macrophages (Kupffer cells) in the liver sinusoids, which were more prominent and modestly increased in number relative to those in nonengrafted mice.
Figure 5.
Granulomatosis in multiple organs of humanized mice. (A) Bone marrow in the vertebra of an adult NSG mouse engrafted on postnatal day 1 with human umbilical stem cells (HUSC). Most of the marrow is effaced by coalescing pale granulomas composed of myriad epithelioid macrophages and modest numbers of syncytial giant cells. Hematoxylin and eosin stain; original magnification, 10×. (B) Liver of an adult NSG mouse engrafted with HUSC showing partial replacement of the parenchyma by numerous small, randomly dispersed, coalescing granulomas composed of many epithelioid macrophages centrally with multiple syncytial giant cells (arrows) and scattered lymphocytes located near the periphery. Sinusoidal macrophages (Kupffer cells) are modestly increased in number as indicated by more prominent spindle cells associated with patent sinusoids. Hematoxylin and eosin stain; original magnification, 10×. (C and D) Enlarged spleen of an adult NSG mouse engrafted with HUSC due to expansion of red pulp by numerous coalescing pale granulomas. Regions of white pulp (W) are identifiable by (C) their large populations of small, dark basophilic lymphocytes. (D) Granulomatous foci have dense cores of epithelioid macrophages ringed by many Langerhans-type syncytial giant cells with abundant foamy cytoplasm. Hematoxylin and eosin stain; original magnification: 10× (C), 20× (D).
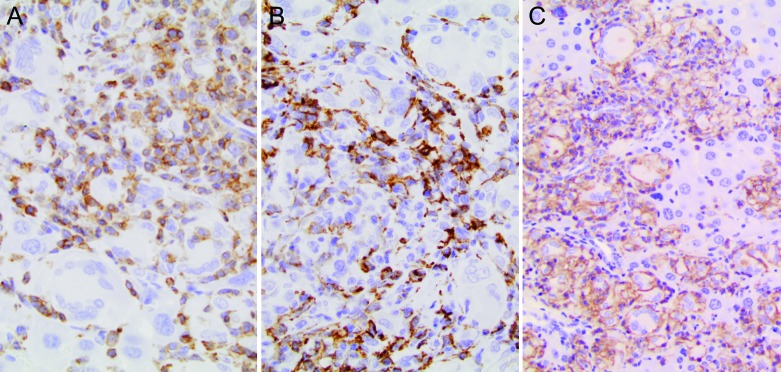
Immunohistochemistry for leukocyte markers was applied to define the nature of the immune reaction in granulomatous foci. The small lymphocytes expressed human CD3 (Figure 6 A). A few of the myeloid cells, excluding the multinucleated giant cells, expressed F4/80 (a marker for the mouse monocyte–macrophage lineage; Figure 6 B). However, the bulk of the infiltrating leukocytes, including some giant cells, were of human origin, as indicated by their strong labeling for human CD45 (a common marker for all human leukocytes; Figure 4 C).
Figure 6.
Liver of an adult NSG mouse engrafted with human umbilical stem cells (HUSC). (A) Many of the cells in leukocyte clusters were small, round T lymphocytes that expressed human CD3. Antihuman CD3 indirect immunoperoxidase procedure with hematoxylin counterstain; original magnification, 40×. (B) Modest numbers of F4/80+ mouse macrophages (Kupffer cells) with elongated nuclei were common within leukocyte clusters. Antimouse F4/80 indirect immunoperoxidase procedure with hematoxylin counterstain; original magnification, 40×. (C) Most myeloid cells within granulomatous foci were macrophages expressing human CD45. Expression of CD45 was less uniform in multinucleated giant cells at the peripheries of granulomas. Antihuman CD45 indirect immunoperoxidase procedure with hematoxylin counterstain; original magnification, 40×.
Lymphoproliferative disease after infection with HTLV1, HTLV2, or chimeric viruses.
In this study, we compared the development of lymphoproliferative disease in humanized mice after infection with HTLV1 from MT2 cells, molecularly cloned HTLV1 from ACH.2 cells, and molecularly cloned HTLV2 from 729.wtHTLV2 cells. In addition, some mice were infected with molecularly cloned recombinant chimeric viruses in which the native Env was replaced with that of a different subtype (that is, HTLV2–Env1 or HTLV1–Env2). After infection of humanized mice with these viruses, WBC counts remained relatively constant over time (data not shown), with a sudden increase on development of clinical signs and weight loss at 2 to 3 d before animals became moribund and had to be euthanized. Only mice infected with HTLV2–Env1 did not demonstrate an increase in WBC at the time of euthanasia (Table 1). The overall increase in WBC counts was mainly due to increases in the numbers of lymphocytes and eosinophils. In addition, atypical cells (enlarged nuclei and scant cytoplasm) were found in all groups of infected mice.
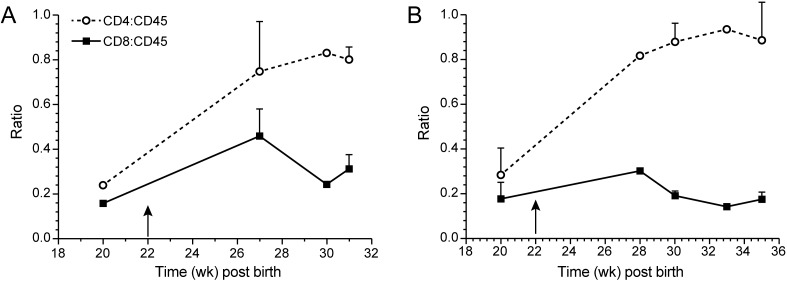
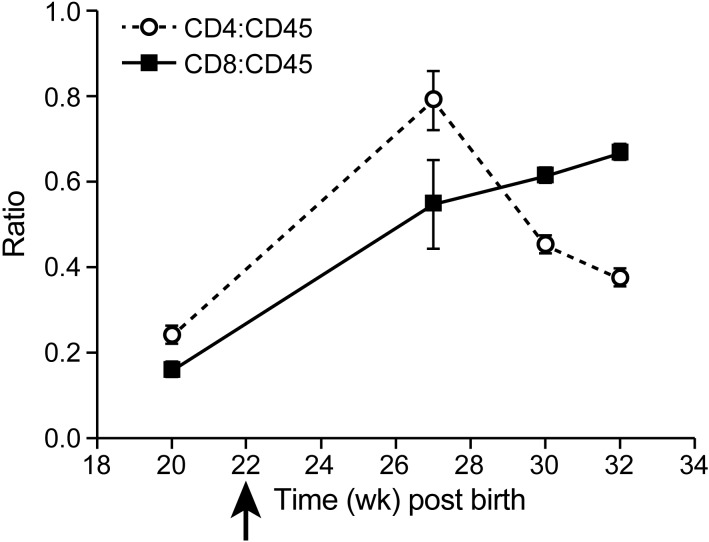
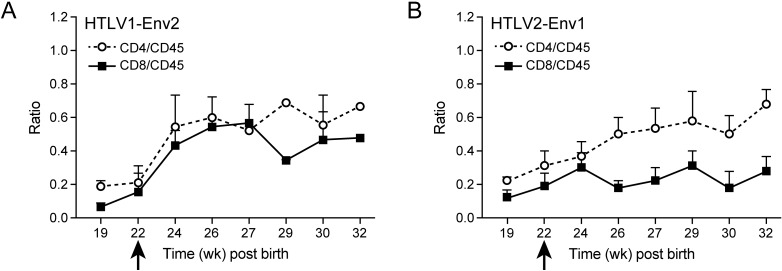
In cell culture and in patients, strong proliferation of CD4+ T cells occurs after infection with HTLV1. In contrast, infection with HTLV2 has been shown to preferentially drive CD8+ T-cell proliferation and immortalization in vitro.8In cell culture, HTLV2–Env1 preferentially immortalizes CD4+ T cells, whereas HTLV1–Env2 immortalizes CD8+ T cells.31 To test whether and how these viruses drive T-cell proliferation in vivo, we followed the CD4:CD45 and CD8:CD45 ratios in infected mice. After infection with HTLV1 (either wildtype or molecularly cloned), the CD4:CD45 ratio increased from 0.2 to 0.8 and higher (Figure 7). The increase in CD4+ T cells was correlated with an increase in soluble serum IL2 receptor α chain (data not shown). HTLV2 infection led to an increase in both the CD4:CD45 and CD8:CD45 ratios (Figure 8), thus not driving CD8+ T-cell proliferation to the exclusion of other cell types (unlike how HTLV1 drove CD4+ T-cell proliferation). Infection with HLTV2–Env1 increased CD4+ T-cell counts moderately (ratio, 0.6) and CD8+ numbers slightly (ratio, 0.3), whereas HTLV1–Env2 led to similar increases in both CD4+ and CD8+ T cells (Figure 9).
Figure 7.
Development of CD4+ and CD8+ T cells after HTLV1 infection. After infection of humanized mice with HLTV1, the proportion of human CD4+ T cells as a percentage of the total human CD45+ lymphocyte population increased very quickly. This increase was independent of the virus used for infection and the time after inoculation of human umbilical cord stem cells; arrow indicates time of infection. (A) Infection with HTLV1 (MT2) at 22 wk after inoculation with HUSC. (B) Infection with HTLV1 (ACH.2) at 22 wk after inoculation with HUSC. Data are presented as means ± 1 SD (n = 3 to 5).
Figure 8.
Development of CD4+ and CD8+ T cells after infection with HTLV2. Human CD4+ and CD8+ T cells were measured as a percentage of the total human CD45+ lymphocyte population. Group sizes are 10 mice at 10 wk after birth (early time points) or 3 mice at 22 wk after birth (late time points). After infection with HTLV2 at week 22, CD8+ T cells increased over time. Data are presented as means ± 1 SD.
Figure 9.
Development of CD4+ and CD8+ T cells after infection with recombinant HTLV viruses. Human CD4+ and CD8+ T cells were measured as percentages of the total human CD45+ lymphocyte population. Time points represent 10 at 10 weeks post birth (early time points) to 3 at 22 weeks post birth (late time points) animals per group. Arrow indicates time of infection. After infection with the recombinant virus HTLV1–Env2 (A) both T cell subsets proliferated. After infection with HTLV2–Env1 (B), the proportion of CD4 T cells increased. Data are presented as means ± 1 SD.
Induction of lymphoproliferative disease after infection with HTLV1, HTLV2, or chimeric viruses.
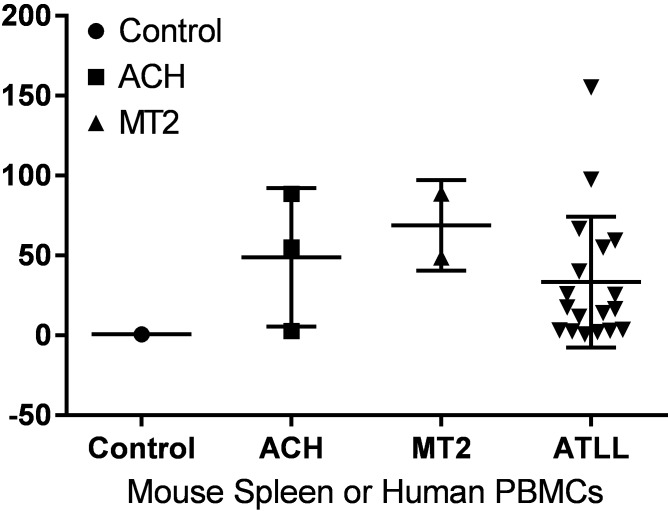
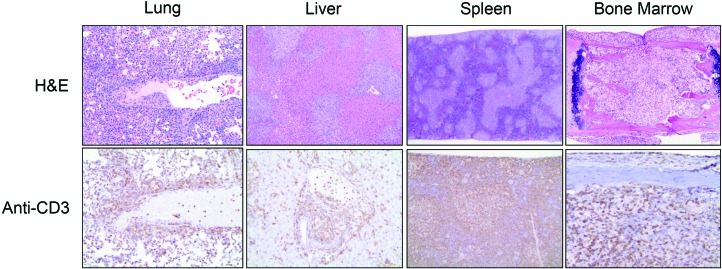
All mice infected with HTLV1, HTLV2, or chimeric viruses succumbed to lymphoproliferative disease; survival time after infection did not differ significantly between groups regardless of the virus used for infection (Table 2). After infection with HTLV1 (ACH.2), 2 of 5 (40%) of infected mice developed lymphadenopathy or splenomegaly. In HTLV1 (MT2)-infected animals, 4 of 6 (67%) had lymphadenopathy or splenomegaly. Lymphoproliferative disease could be transferred by injection of 107 spleen cells into naïve animals (3 of 5 animals) but did not develop after transfer of fewer cells. PCR analysis confirmed the integration of the viral genome into splenic lymphocytes of all HTLV1-infected mice (data not shown). In select mice, the proviral load was comparable to that in peripheral blood lymphocytes from patients with ATL (Figure 10). Histologically, mice infected with either preparation of HTLV1 (ACH.2 or MT2) demonstrated infiltration by neoplastic lymphocytes in multiple organs (Figure 11 and Table 3). The degree of organ involvement was more extensive in mice inoculated with MT2 HTLV1-producer cells relative to ACH.2 HTLV1-producer cells (Table 3). After infection with HTLV2, 3 of 5 (60%) mice developed enlarged spleens. The histologic changes in mice infected with cloned HTLV2 were similar to those in animals infected with cloned HTLV1 (ACH.2; Table 3). Infection with HTLV1–Env2 led to enlarged lymph nodes and spleen in 2 of 6 (33%) mice. In contrast, infection with HTLV2–Env1 did not lead to enlargement of lymphoid organs. The infiltration of neoplastic lymphocytes was detectable histologically after infection with either recombinant virus. Furthermore, neoplastic lymphocytic infiltration was detectable in fewer organs in mice infected with the recombinant viruses than in those infected with either HTLV1 or HTLV2 (Table 3).
Table 2.
Survival analysis
| Survival (wk) | ||
| mean ± 1 SD | Range | |
| None | 30 | 0 |
| HTLV1 (ACH.2) | 14.6 ± 9.7 | 5–25 |
| HTLV1 (MT2) | 6.3 ± 3.3 | 6–9 |
| HTLV2 (729-pH6) | 8.2 ± 1.6 | 7–10 |
| HTLV1–Env2 | 5.3 ± 2.0 | 1–8 |
| HTLV2–Env1 | 9.0 ± 1.7 | 5–10 |
Necropsy was performed at euthanasia in accordance with early removal criteria (weight loss).
The size of groups varied between 5 and 10 mice. Survival did not differ between HTLV. Uninfected mice were euthanized after 30 wk.
Figure 10.
Determination of proviral load in humanized mice. The proviral load of HTLV1 was measured from the spleens of moribund mice infected with MT2 (n = 3) or ACH.2 (n = 2) and then compared with peripheral blood leukocytes (PBMC) from 18 patients with ATL (ATLL). The proviral copy number is expressed as a percentage relative to 100 cells each with a single provirus.
Figure 11.
Multicentric lymphoma in NSG mice infected with HTLV1. Hemotoxylin and eosin (H&E) staining of and CD3 expression by neoplastic lymphocytes in lung, liver, spleen, and bone marrow from a humanized mouse infected with HTLV1 (MT2). Neoplastic T cells were visualized by immunostaining for human CD3 (lower row) and were widespread in major viscera (lung, liver) as well as organs that normally support lymphopoiesis (splenic white pulp, bone marrow). Original magnification: upper row, 10× (lung and liver), 4× (spleen and bone marrow); lower row, 20× (lung, liver), 10× (spleen and bone marrow).
Table 3.
Lymphoproliferative disease in HTLV-infected NSG mice
| Spleen | Lymph nodes and thymus | Lung | Liver | Urinary tract and kidney | Reproductive tract | Salivary and adrenal glands | |
| None | 0% (10/10) | 0% (10/10) | 0% (10/10) | 0% (10/10) | 0% (10/10) | 0% (10/10) | 0% (10/10) |
| HTLV1 (MT2) | 75% (6/8) | 60% (3/5) | 90% (9/10) | 75% (6/8) | 80% (4/5) | 100% (5/5) | 80% (4/5) |
| HTLV1 (ACH.2) | 67% (6/9) | 50% (3/6) | 67% (6/9) | 22% (2/9) | 33% (2/6) | 67% (4/6) | 17% (1/6) |
| HTLV2 (729-pH6) | 80% (4/5) | 80% (4/5) | 100% (5/5) | 86% (6/7) | 40% (2/5) | 80% (4/5) | 40% (2/5) |
| HTLV1–Env2 | 50% (3/6) | 14% (1/7) | 33% (2/6) | 0% (0/6) | 0% (0/7) | 14% (1/7) | 14% (1/7) |
| HTLV2–Env1 | 63% (5/8) | 12% (1/8) | 50% (4/8) | 0% (0/8) | 0% (0/8) | 12% (1/8) | 12% (1/8) |
Numbers in parentheses denote the number of affected mice / number of mice examined
Necropsy was performed after euthanasia (see Table 2).
Lymphoproliferative disease was histologically defined as lymphocytic aggregates in at least 2 organs in diseased animals. In addition, MT2-infected mice had lymphocytic aggregates in brain, heart, and pancreas; 6 HUSC-inoculated mice did not exhibit any disease or lymphocytic aggregates.
Discussion
ATL develops over time in a small subset of patients chronically infected with HTLV; this syndrome can be reproduced experimentally in humanized mice that lack a functional immune system. After inoculation with HUSC, neonatal BALB/c-Rag2–/– Il2rg–/– mice develop human lymphocytes that are not immunocompetent.29 On infection by injection of irradiated MT2 cells, these mice developed oligoclonal CD4+ T-cell proliferation with splenomegaly, lymphadenopathy, and lymphoma–thymoma.29 After histologic examination of the spleen, lymph node and thymus granulomatous inflammation were not reported.
The clinical and pathologic manifestations of graft-versus-host disease (GvHD) in humans as well as mice are somewhat variable but are classified broadly as acute and chronic forms.19 In humans, acute GvHD typically manifests within 100 d of hematopoietic stem cell transplantation, whereas chronic GvHD typically develops 100 d or longer after transplantation and can take 2 to 5 y to become clinically evident. Pathologic outcomes in rodent models are highly variable, even within these 2 broad categories.10,25 An extensive review of the literature has revealed a limited number of publications with histopathologic descriptions or photomicrographic illustrations documenting a granulomatous response with prominent multinucleated giant cells and epithelioid macrophages, similar to what we have described here in the current study. Other authors26 have described chronic GvHD in NSG mice humanized with CD34+-selected, CD3-depleted stem cell grafts. These mice developed granulomatous hepatitis with epithelioid macrophages and giant cell formation, reminiscent of sarcoidosis.26 In addition, NSG mice engrafted with human fetal hematopoietic stem cells and implanted with fragments of human fetal thymus and liver had substantial hepatitis that was characterized by granulomatous inflammation with epithelioid macrophages and fibrosis.18 This example is particularly interesting given that another group4 asserted that the epithelioid macrophages and multinucleated giant cells in lymph nodes and spleens of lethally irradiated (C3H × C57BL/10)F1 hybrid mice infused with C3H donor thymus cells were thymic in origin. One of 2 NSG mice receiving G-CSF-mobilized human peripheral blood mononuclear cells documented liver pathology characterized by portal aggregates of human CD68+ macrophages, but the report had7 no mention of epithelioid or giant cell macrophages. Another publication mentioned granulomatous GvHD, with giant multinucleated macrophages in irradiated 129/Sv but not C57BL/6 mice injected with neonatal bone marrow from syngeneic Socs1−/− mice.7 These reports are consistent with anecdotal evidence of increased mortality rates in humanized mice and may be related to the formation of granulomas.
In agreement with other investigators,29 a high proportion of CD4+CD8+ double-positive T cells was present in the blood of our humanized mice initially after engraftment. Specifically, infection of the mice at 10 wk after the inoculation of HUSC resulted in high percentages of CD4+CD8+ double-positive T cells (data not shown), whereas infection after 22 wk did not; we therefore chose 10 wk as the time of infection for subsequent experiments. A probable explanation for this difference is that T cells in humanized mice mature extrathymically over time.
Infection with HTLV led to the development of lymphoproliferative disease in all humanized mice regardless of virus inoculated, such that mice had to be euthanized according to predefined euthanasia criteria. Similar to ATL in humans,12 HTLV-infected humanized mice showed an increase in WBC counts, a diffuse pattern of leukemic cell infiltration into many tissues, and a mature T-cell phenotype. In addition, atypical lymphocytes were present in HTLV-infected mice, which, in contrast to the atypical lymphocytes in ATL patients, had a large nucleus without the characteristic ‘flower’ shape. Histologically, multiple organs had lymphocytic infiltrates.
In vitro, HTLV1 immortalizes CD4+ T cells, and HTLV2 immortalizes CD8+ T cells,31 although both viruses infect a variety of lymphocyte subpopulations.8 In these previous studies, neither the exchange of Tax, Rex,34 nor long terminal repeat sequences31 influenced the immortalization of CD4+ compared with CD8+ T cells. In vitro immortalization studies involving chimeric viruses (HTLV1–Env2 and HTLV2–Env1) suggested the potential role of Env in this process, in which HTLV1–Env2 preferentially immortalized CD8+ T cells, and HTLV2–Env1 preferentially immortalized CD4+ T cells.31 This difference in transformation ability has been linked to receptor usage.14 The HTLV1 Env protein binds to heparan sulfate proteoglycans,13,23 glucose transporter 1 (GLUT1),6,20 and neuropilin 1.9 HTLV2 uptake is mediated mainly through binding of Env to GLUT1.17 Whereas CD4+ T cells express higher levels of heparan sulfate proteoglycans, CD8+ T cells have higher levels of GLUT1, thus the differential expression of receptor molecules may support preferential infection by the different viruses.14 However, HTLV1, HTLV2, and the recombinant viruses initially infect a wide variety of lymphocyte subtypes in vitro. Subsequently, they preferentially immortalize CD4+ or CD8+ T cells; thus, the Env–receptor interaction does not fully explain the in vitro immortalization. In humanized mice, immortalization was not directly linked to the Env gene expressed. Further analysis and reexamination of accessory proteins like Tax, Rex, and Hbz are required to fully understand the role of Env in concert with other viral proteins for preferential tropism and the subsequent induction of leukemia–lymphoma.
The extent of lymphoproliferative disease detectable by histologic evaluation of the humanized mice differed among viruses. Whereas infection with MT2 (wild-type HTLV1)-, ACH.2 (cloned HTLV1)-, and 729-pH6neo (cloned HTLV2)-generated virus resulted in a greater tumor burden, infection with the recombinant viruses HTLV1–Env2 and HTLV2–Env1 led to less tumor infiltration, but this difference did not change clinical outcome. Tumor burden did not correlate with survival of mice. Whereas HTLV1 infection results in the development of leukemia in a small proportion of infected human patients,2,5,12 infection with HTLV2 rarely results in leukemia although the proliferation of CD8+ T cells is stimulated. In humanized mice, HTLV1 infection resulted in preferential proliferation of CD4+ T cells, and infection with HTLV2 led to preferential proliferation of CD8+ T cells. However, in contrast to findings in humans, both HTLV1 and HTLV2 were lymphomagenic in mice. These data indicate that the immune system plays an important part in controlling HTLV infection and lymphoma development in mice; this situation is reminiscent of human EBV infection. Specifically, EBV causes B-cell lymphoma in a small percentage of humans. Transfer of lymphocytes from persistently EBV-infected healthy volunteers into immunodeficient mice results in the efficient development of B-cell lymphoma, indicating that a functional immune system is necessary to control the outgrowth of leukemic cells.22 For HTLV124 and HTLV2,21 the strength of the cytotoxic T-cell response correlates inversely with proviral load and presumably interferes with disease development. In a recent study, intratibial inoculation of HTLV1-infected mice with CD133+ stem cells initiated HTLV1-specific T-cell responses, suggesting that the immune control of HTLV2-induced lymphoproliferative disease might be investigated in this mouse model.27
Acknowledgments
We acknowledge the Comparative Pathology and Mouse Phenotyping Shared Resource (CPMPSR) of The Ohio State University Comprehensive Cancer Center for excellent necropsy (Ms. Julie Rectenwald), histotechnologic (Ms. Anne Saulsbery), and immunohistochemical (Mr. Alan Flechtner and Ms. Florinda Jaynes) support. This work was supported by NIH grant P01CA100730. The CPMPSR is supported in part by NIH grant P30 CA016058.
References
- 1.Bangham CR, Ratner L. 2015. How does HTLV1 cause adult T-cell leukaemia/lymphoma (ATL)? Curr Opin Virol 14:93–100. [DOI] [PMC free article] [PubMed] [Google Scholar]
- 2.Bartman MT, Kaidarova Z, Hirschkorn D, Sacher RA, Fridey J, Garratty G, Gibble J, Smith JW, Newman B, Yeo AE, Murphy EL, HTLV Outcomes Study (HOST) Investigators. 2008. Long-term increases in lymphocytes and platelets in human T-lymphotropic virus type II infection. Blood 112:3995–4002. [DOI] [PMC free article] [PubMed] [Google Scholar]
- 3.Bennett JM, Catovsky D, Daniel MT, Flandrin G, Galton DA, Gralnick HR, Sultan C. 1989. Proposals for the classification of chronic (mature) B and T lymphoid leukaemias. French–American–British (FAB) Cooperative Group. J Clin Pathol 42:567–584. [DOI] [PMC free article] [PubMed] [Google Scholar]
- 4.Bennett M, Sturgeon M, Engler JP. 1973. Graft-versus-host reactions in mice. IV. Thymus cell suppression of antibody formation. Am J Pathol 71:135–150. [PMC free article] [PubMed] [Google Scholar]
- 5.Ciminale V, Rende F, Bertazzoni U, Romanelli MG. 2014. HTLV1 and HTLV2: highly similar viruses with distinct oncogenic properties. Front Microbiol 5:1–9. [DOI] [PMC free article] [PubMed] [Google Scholar]
- 6.Coskun AK, Sutton RE. 2005. Expression of glucose transporter 1 confers susceptibility to human T-cell leukemia virus envelope-mediated fusion. J Virol 79:4150–4158. [DOI] [PMC free article] [PubMed] [Google Scholar]
- 7.Fujii H, Luo ZJ, Kim HJ, Newbigging S, Gassas A, Keating A, Egeler RM. 2015. Humanized chronic graft-versus-host disease in NOD-SCID il2rγ−/− (NSG) mice with G-CSF–mobilized peripheral blood mononuclear cells following cyclophosphamide and total body irradiation. PLoS One 10:e0133216. [DOI] [PMC free article] [PubMed] [Google Scholar]
- 8.Fujii M, Matsuoka M. 2013. Human T-cell Leukemia virus types 1 and 2, p 1474–1496. In: Fields BN, Knipe DM, Howley PM. Field's virology, vol 2. Philadelphia (PA): Lippincott Williams and Wilkins. [Google Scholar]
- 9.Ghez D, Lepelletier Y, Lambert S, Fourneau JM, Blot V, Janvier S, Arnulf B, van Endert PM, Heveker N, Pique C, Hermine O. 2006. Neuropilin 1 is involved in human T-cell lymphotropic virus type 1 entry. J Virol 80:6844–6854. [DOI] [PMC free article] [PubMed] [Google Scholar]
- 10.Hogenes M, Huibers M, Kroone C, de Weger R. 2014. Humanized mouse models in transplantation research. Transplant Rev (Orlando) 28:103–110. [DOI] [PubMed] [Google Scholar]
- 11.Ijichi S, Ramundo MB, Takahashi H, Hall WW. 1992. In vivo cellular tropism of human T cell leukemia virus type II (HTLVII). J Exp Med 176:293–296. [DOI] [PMC free article] [PubMed] [Google Scholar]
- 12.Ishitsuka K, Tamura K. 2014. Human T-cell leukaemia virus type I and adult T-cell leukaemia–lymphoma. Lancet Oncol 15: e517–e526. [DOI] [PubMed] [Google Scholar]
- 13.Jones KS, Akel S, Petrow-Sadowski C, Huang Y, Bertolette DC, Ruscetti FW. 2005. Induction of human T-cell leukemia virus type I receptors on quiescent naive T lymphocytes by TGFβ. J Immunol 174:4262–4270. [DOI] [PubMed] [Google Scholar]
- 14.Jones KS, Fugo K, Petrow-Sadowski C, Huang Y, Bertolette DC, Lisinski I, Cushman SW, Jacobson S, Ruscetti FW. 2006. Human T-cell leukemia virus type 1 (HTLV1) and HTLV2 use different receptor complexes to enter T cells. J Virol 80:8291–8302. [DOI] [PMC free article] [PubMed] [Google Scholar]
- 15.Kannian P, Yin H, Doueiri R, Lairmore MD, Fernandez S, Green PL. 2012. Distinct transformation tropism exhibited by human T lymphotropic virus type 1 (HTLV1) and HTLV2 is the result of postinfection T-cell clonal expansion. J Virol 86:3757–3766. [DOI] [PMC free article] [PubMed] [Google Scholar]
- 16.Kesic M, Doueiri R, Ward M, Semmes OJ, Green PL. 2009. Phosphorylation regulates human T-cell leukemia virus type 1 Rex function. Retrovirology 6:1–11. [DOI] [PMC free article] [PubMed] [Google Scholar]
- 17.Kinet S, Swainson L, Lavanya M, Mongellaz C, Montel-Hagen A, Craveiro M, Manel N, Battini JL, Sitbon M, Taylor N. 2007. Isolated receptor binding domains of HTLV1 and HTLV2 envelopes bind Glut1 on activated CD4+ and CD8+ T cells. Retrovirology 4:1–9. [DOI] [PMC free article] [PubMed] [Google Scholar]
- 18.Lockridge JL, Zhou Y, Becker YA, Ma S, Kenney SC, Hematti P, Capitini CM, Burlingham WJ, Gendron-Fitzpatrick A, Gumperz JE. 2013. Mice engrafted with human fetal thymic tissue and hematopoietic stem cells develop pathology resembling chronic graft-versus-host disease. Biol Blood Marrow Transplant 19:1310–1322. [DOI] [PMC free article] [PubMed] [Google Scholar]
- 19.MacDonald KP, Hill GR, Blazar BR. 2016. Chronic graft-versus-host disease: biological insights from preclinical and clinical studies. Blood 129:13–21. [DOI] [PMC free article] [PubMed] [Google Scholar]
- 20.Manel N, Kim FJ, Kinet S, Taylor N, Sitbon M, Battini JL. 2003. The ubiquitous glucose transporter GLUT1 is a receptor for HTLV. Cell 115:449–459. [DOI] [PubMed] [Google Scholar]
- 21.Oliveira AL, Hayakawa H, Schor D, Leite AC, Espindola OM, Waters A, Dean J, Doherty DG, Araujo AQ, Hall WW. 2009. High frequencies of functionally competent circulating Tax-specific CD8+ T cells in human T lymphotropic virus type 2 infection. J Immunol 183:2957–2965. [DOI] [PubMed] [Google Scholar]
- 22.Picchio GR, Kobayashi R, Kirven M, Baird SM, Kipps TJ, Mosier DE. 1992. Heterogeneity among Epstein–Barr virus-seropositive donors in the generation of immunoblastic B-cell lymphomas in SCID mice receiving human peripheral blood leukocyte grafts. Cancer Res 52:2468–2477. [PubMed] [Google Scholar]
- 23.Piñon JD, Klasse PJ, Jassal SR, Welson S, Weber J, Brighty DW, Sattentau QJ. 2003. Human T-cell leukemia virus type 1 envelope glycoprotein gp46 interacts with cell-surface heparan sulfate proteoglycans. J Virol 77:9922–9930. [DOI] [PMC free article] [PubMed] [Google Scholar]
- 24.Rowan AG, Bangham CR. 2012. Is there a role for HTLV1-specific CTL in adult T-cell leukemia–lymphoma? Leuk Res Treat 2012:1–7. [DOI] [PMC free article] [PubMed] [Google Scholar]
- 25.Schroeder MA, DiPersio JF. 2011. Mouse models of graft-versus-host disease: advances and limitations. Dis Model Mech 4: 318–333. [DOI] [PMC free article] [PubMed] [Google Scholar]
- 26.Sonntag K, Eckert F, Welker C, Muller H, Muller F, Zips D, Sipos B, Klein R, Blank G, Feuchtinger T, Schumm M, Handgretinger R, Schilbach K. 2015. Chronic graft-versus-host-disease in CD34+/-humanized NSG mice is associated with human susceptibility HLA haplotypes for autoimmune disease. J Autoimmun 62:55–66. [DOI] [PubMed] [Google Scholar]
- 27.Tezuka K, Xun R, Tei M, Ueno T, Tanaka M, Takenouchi N, Fujisawa J. 2013. An animal model of adult T-cell leukemia: humanized mice with HTLV1-specific immunity. Blood 123:346–355. [DOI] [PubMed] [Google Scholar]
- 28.Tsukasaki K, Imaizumi Y, Tawara M, Fujimoto T, Fukushima T, Hata T, Maeda T, Yamada Y, Kamihira S, Tomonaga M. 1999. Diversity of leukaemic cell morphology in ATL correlates with prognostic factors, aberrant immunophenotype and defective HTLV1 genotype. Br J Haematol 105:369–375. [DOI] [PubMed] [Google Scholar]
- 29.Villaudy J, Wencker M, Gadot N, Gillet NA, Scoazec JY, Gazzolo L, Manz MG, Bangham CR, Dodon MD. 2011. HTLV1 propels thymic human T cell development in ‘human immune system’ Rag2–/– γ c–/– mice. PLoS Pathog 7:1–12. [DOI] [PMC free article] [PubMed] [Google Scholar]
- 30.Wang TG, Ye J, Lairmore MD, Green PL. 2000. In vitro cellular tropism of human T-cell leukemia virus type 2. AIDS Res Hum Retroviruses 16:1661–1668. [DOI] [PubMed] [Google Scholar]
- 31.Xie L, Green PL. 2005. Envelope is a major viral determinant of the distinct in vitro cellular transformation tropism of human T-cell leukemia virus type 1 (HTLV1) and HTLV2. J Virol 79: 14536–14545. [DOI] [PMC free article] [PubMed] [Google Scholar]
- 32.Yamano Y, Nagai M, Brennan M, Mora CA, Soldan SS, Tomaru U, Takenouchi N, Izumo S, Osame M, Jacobson S. 2002. Correlation of human T-cell lymphotropic virus type 1 (HTLV1) mRNA with proviral DNA load, virus-specific CD8+ T cells, and disease severity in HTLV1–associated myelopathy (HAM/TSP). Blood 99:88–94. [DOI] [PubMed] [Google Scholar]
- 33.Yamamoto N, Okada M, Koyanagi Y, Kannagi M, Hinuma Y. 1982. Transformation of human leukocytes by cocultivation with an adult T-cell leukemia virus producer cell line. Science 217:737–739. [DOI] [PubMed] [Google Scholar]
- 34.Ye J, Xie L, Green PL. 2003. Tax and overlapping Rex sequences do not confer the distinct transformation tropisms of human T-cell leukemia virus types 1 and 2. J Virol 77:7728–7735. [DOI] [PMC free article] [PubMed] [Google Scholar]
- 35.Yin H, Kannian P, Dissinger N, Haines R, Niewiesk S, Green PL. 2012. Human T-cell leukemia virus type 2 antisense viral protein 2 is dispensable for in vitro immortalization but functions to repress early virus replication in vivo. J Virol 86:8412–8421. [DOI] [PMC free article] [PubMed] [Google Scholar]


