

Abstract
Nuclear factor‐kappa B (NF‐κB) as a prognostic marker remains unclear in non‐small cell lung cancer (NSCLC). Here, we studied NF‐κB‐p65 (p65) expression and phosphorylated NF‐κB‐p105 (p‐p105) expression in NSCLC and correlated the finding with overall survival (OS) and clinicopathological features. A total of 186 archival samples from patients with surgically resectable NSCLC were probed with p65 and p‐p105 (Ser 932). The p65‐positive expression and p‐p105‐positive expression were defined as distinct nuclear p65 and cytoplasmic p‐p105 labelling in at least 1% of tumour cells, respectively. The positive staining of p65 alone, p‐p105 alone and co‐expression of p65 and p‐p105 were observed in 61 (32.8%), 90 (48.4%) and 35 (18.8%) patients, respectively. Co‐expression of p65 and p‐p105 but not of either p65 or p‐p105 alone was associated with a poor prognosis. Patients with co‐expression of p65 and p‐p105 had a shorter OS than others, median OS 26.5 months versus 64.1 months, HR 1.85 (95% CI: 1.18–2.91), P = 0.007. There was no statistically significant association between clinicopathological characteristics and either p65 or p‐p105 alone or co‐expression of p65 and p‐p105. This indicates that co‐expression of p65 and p‐p105 was a poor prognostic factor, and pathologic studies of NF‐κB expression could include multiple pathway components in NSCLC.
Keywords: non‐small cell lung cancer, nuclear factor‐kappa b, p65, p105, prognosis
Introduction
Nuclear factor‐kappa B (NF‐κB) was initially discovered as a transcription factor in the nucleus of B cells that binds to the enhancer of the immunoglobulin kappa light chain gene, and has since been shown to be expressed ubiquitously in the cytoplasm of all types of cells. NF‐κB transcription complexes form a variety of homo‐ and heterodimers consisting of the subunits NF‐κB1 (p50 and its precursor p105), NF‐κB2 (p52 and its precursor p100), RelA (p65), RelB and c‐Rel. Through various combinations of subunits, the Rel protein family members can form up to 15 different dimers. Among them, the p50/65 heterodimer is the most abundant of Rel dimer, being found in almost all cell types 1, 2.
The NF‐κB signalling pathways can be divided into canonical and non‐canonical pathways. In the canonical pathway, I kappa B kinase (IKK) phosphorylates I kappa Bα (IκBα) at two N‐terminal serines, triggering its ubiquitination and proteasomal degradation. This leads to the nuclear translocation of the NF‐κB complexes, predominantly p50/p65 and p50/c‐Rel dimers. The non‐canonical NF‐κB pathway involves different signalling molecules and leads to the activation of the p52/RelB dimer 1, 2.
A large body of in vitro evidence supports NF‐κB as an important player in the development and progression of malignant cancers. NF‐κB targets genes that promote tumour cell proliferation, survival, metastasis, inflammation, invasion, angiogenesis and resistance to chemo‐ and radiotherapy 2. Constitutive or aberrant activation of NF‐κB is frequently encountered in lung cancer 3, 4, 5. However, a limited number of clinical studies had reported various degree of NF‐κB expression detected by IHC in lung cancers ranging from about 10% to 67%, reviewed by Wu 6. The same series of studies have correlated NF‐κB expression with clinicopathological characteristics and survival, but the results have been inconsistent. In addition, in most studies, pathologic studies of NF‐κB expression were detected by assaying for single components of the NF‐κB pathway, and using different anti‐NF‐κB subunit antibody clones, judgement criteria and cut‐off values for assessing NF‐κB expression were used in the various studies 6, 7, 8, 9, 10, 11, 12, 13, 14, 15. Actually, different NF‐κB dimers may have different functions, especially the p50‐p50 homodimer, which lacks a transactivation domain in the C‐termini and has no intrinsic ability to activate transcription. There is evidence that the p50‐p50 homodimer can act as a transcriptional repressor when binding κB elements 1, 16, 17, 18.
To address the above issues, we investigated the expression of p65 and p‐p105 in patients with surgically resectable NSCLC and the association between clinicopathological characteristics, overall survival and the expression of p65 and p‐p105.
Patients and methods
Patients
Primary tumour samples were from archives of patients with surgically resectable and pathological confirmed NSCLC at the Fujian Cancer Hospital in China between January 2008 and December 2010. None of the patient had prior anticancer therapies. The clinicopathological information of patients was collected from the clinical records and pathology reports. The pathological TNM stage was reassigned according to the 8th TNM staging 19, and lung tumour histology was reclassified according to the 2015 World Health Organization (WHO) classification for lung tumours 20. The study design was approved by the Ethical Committee of Fujian Cancer Hospital, and written informed consent was obtained from all patients (Number: SQ2017‐015‐01).
NF‐κB‐p65 and p‐p105 immunohistochemistry
Immunohistochemistry detection of NF‐κB‐p65 (D14E12, Code #8242, CST) and p‐NF‐κB‐p105 (Rabbit monoclonal against Ser933, Code 178F3, CST) was carried out as previously described 21, 22. NF‐κB‐p65 activation in tumour cells was determined by distinct nuclear immunostaining in at least 1% of tumour cells. NF‐κB‐p105 activation in tumour cells was defined by distinct membranous or cytoplasmic immunostaining in at least 1% of tumour cells. Each assay contained positive and negative controls along with a negative isotype‐matched antibody control for each sample. Two board‐certified pathologists (CL and DH) independently evaluated all stained slides. The discordant cases were reviewed to reach a final consensus classification.
Statistical analysis
Expression of p65, p‐p105 and co‐expression of p65 and p‐p105 were compared in subgroups based on age, gender, smoking status, histology, TNM stage or lymphatic vascular invasion using the binary logistic analysis. Adjustments were made for above‐mentioned factors in multivariate binary logistic analysis.
Overall survival (OS) was defined as the time from the date of diagnosis to the date of death or last follow‐up. The Kaplan–Meier method and a log‐rank test were used for univariate survival analysis. Survival rate correlation with age, gender, smoking status, histology, TNM stage, p65 expression, p‐p105 expression and co‐expression of p65 and p‐p105 was estimated by the Kaplan–Meier method, and survival curves were compared with the log‐rank test. Cox proportional hazard models were used for multivariate survival analysis that controlled for the above factors in the univariate survival analysis, and the hazard ratio (HR) and 95% confidence interval (CI) were estimated.
Statistical analyses were performed using SPSS 16.0 software (SPSS China, China). All tests were two‐sided. Statistical significance was set at P < 0.05.
Results
Patient characteristics
A total of 186 patients were eligible for the study, and their characteristics were summarized in Table 1. Median age at diagnosis was 55 years (range, 34–78 years), and the ECOG performance status was 0 in all patients. Adenocarcinoma and squamous carcinoma were the major histologic subtypes, accounting for 97 of 186 (55.3%) and 75 of 186 (40.3%), respectively. In this study, we also collected 11 adenosquamous carcinoma and other uncommon pathological types including one sarcomatoid carcinoma, one mucoepidermoid cancer and one lymphoepithelioma‐like cancer (Table 1).
Table 1.
Association between p65 expression, p‐p105 expression and clinicopathological characteristics
| Total N (%) | p65 | P | p‐p105 | P | Co‐expression of p65 + p‐p105 | P | ||||
|---|---|---|---|---|---|---|---|---|---|---|
| Negative (%) | Positive (%) | Negative (%) | Positive (%) | Negative (%) | Positive (%) | |||||
| Age | ||||||||||
| >60 years | 78 (41.9) | 57 (45.6) | 21 (34.4) | 0.158 | 38 (39.6 | 40 (44.4) | 0.502 | 68 (45.0) | 10 (28.6) | 0.075 |
| ≤60 years | 108 (58.1) | 68 (54.4) | 40 (65.6) | 58 (60.4) | 50 (55.6) | 83 (55.0) | 25 (71.4) | |||
| Sex | ||||||||||
| Male | 130 (69.9) | 82 (65.6) | 48 (78.7) | 0.088 | 65 (67.7) | 65 (72.2) | 0.526 | 103 (68.2) | 27 (77.1) | 0.318 |
| Female | 56 (30.1) | 43 (34.4) | 13 (21.3) | 31 (32.3) | 25 (27.8) | 48 (31.8) | 8 (22.9) | |||
| Smoking | ||||||||||
| Never smokers | 105 (56.5) | 73 (58.4) | 32 (52.5) | 0.529 | 53 (55.2) | 52 (57.8) | 0.768 | 86 (57.0) | 19 (54.3) | 0.851 |
| Former or current smokers | 81 (43.5) | 52 (41.6) | 29 (47.5) | 43 (44.8) | 38 (42.2) | 65 (43.0) | 16 (45.7) | |||
| Histology | ||||||||||
| Ad | 97 (52.2) | 65 (52.0) | 32 (52.5) | 1.000 | 52 (54.2) | 45 (50.0) | 0.660 | 79 (52.3) | 18 (51.4) | 1.000 |
| Non‐Ad | 89 (47.8) | 60 (48.0) | 29 (47.5) | 44 (45.8) | 45 (50.0) | 72 (47.7) | 17 (48.6) | |||
| Lymphatic vascular invasion | ||||||||||
| Absence | 164 (88.2) | 113 (90.4) | 51 (83.6) | 0.226 | 86 (89.6) | 78 (86.7) | 0.538 | 136 (90.1) | 28 (80.0) | 0.141 |
| Presence | 22 (11.8) | 12 (9.6) | 10 (16.4) | 10 (10.4) | 12 (13.3) | 15 (9.9) | 7 (20.0) | |||
| TNM stage | ||||||||||
| I | 54 (29.0) | 38 (30.4) | 16 (26.2) | 0.723 | 29 (30.2) | 25 (27.8) | 0.454 | 45 (29.8) | 9 (25.7) | 0.567 |
| II | 40 (21.5) | 25 (20.0) | 15 (24.6) | 17 (17.7) | 23 (25.6) | 30 (19.9) | 10 (28.6) | |||
| III | 92 (49.5) | 62 (49.6) | 30 (49.2) | 50 (52.1) | 42 (46.7) | 76 (50.3) | 16 (45.7) | |||
The p65 expression and p‐p105 expression and correlation with clinicopathological characteristics
We first examined p65 expression and p‐p105 expression in normal lung areas adjacent to surgically resected tumour samples. In bronchial and alveolar epithelium, p65 exhibited low or moderate cytoplasmic expression. In tumours, both of p65 and p‐p105 subunits were highly expressed relative to normal areas. The p65 displayed both a nuclear and cytoplasmic expression patterns in areas of tumour cells. However, p‐p105 nuclear immunostaining was seldom observed (only in three patients) in tumour areas. In addition, p‐p105 expression showed more uniform distribution than p65 expression, which was dispersed within the tumour area in some cases. Representative images of p65 and p‐p105 IHC staining are shown in Figure 1. Furthermore, in our study, there was no linear relationship between p65 expression and p‐p50 expression in tumour cells, and p65 expression and p‐p50 expression were highly discordant in some cases and show a near mutual exclusion (Fig. 2).
Figure 1.
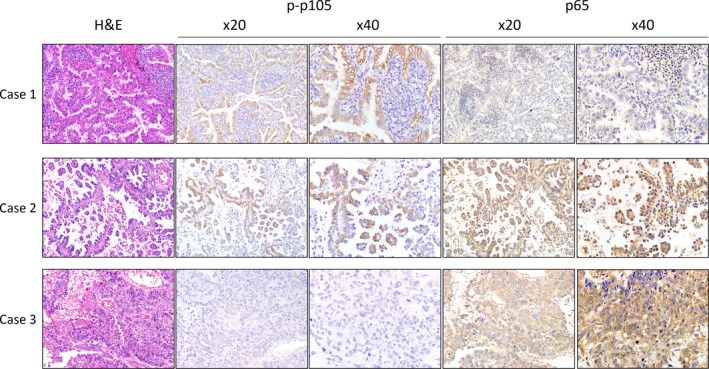
Immunohistochemical staining for p65 and p‐p105 in representative tissue specimens. Case 1 represented positive p‐p105 and negative nuclear p65. Case 2 represented positive p‐p105 and positive nuclear p65. Case 3 represented negative p‐p105, and negative nuclear but positive cytoplasmic p65.
Figure 2.
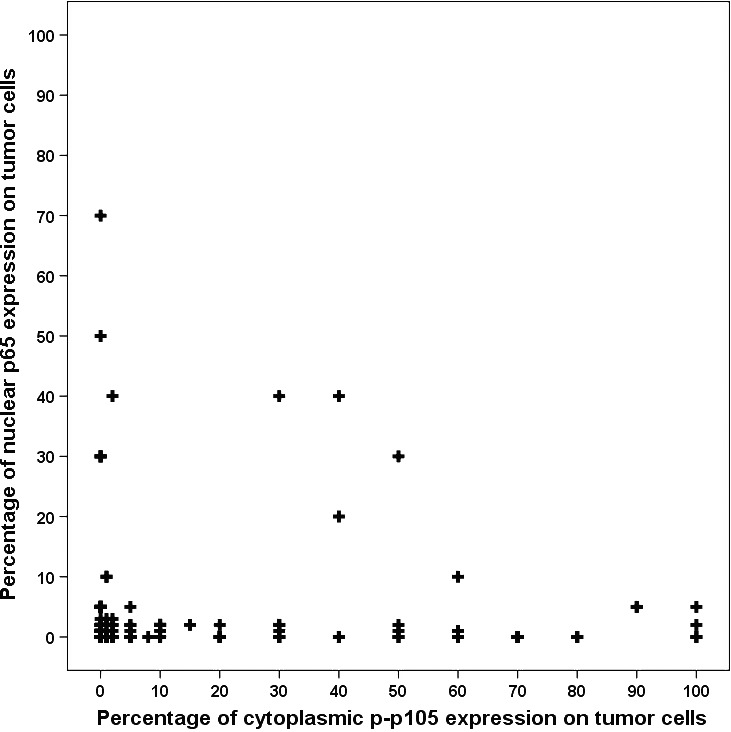
Scatter plot did not reveal a linear relationship between p65 expression and p‐p105 expression.
The p65‐positive staining and p‐p105‐positive staining were observed in 61 of 186 (32.8%) and 90 of 186 (48.4%) of the patients’ tumours, respectively. In the present study, we found 35 (18.8%) tumours with co‐expression of p65 and p‐p105, 26 (14.0%) with p65‐positive expression alone, 55 (29.6%) with p‐p105‐positive expression alone and 70 (37.6%) that were both p65 negative and p‐p105 negative in this population.
The co‐expression of p65 and p‐p105 or the expression of either p65 or p‐p105 alone was correlated with the clinicopathological characteristics by univariate analysis (Table 1). There was no statistically significant association between co‐expression of p65 and p‐p105 or p65/p‐p105 alone and gender, age, smoking status, histology, lymphatic vascular invasion and TNM stage in the univariate analysis (Table 1).
Prognostic value of p65 expression and p‐p105 expression
Survival data in this study were censored on 07 January 2017. The median follow‐up time was 48.9 months (m) (range: 1.1–104.5 m), and 104 patients had cancer‐related death.
The unadjusted survival curves show a statistically significant association between TNM stage, lymphatic vascular invasion, co‐expression of p65 and p‐p105 and survival. Patients with co‐expression of p65 and p‐p105 had a shorter OS than others, median OS 26.5 months (95% CI: 6.15–46.9) versus 64.1 months (95% CI: 57.7–70.6), HR 1.85 (95% CI: 1.18–2.91), P = 0.007 (Fig. 3, Table 2). However, neither expression of p65 alone nor expression of p‐p105 alone was an independent prognostic factor.
Figure 3.
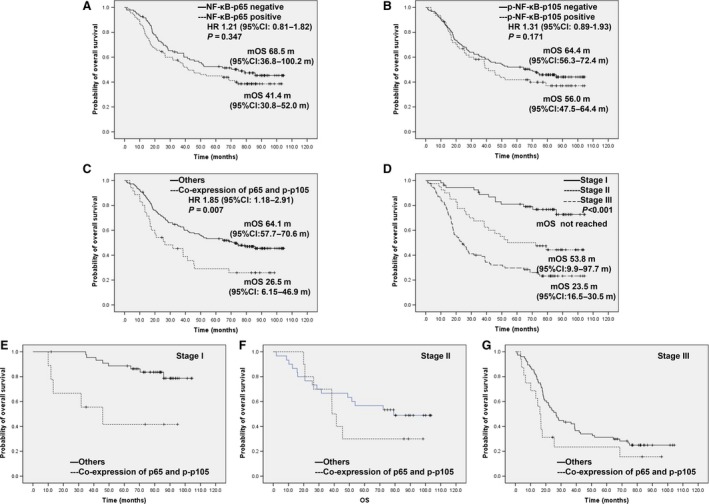
Prognostic value of p65, p‐p105 and co‐expression of them in the univariate survival analysis. (A) for p65 expression and OS. (B) for p‐p105 and OS. (C) for co‐expression of p65 and p‐p105 and OS. (D) for TNM stage and OS. (E) for co‐expression of p65 and p‐p105 in patients with Stage I and OS. (F) for co‐expression of p65 and p‐p105 in patients with Stage II and OS. (G) for co‐expression of p65 and p‐p105 in patients with Stage III and OS.
Table 2.
Univariate and multivariate analyses of OS in all patients
| Variables | Reference | Univariate analyses | Multivariate analyses | ||
|---|---|---|---|---|---|
| HR(95% CI) | P value | HR(95% CI) | P value | ||
| Gender | Male | 0.90 (0.59–1.38) | 0.629 | ||
| Age | ≤60 years | 1.28 (0.87–1.88) | 0.212 | 1.59 (1.06–2.38) | 0.025 |
| Histology | Squamous | 0.84 (0.57–1.23) | 0.373 | ||
| Smoking status | Never smokers | 1.28 (0.87–1.88) | 0.210 | 1.69 (1.13–2.53) | 0.001 |
| Lymphatic vascular invasion | Absence | 2.71 (1.62–4.54) | <0.001 | 1.99 (1.17–3.38) | 0.011 |
| TNM stage | I (reference) | <0.001 | <0.001 | ||
| II | 2.75 (1.38–5.46) | 0.004 | 2.26 (1.12–4.57) | 0.023 | |
| III | 5.53 (3.05–10.05) | <0.001 | 5.84 (3.18–10.71) | <0.001 | |
| p65 expression | Negative | 1.21 (0.81–1.82) | 0.347 | ||
| p‐p105 expression | Negative | 1.31 (0.89–1.93) | 0.171 | ||
| Co‐expression of p65 and p‐p105 | Negative | 1.85 (1.18–2.91) | 0.007 | 2.31 (1.42–3.75) | 0.001 |
CI, confidence interval. The bold values represented statistical significance (P < 0.05).
Setting TNM stage as a stratification factor (Stage I versus Stage II versus Stage III), co‐expression of p65 and p‐p105 was still associated with overall survival in the population, P = 0.003 (Fig. 3E–G). In the multivariate Cox regression analysis, tumour stage, co‐expression of p65 and p‐p105, age, smoking status and lymphatic vascular invasion were shown to be significantly associated with OS after controlling for covariates (Table 2).
Discussion
In the NF‐κB pathway, the p50/65 heterodimer obviously represents the most abundant of Rel dimmers. In this study, we studied expression of p65 and p‐p105 (precursor p50) in 186 patients with resectable NSCLC and found that co‐expression of p65 and p‐p105 but not p65 or p‐p105 alone was an independent prognosis biomarker. To our knowledge, this is the first attempt to link both p65 and p‐p105 with the outcome of NSCLC patients.
We noticed that some clinical studies reporting NF‐κB expression detected by IHC that they correlated with clinicopathological characteristics and/or survival in lung cancers had conflicting results; summarized in Table 3 7, 8, 9, 10, 11, 12, 13, 14, 15. The Rel protein family members can form up to 15 different dimers through combinatorial associations, and various antibodies for different key NF‐κB pathway components, such as p65, p105, IκBα and IKKα/β, were used for the evaluation of NF‐κB expression in the different studies 6. One of interpretation of discrepancy between study results could be different NF‐κB subunit antibodies and judgement criteria when comparing the experimental positives used in the different studies.
Table 3.
Summary of studies investigating NF‐κB expression in NSCLC
| Reference | Country | N | Marker | NF‐κB (+)% | Antibody | Cut‐off | Clinicopathological variables | Prognosis |
|---|---|---|---|---|---|---|---|---|
| Zhang et al.15 | China | 45 | p50‐N/C | 67.6 | NR | ≥10% tumour cells | Lower degree of differentiation; | Shorter OS |
| Qin et al. 7 | China | 115 | RelB‐N/C | 52.0 | NR | >70% moderate staining or >10% strong staining | Lower degree of differentiation; Advanced TNM stage | Shorter OS |
| Tang et al. 12 | USA | 370 | p65‐N | 56.6 | NR | ≥50% tumour cells | Advanced TNM stage; KRAS/EGFR mutation | NS |
| Zhang et al. 11 | China | 116 | p65‐N | 48.3 | NR | >5% tumour cells | Advanced TNM stage | NS |
| p‐IκBα‐N/C | 32.8 | NR | >5% tumour cells | Adenocarcinoma; | NS | |||
| p65 + p‐IκBα | 18.1 | Advanced TNM stage; Adenocarcinoma; Smoking status≥ 27 pack‐years | Shorter OS | |||||
| Jin et al. 10 | China | 88 | p65‐N | 46.6 | sc109 | >5% tumour cells | Age≥55.1 year; Smoker; Advanced TNM stage; | Shorter OS |
| p‐IκBα‐C | 30.7 | sc‐8404 | >5% tumour cells | Adenocarcinomas; Advanced T stage; | Shorter OS | |||
| p65 + p‐IκBα | 18.1 | Adenocarcinomas; Smoker; Advanced TNM stage; Advanced T stage; | Shorter OS | |||||
| p‐IKKα/β‐C | 30.7 | #2697S | >5% tumour cells | NS | NS | |||
| Al‐Saad et al. 14 | Norway | 335 | p‐p105‐C | 10.0 | 178F3 | Scored by intensity ≥2 | NS | Longer DSS |
| Zhang et al. 13 | China | 106 | p65‐N/C | 45.3 | NR | ≥10% tumour cells | Non‐squamous cancers; Node metastasis; Lower degree of differentiation; | NA |
| Nair et al. 9 | USA | 355 | p65‐C | 57.19 | D14E12 | >20% tumour cells | Increasing FDG uptake levels; Non‐adenocarcinomas; Advanced TNM stage | NS |
| GiopanouI et al. 8 | German | 79 | p65‐N/C | 31.6 | sc‐8008 | Scored by the intensity and distribution: low, intermediate and high | Men; Age ≥60 year; Squamous cancers | NA |
| RelB‐N/C | 13.9 | sc‐226 | Nodal involvement | |||||
| p50‐N/C | 38.0 | sc‐114 | Poor differentiation; Advanced TNM stage | |||||
| p100/52‐N/C | 36.7 | ab31409 | Advanced TNM stage |
N, nuclear expression; C, cytoplasmic expression; NR, not report; NS, not significant; NA, not available; OS, overall survival; DSS, disease‐specific survival.
Of those NF‐κB pathway components, p65 has been the most studied in the field of lung cancer. Recently, a systematic review showed that expression of NF‐κB, which was mainly focused on p65, was associated with worse survival in most solid tumours 6. However, two large studies found that p65 expression was not associated with overall survival in NSCLC irrespective of NF‐κB localization, which is consistent with our finding 9, 12. From a mechanistic perspective, nuclear expression is considered an active marker of NF‐κB, whereas cytoplasmic localization of NF‐κB is generally thought to indicate inactivation of the pathway. However, the situation is actually more complex. The crystal structure of IκBα when bound to the p65/p50 heterodimer reveals that the IκBα protein masks only the nuclear localization sequence (NLS) of p65, whereas the NLS of p50 remains exposed. The exposed NLS of p50 coupled with the nuclear export sequences in IκBα and p65 leads to constant shuttling of IκBα/NF‐κB complexes between the nucleus and the cytoplasm, despite steady‐state localization that appears almost exclusively cytosolic 1. Therefore, it is not completely reliable to justify NF‐κB pathway activation only by nuclear p65 expression.
There have been studies that attempted to evaluate the prognostic value of p105/p50 in NSCLC. A study, with a small sample size, found overexpression of p50 to indicate an unfavourable overall survival 15. However, in a study that included 335 patients with NSCLC, Al‐Saad et al. 14 found that p‐p105 expression, detected by assaying for p‐p105 (Ser933) (CST 178F3, Rabbit mAb), was a favourable independent prognostic indicators for survival. The IκB/NF‐κB precursor protein p105 undergoes processing via the proteasome to yield p50. Multiple reports have demonstrated that IKKβ‐dependent phosphorylation of the C‐terminal region of p105 at Ser933 (in human p105) leads to complete degradation of the protein 1, 17. In this study, we used the same antibody assay as the Al‐Saad study; however, our study did not confirm the above finding. Actually, the p50 proteins, which lack a transactivation domain in the C‐termini, have no intrinsic ability to activate transcription, and evidence showed that the p50‐p50 homodimer can act as transcriptional repressors when binding κB elements 1, 16, 17, 18. Therefore, it may also be unable to safely justify activate transcription by active p50 overexpression alone.
Taken together, the above findings strongly suggest pathologic studies of NF‐κB expression in NSCLC may need to include multiple pathway components. In this study, we found that co‐expression of p65 and p‐p105 but not p65 or p‐p105 alone was confirmed to be associated with a poor prognosis. Similar results were obtained in other studies. Two separate studies showed that composite application of multiple biomarkers (both nuclear p65 expression and p‐IκB‐α expression) independently predicts poorer prognosis in NSCLC patients 10, 11. Strikingly, co‐expression of p65 and p‐p105 was a strong predictor of overall survival, particularly in stage I, despite the limitation in the small number of patients with co‐expression of p65 and p‐p105. A prospective study in a larger population that will include early‐stage patients will be carried out in the future.
In conclusion, our study showed co‐expression of p65 and p‐p105 but not p65 or p‐p105 alone was a poor prognostic indicator of survival outcome in early‐stage NSCLC, which indicated pathologic studies of NF‐κB expression in NSCLC may need to include multiple pathway components.
Conflict of interest
The authors confirm that there are no conflict of interests.
Acknowledgements
This work was supported by the National Natural Science Foundation of China (grant number 81372599, to G. Lin); the Fujian Provincial Health and Family Research Talent Training Program (grant number 2015‐ZQN‐ZD‐9, to G. Lin); Natural Science Foundation of Fujian province (grant number 2015J01434, to C. Li); and the National Clinical Key Specialty Construction Program of China (2014).
Gen Lin and Chao Li contributed equally to this study.
References
- 1. Hayden MS, Ghosh S. Shared principles in NF‐kappaB signaling. Cell. 2008; 132: 344–62. [DOI] [PubMed] [Google Scholar]
- 2. Park MH, Hong JT. Roles of NF‐kappaB in cancer and inflammatory diseases and their therapeutic approaches. Cells. 2016; 5: 10–3390. [DOI] [PMC free article] [PubMed] [Google Scholar]
- 3. Alvira CM. Nuclear factor‐kappa‐B signaling in lung development and disease: one pathway, numerous functions. Birth Defects Res A. 2014; 100: 202–16. [DOI] [PMC free article] [PubMed] [Google Scholar]
- 4. Zaynagetdinov R, Stathopoulos GT, Sherrill TP, et al Epithelial nuclear factor‐κB signaling promotes lung carcinogenesis via recruitment of regulatory T lymphocytes. Oncogene. 2011; 31: 3164–76. [DOI] [PMC free article] [PubMed] [Google Scholar]
- 5. Basseres DS, Ebbs A, Levantini E, et al Requirement of the NF‐κB subunit p65/RelA for K‐Ras‐induced lung tumorigenesis. Cancer Res. 2010; 70: 3537–46. [DOI] [PMC free article] [PubMed] [Google Scholar]
- 6. Wu D, Wu P, Zhao L, et al NF‐κB expression and outcomes in solid tumors. Medicine. 2015; 94: e1687. [DOI] [PMC free article] [PubMed] [Google Scholar]
- 7. Qin H, Zhou J, Zhou P, et al Prognostic significance of RelB overexpression in non‐small cell lung cancer patients. Thorac Cancer. 2016; 7: 415–21. [DOI] [PMC free article] [PubMed] [Google Scholar]
- 8. Giopanou I, Lilis I, Papaleonidopoulos V, et al Comprehensive evaluation of nuclear factor‐κΒ expression patterns in non‐small cell lung cancer. PLoS ONE. 2015; 10: e132527. [DOI] [PMC free article] [PubMed] [Google Scholar]
- 9. Nair VS, Gevaert O, Davidzon G, et al NF‐κB protein expression associates with 18F‐FDG PET tumor uptake in non‐small cell lung cancer: a radiogenomics validation study to understand tumor metabolism. Lung Cancer. 2014; 83: 189–96. [DOI] [PMC free article] [PubMed] [Google Scholar]
- 10. Jin X, Wang Z, Qiu L, et al Potential biomarkers involving IKK/RelA signal in early stage non‐small cell lung cancer. Cancer Sci. 2008; 99: 582–9. [DOI] [PMC free article] [PubMed] [Google Scholar]
- 11. Zhang D, Jin X, Wang F, et al Combined prognostic value of both RelA and IκB‐α expression in human non‐small cell lung cancer. Ann Surg Oncol. 2007; 14: 3581–92. [DOI] [PubMed] [Google Scholar]
- 12. Tang X, Liu D, Shishodia S, et al Nuclear factor‐κB (nf‐κB) is frequently expressed in lung cancer and preneoplastic lesions. Cancer. 2006; 107: 2637–46. [DOI] [PubMed] [Google Scholar]
- 13. Zhang X, Wang H, Wang J. Expression of HMGB1 and NF‐kappaB p65 and its significance in non‐small cell lung cancer. Contemp Oncol (Pozn). 2013; 17: 350–5. [DOI] [PMC free article] [PubMed] [Google Scholar]
- 14. Al‐Saad S, Al‐Shibli K, Donnem T, et al The prognostic impact of NF‐kappaB p105, vimentin, E‐cadherin and Par6 expression in epithelial and stromal compartment in non‐small‐cell lung cancer. Br J Cancer. 2008; 99: 1476–83. [DOI] [PMC free article] [PubMed] [Google Scholar]
- 15. Zhang Z, Ma J, Li N, et al Expression of nuclear factor‐kappaB and its clinical significance in nonsmall‐cell lung cancer. Ann Thorac Surg. 2006; 82: 243–8. [DOI] [PubMed] [Google Scholar]
- 16. Kravtsova‐Ivantsiv Y, Shomer I, Cohen‐Kaplan V, et al KPC1‐mediated ubiquitination and proteasomal processing of NF‐κB1 p105 to p50 restricts tumor growth. Cell. 2015; 161: 333–47. [DOI] [PubMed] [Google Scholar]
- 17. Park MH, Hong JT. Roles of NF‐kappaB in cancer and inflammatory diseases and their therapeutic approaches. Cells. 2016; 5: e15. [DOI] [PMC free article] [PubMed] [Google Scholar]
- 18. Saccani A, Schioppa T, Porta C, et al p50 Nuclear factor‐B overexpression in tumor‐associated macrophages inhibits M1 inflammatory responses and antitumor resistance. Cancer Res. 2006; 66: 11432–40. [DOI] [PubMed] [Google Scholar]
- 19. Detterbeck FC, Chansky K, Groome P, et al The IASLC Lung Cancer Staging Project: methodology and validation used in the development of proposals for revision of the stage classification of NSCLC in the forthcoming (eighth) edition of the TNM classification of lung cancer. J Thorac Oncol. 2016; 11: 1433–46. [DOI] [PubMed] [Google Scholar]
- 20. Travis WD, Brambilla E, Nicholson AG, et al The 2015 World Health Organization classification of lung tumors: impact of genetic, clinical and radiologic advances since the 2004 classification. J Thorac Oncol. 2015; 10: 1243–60. [DOI] [PubMed] [Google Scholar]
- 21. Lin G, Zheng XW, Li C, et al KRAS mutation and NF‐kappaB activation indicates tolerance of chemotherapy and poor prognosis in colorectal cancer. Dig Dis Sci. 2012; 57: 2325–33. [DOI] [PubMed] [Google Scholar]
- 22. Lin G, Tang Z, Ye YB, et al NF‐kappaB activity is downregulated by KRAS knockdown in SW620 cells via the RAS‐ERK‐IkappaBalpha pathway. Oncol Rep. 2012; 27: 1527–34. [DOI] [PubMed] [Google Scholar]