

SUMMARY
Stem cells are critical for the maintenance of many tissues, but whether their integrity is maintained in the face of immunity is unclear. Here we found that cycling epithelial stem cells, including Lgr5+ intestinal stem cells, as well as ovary and mammary stem cells, were eliminated by activated T cells, but quiescent stem cells in the hair follicle and muscle were resistant to T cell killing. Immune evasion was an intrinsic property of the quiescent stem cells resulting from systemic downregulation of the antigen presentation machinery, including MHC class I and Tap proteins, and is mediated by the transactivator Nlrc5. This process was reversed upon stem cell entry into the cell cycle. These studies identify a link between stem cell quiescence, antigen presentation, and immune evasion. As cancer-initiating cells can derive from stem cells, these findings may help explain how the earliest cancer cells evade immune surveillance.
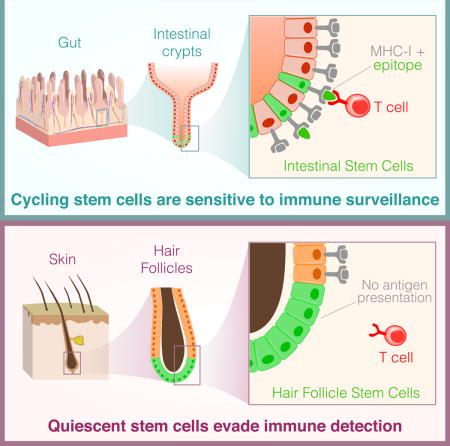
Graphical abstract
INTRODUCTION
Adult stem cells are essential for the homeostasis and repair of many different tissues (Blanpain and Fuchs, 2014). For example hematopoietic stem and progenitor cells continuously give rise to new blood cells, and epithelial stem cells replace their differentiated progeny that turnover at barrier interfaces, such as the gut (Barker, 2014). There is a long-standing interest in understanding the immunogenicity of stem cells (Chidgey and Boyd, 2008; Tang et al., 2013; Wood et al., 2016). This is because of their unique capacity to re-grow replacement tissues for transplantation, which would potentially be subject to immune rejection. In addition, a significant and unanswered question in autoimmune disease is whether the stem cells of a tissue are irrevocably destroyed during immune attack, which would make it impossible for proper tissue repair upon resolution of immunity, or whether stem cells are somehow spared through mechanisms evolved to protect these critical cells. Understanding the interaction between T cells and stem cells is also relevant to bone marrow transplant and adoptive T cell therapy, in which large numbers of allo-reactive or antigen-specific T cells are transferred into a patient, and infiltrate different tissues (Rosenberg and Restifo, 2015). Answering these questions is important for regenerative medicine, as well as immune oncology.
Most stem cell populations are present at low frequency and may express some genes that are not centrally tolerized because they are not expressed in the thymus. Moreover, the self-renewing capacity of stem cells means they are very long-lived, and can accumulate mutations over time, which would give rise to neo-antigens (Blokzijl et al., 2016; Jan et al., 2012; Mandal et al., 2011). The presence of these antigens makes stem cells potential targets of T cells. Since epithelial stem cells give rise to cells at barrier surfaces, and they themselves are present at or near these surfaces where infections often occur, this exposes these rare but important cells to immune responses. However, very little is known about the immune surveillance of adult tissue stem cells.
There has been study of T cell interactions with embryonic stem cells (ESCs) and mesenchymal stem cells (MSCs). ESCs were thought to be immune privileged, but subsequent studies indicated ESCs can be eliminated by an adaptive immune response (Chidgey and Boyd, 2008; Swijnenburg et al., 2008; Wu et al., 2008), and MSCs appear to be immune modulatory rather than immune privileged, as they are rejected in major histocompatibility complex (MHC) mismatched hosts (Ankrum et al., 2014). One reason why so little is known about the interaction between the immune system and tissue stem cells is because there is no experimental system in which a defined stem cell population expresses a model antigen. Thus, almost all studies to date on the immunogenicity of stem cells have used allogeneic transplant models. This confounds interpretation of the results because the T cells are reacting with many different antigens and cell types, including cells differentiating from the stem cells. Moreover, the stem cells have been manipulated ex vivo, and the T cells do not interact with the stem cells in their niche. The latter is particularly relevant for assessing physiological outcomes of T cell and stem cell interactions, especially as we increasingly appreciate that stem cell biology can be altered when stem cells are removed from their tissue of residency (Busch and Rodewald, 2016; Quarta et al., 2016). As such, the immunogenicity of stem cells remains poorly defined and controversial.
Here we set out to determine the outcome of T cell interactions with adult tissue stem cells in their niche. To do so, we utilized the Jedi model (Agudo et al., 2015), which enabled study of antigen-dependent interactions between T cells and tissue stem cells. We showed that immune privilege is not a general property of adult stem cells. Instead, our studies revealed that fast cycling epithelial stem cells, such as those in the gut and ovary were subjected to immune clearance, but that slow cycling stem cells, such as hair follicle stem cells and satellite cells, escaped immune detection. This escape is due to systematic downregulation of the antigen presentation machinery; making the stem cells virtually invisible to the adaptive immune system. Enforced expression of the transcriptional transactivator Nlrc5, which is not expressed in the quiescent state, restored MHC-I on the stem cells. These studies establish that some tissue stem cells hide from immune surveillance and protect their integrity. Our findings may help to explain how hair follicles can regenerate upon resolution of immunity, and suggest that one of the mechanisms of tumor escape from immune editing may be coopted from quiescent stem cells.
RESULTS
Stem cells of the gut, ovary and breast are subject to T cell clearance
The gut is the site of substantial adult stem cell activity (van der Flier and Clevers, 2009). Most notably, the Lgr5+ stem cells, which are responsible for renewing the intestinal epithelium every 3 - 7 days (Barker, 2014; Barker et al., 2007). The gut is also an important immunological environment, as it is a location of tolerance induction, and an interface with many pathogens (Turner, 2009). We wondered if the intestinal stem cells may be protected from T cell immunity. To address this, we took advantage of just EGFP death-inducing (Jedi) T cells, which have a T cell receptor (TCR) specific for the immunodominant epitope of green fluorescent protein (GFP) loaded into MHC class I (MHC-I) (Agudo et al., 2015), and Lgr5-GFP mice, which express GFP in intestinal stem cells (Barker et al., 2007).
We injected Lgr5-GFP mice with Jedi or control T cells and vaccinated them with GFP to activate the T cells. Within 1 week, we could not detect any GFP+ cells in the intestine, indicating the stem cells had been completely eliminated (Figure 1A-C). Histological analysis 4 days after T cell injection confirmed the stem cells had undergone apoptosis following injection of Jedi, but not control T cells (Figure S1A). In control mice, T cells were mostly located in the upper part of the villi (Figure 1C). Instead, in mice that received Jedi T cells, there was accumulation of T cells in the crypt area and an overall increase in the frequency of GFP-specific CD8+ T cells in the gut and mesenteric lymph nodes (Figure 1C and Figure S1B). RT-qPCR for the Vα and Vβ chains Trav7-4 and Trbv2, respectively, confirmed that the infiltrating CD8+ T cells were Jedi T cells (Figure S1C).
Figure 1. Gut, ovary and mammary gland stem cells are eliminated by antigen-specific T cells.
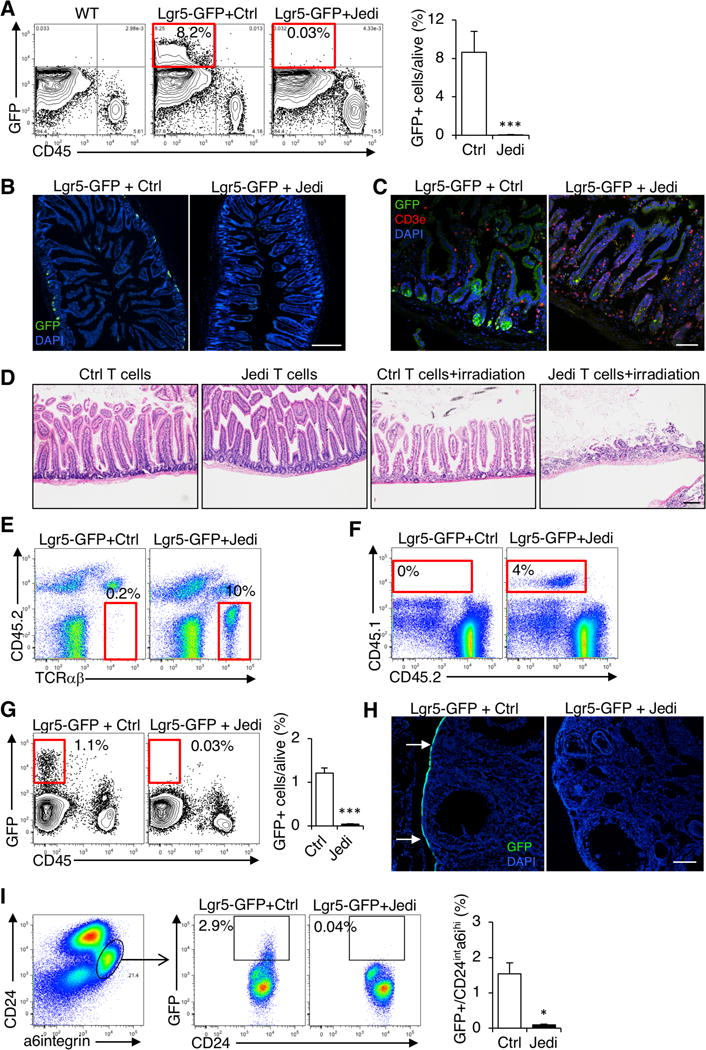
(A) Lgr5-GFP mice were injected with Jedi or control CD8+ T cells and vaccinated with GFP. Flow cytometry analysis of the frequency of GFP+ cells in the gut 1 week after T cell transfer. Graph presents the mean±s.d. Data are representative of 3 experiments (n=7–9 mice/group). (B) Florescent microscopy of the gut of mice in (A). White bar represents 500 μm. (C) Florescent microscopy of the gut 4 days after T cell transfer. Representative images from 3 mice/group. White bar represents 100 μm. (D) Histology of the gut of Lgr5-GFP mice injected with control or Jedi T cells and irradiated (10 Gy) or left untreated. Representative image shown per mouse (n=4–5 mice/group) 3 days post-irradiation. Black bar represents 100 μm. (E) Flow cytometry detection of CD45.1+ T cells in the ovaries 1 week after transfer of CD45.1 Ctrl (control) or Jedi T cells. Data are representative of 2 experiments (n=7–9 mice/group). (F) Flow cytometry detection of CD45.1+ T cells in the mammary gland 1 week after after transfer of CD45.1 Ctrl (control) or Jedi T cells. Data are representative of 2 experiments (n=4–6 mice/group and time point). (G) Flow cytometry detection of GFP+ cells in the ovaries 1 week after T cell transfer. Graph presents the mean±s.d. Data are representative of 2 experiments (n=4 mice/group). (H) Florescent microscopy of the ovaries of mice described in (E). Representative images from 3–5 mice per group from 2 independent experiments are shown. White bar represents 500 μm. (I) Flow cytometry detection of GFP+ cells in the mammary gland 1 week after T cell transfer. Graph presents the mean±s.d.. Data are representative of 2 experiments (n=4–6 mice/group). *P<0.05, **P<0.01, ***P<0.001 vs Control-treated.
To determine the physiological impact of T cell clearance of the intestinal stem cells, after injecting Lgr5-GFP mice with Jedi or control T cells, we irradiated the mice to induce damage in the intestine, and force tissue regeneration. After 3 days, in Jedi-treated mice, there was a dramatic loss of intestinal villi, which was not observed in irradiated mice that received control T cells (Figure 1D), indicating tissue regeneration was severely impaired upon T cell clearance of the Lgr5+ intestinal stem cells. These results phenocopy DTR-mediated ablation of the Lgr5+ stem cells (Metcalfe et al., 2014), and provide functional evidence that antigen-specific T cells can kill intestinal stem cells, and disrupt normal gut biology.
The ovary and breast also contain populations of adult epithelial stem cells. Lgr5 is expressed by populations of ovary and mammary stem cells, and they express GFP in the Lgr5-GFP mice (Flesken-Nikitin et al., 2013; Ng et al., 2014; Plaks et al., 2013). We could therefore also examine how these stem cells interact with antigen-specific T cells. In mice that received the Jedi, but not control T cells, there was T cell infiltration in the ovary and mammary gland, indicating expression of an antigen in rare stem cells was sufficient for T cell homing, even in sterile tissue (Figure 1E,F). Moreover, in both tissues there was complete clearance of the antigen-expressing stem cells (Figure 1G-H). These results demonstrate that, like the intestinal stem cells, stem cells in the ovary and mammary gland are subject to T cell clearance in an antigen-dependent manner, and thus epithelial stem cells are not inherently immune privileged.
Hair follicle stem cells evade cellular immunity
A population of epithelial stem cells also exists in the skin, which can give rise to hair follicles (Blanpain and Fuchs, 2014; Jaks et al., 2008). Hair follicle stem cells (HFSC) are characterized by expression of CD34 and cytokeratin 15 (K15) (Morris et al., 2004), as well as Lgr5, and in Lgr5-GFP mice HFSCs express GFP (Jaks et al., 2008). We hypothesized these cells would also be killed by Jedi T cells. To test our hypothesis, we analyzed the epidermis of the Lgr5-GFP mice that received Jedi or control T cells. Unexpectedly, there was no reduction in the number of GFP+ cells (Figure 2A,B). Although CD8+ T cells had infiltrated the skin of the mice that received Jedi T cells, and could even be found near the HFSCs (Figure 2C). RT-qPCR for Trav7-4 and Trbv2 confirmed the Jedi T cells had infiltrated the skin (Figure S2A). Thus, CD8+ T cells can access the epidermis, but they do not kill HFSCs expressing their target antigen.
Figure 2. Hair follicle stem cells escape antigen-specific T cell killing.
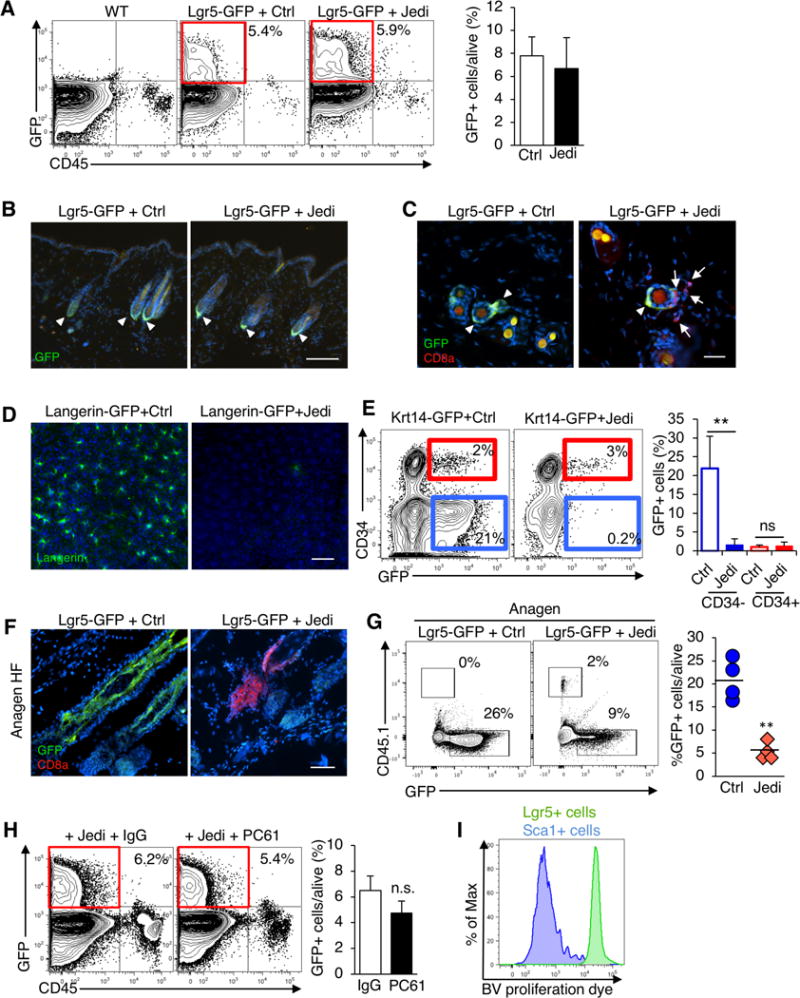
(A) Lgr5-GFP mice were injected with Jedi or control CD8+ T cells, and vaccinated with GFP. Flow cytometry detection of GFP+ cells in the epidermis 1 week after T cell transfer. Graphs present the mean±s.d.. Data are representative of 2 experiments (n=6 mice/group). Note mice were 7 weeks old at the time of injection, when the hair follicles are in telogen phase. (B) Florescent microscopy of the skin of mice described in (A). Representative images are shown. White bar represents 500 μm. (C) Florescent microscopy analysis of the skin of 7 week-old Lgr5-GFP mice 5 days after Control or Jedi T cell transfer. Representative images are shown (n=3 mice). White bar represents 100 μm. (D) Florescent microscopy of the epidermal sheets of Langerin-GFP mice (7–8 weeks old, telogen phase) injected with Jedi or control CD8+ T cells, and vaccinated with GFP. Data are representative of 2 experiments (n=5 mice/group). White bar represents 500 μm. (E) Flow cytometry detection of GFP+ cells in the epidermis of Krt14-GFP (Krt14-CreERT x CAG-DsRed-GFP) mice were treated with Tamoxifen and injected with control or Jedi CD8+ T cells and vaccinated with GFP. Graph presents the mean±s.d.. Data are representative of 2 experiments (n=3–5 mice/group). (F) Four week old Lgr5-GFP mice (anagen phase) were injected with CD45.1 Jedi or control CD8+ T cells, and vaccinated with GFP. The skin was analyzed by florescent microscopy 1 week later. Data are representative of 2 independent experiments (n=4–5 mice/group). White bar represents 100 μm. (G) Flow cytometry detection of CD45.1 T cells in the epidermis of mice in (F). Graph presents the frequency of GFP+ cells relative to the total live cells in individual mice. (H) Lgr5-GFP mice were injected with anti-CD25 (PC61) or IgG isotype control antibody, and 5 days later injected with Jedi or control CD8+ T cells and vaccinated for GFP. Flow cytometry detection of GFP+ cells in the epidermis 9 days after T cell transfer. Graph presents the mean±s.d. (n=3 mice/group). (I) In vitro proliferation analysis of Brilliant Violet Dye-labeled CD8+ Jedi T cells co-cultured with GFP+ cells isolated from the epidermis of Lgr5-GFP or Sca1-GFP mice. Dye dilution was measured at day 5. Histogram are representative of n=4/group. **P<0.01 vs Control-treated.
It has been suggested the hair follicle (HF) may be an immune privileged site (Paus et al., 2005). To determine if other cells in the HF are protected from immune clearance, we evaluated T cell killing of other cell populations in the skin. We transferred Jedi T cells into Langerin-GFP mice, which express GFP in Langerhans cells (LC) (Kissenpfennig et al., 2005). In all mice, there was complete clearance of the LCs (Figure 2D and S2D). Next, we generated mice that express GFP in both HFSCs, and terminally differentiated keratinocytes by treating Krt14-Cre-ERT/CAG-GFPfl/fl mice with tamoxifen (Vasioukhin et al., 1999). We then injected the mice with Jedi or control T cells. Examination of the skin indicated GFP+ keratinocytes (Krt14+CD34−) were eliminated in mice injected with Jedi T cells, but the GFP+ stem cells (Krt14+CD34+) were not (Figure 2E). These results indicate T cells are capable of killing cells in the HF, and thus the HF is not an immune privileged site. They also demonstrate immune protection is specific for HFSCs.
The HF has three phases, telogen (resting), anagen (growth), and catagen (destruction). In telogen, Lgr5 expression is restricted to the bulge HFSCs, but during anagen, as the HF grows, Lgr5 is also expressed by another population with stem cell potential, situated at the outer root sheath (ORS) (Jaks et al., 2008) (Figure 2F). We transferred Jedi or control T cells into Lgr5-GFP mice during anagen, and after 1 week, unlike during telogen, there was a significant reduction in the number of Lgr5+ cells in the HF, which was concomitant with an infiltration of T cells into the HF (Figure 2F,G). Thus, our results indicate immune privilege is highly restricted to the Lgr5+ stem cells during telogen.
Stem cell immune evasion is cell autonomous
Regulatory T cells (Treg) in the skin can help regulate HFSC differentiation (Ali et al., 2017). Since Jedi T cells entered the skin, we wondered if the HFSCs may be protected by cutaneous Treg. We injected Lgr5-GFP mice with an anti-CD25 antibody (PC61) to eliminate Treg (Setiady et al., 2010). CD4+CD25+Foxp3+ cells were reduced to <0.15% in the lymph nodes and skin (Figure S2B, S2C). We then transferred Jedi T cells into the Lgr5-GFP mice treated with anti-CD25, or IgG isotype control. In both groups, intestinal stem cells were eliminated (Figure S2C), but the HFSCs were not killed (Figure 2H). This suggested Treg may not be responsible for protection of the HFSCs.
To determine if the mechanism of HFSCs protection is cell autonomous, we isolated Lgr5−GFP+ HFSCs from the skin during telogen and co-cultured them with Jedi T cells loaded with proliferation dye. In parallel we isolated GFP-expressing differentiated skin epidermal cells from Sca1-GFP mice, and similarly cultured them with dye-labeled Jedi T cells. When the Jedi T cells were co-cultured with GFP+ epidermal cells, they became activated and vigorously proliferated, as indicated by dye dilution (Figure 2I). In contrast, the Jedi T cells cultured with the GFP+ HFSCs did not proliferate, indicating HFSCs do not activate T cells, even when they express an antigen recognized by the T cells. These results demonstrate HFSCs are intrinsically resistant to T cell surveillance and killing.
The antigen presentation machinery is downregulated in HFSCs
In considering a cell autonomous mechanism that could enable HFSCs to escape a CTL response, we examined the expression of MHC-I. MHC-I is generally expressed by all nucleated cells (Pamer and Cresswell, 1998), but it has been reported to be low expressed in the HF (Paus et al., 2005). As expected, all of the hematopoietic cells in the skin were MHC-I+, as were the vast majority (>85%) of non-hematopoietic, GFP− cells, which encompasses most cells of the epidermis (Figure 3A). All of the Lgr5+ HFSCs were MHC-I−/low. Conversely, all the stem cells in the intestine, ovary and mammary gland were MHC-I+ (Figure 3B and Figure S3A).
Figure 3. Hair follicle stem cells downregulate the antigen presentation machinery.
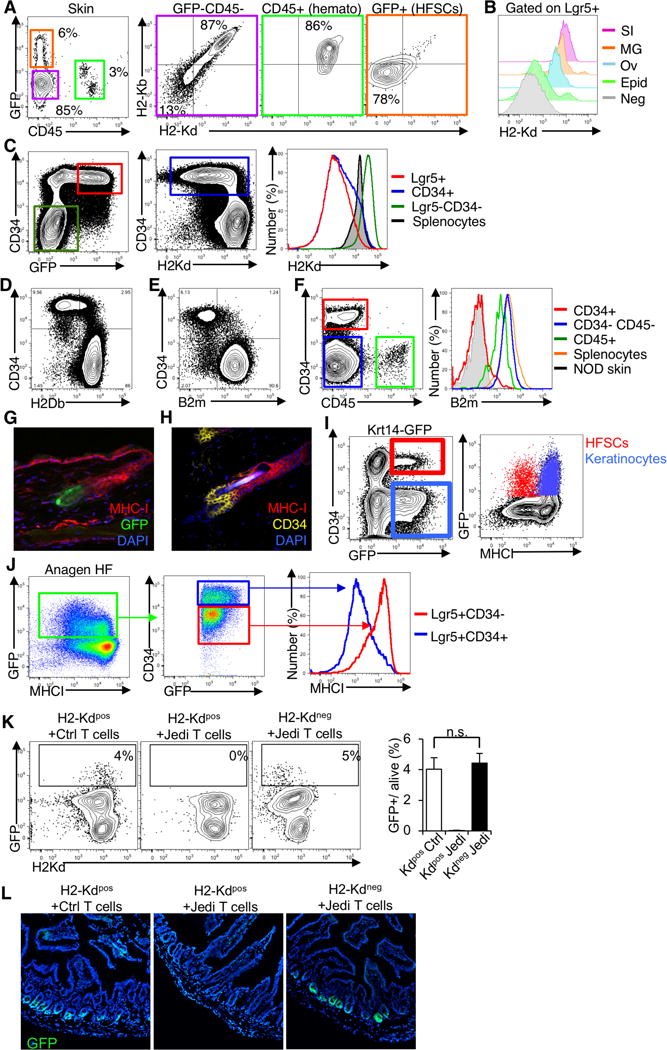
(A) Flow cytometry analysis of MHC-I in the skin of 7–8 week-old Lgr5-GFP mice. Cells were collected from the epidermis and stained for CD45 and H2Kd and H2Kb (two different alleles of MHC-I). Representative dotplots shown (n=8 mice/group, 3 independent experiments). (B) Flow cytometry analysis of MHC-I in Lgr5+ stem cell populations from different tissues of Lgr5-GFP mice. Cells were collected from the small intestine (SI), mammary gland (MG), ovaries (Ov) and epidermis (Epid) and stained for H2Kd and H2Kb. Representative histogram shown (n=4 mice, 2 independent experiments). (C) Flow cytometry analysis of H2Kd (from the H2-K1 gene) and CD34 in the skin of 7–8 week-old Lgr5-GFP mice. Representative plot shown (n=3 mice). (D) Flow cytometry analysis of H2Db (from the H2-D1 gene), and CD34 in the skin of 7–8 week-old C57Bl/6 mice. Representative plot shown (n=3 mice). (E) Flow cytometry analysis of B2m and CD34 in the skin of 7–8 week-old C57Bl/6 mice. Representative plots show (n=4 mice, 2 independent experiments). (F) B2m expression in different populations of the skin in mice from (E) compared to splenocytes. Skin from NOD mice was used as a negative control for the staining. Representative plots shown (n=4, 2 independent experiments). (G) Florescence microscopy of MHC-I in the HF of Lgr5-GFP mice. Tissue sections were stained for MHC-I (red). GFP was directly visualized (green). Representative image is shown (n=3 mice). (H) Florescence microscopy of MHC-I in HF of C57Bl/6 mice. Tissue stained for MHC-I (red) and CD34 (yellow). Representative image shown (n=4, 2 independent experiments). (I) Flow cytometry analysis of MHC-I in GFP+ cells in Krt14-GFP (Krt14− CreERT x CAG-DsRed-GFP) mice 10 days after Tamoxifen treatment, comparing GFP+ HFSCs (CD34+) and keratinocytes (CD34-). Representative plot shown (n=3 mice). (J) Flow cytometry analysis of MHC-I in GFP+ cells in Lgr5-GFP mice during Anagen, comparing CD34+ and CD34− cells. Representative plot shown (n=3 mice). (K) Lgr5-GFP mice homozygous for H2Kd were injected with Jedi or control CD8+ T cells, and Lgr5-GFP mice homozygous for H2Kb allele were injected with Jedi T cells. Flow cytometry analysis of GFP+ cells in the small intestine 1 week after. Graph presents the mean±s.d.. Cells were stained for H2Kd (MHC-I) (n=4 mice/group, 2 independent experiments). (L) Florescent microscopy analysis of the small intestine of mice described in (K). Representative images are shown.
Though Lgr5 is a good marker for HFSCs, some HFSCs lack Lgr5 expression. A more inclusive marker of HFSCs is CD34. We examined MHC-I on CD34+ cells in the epidermis, and found that, as observed with the Lgr5+ HFSCs, MHC-I was absent on the majority of CD34+ HFSCs (Figure 3C). We confirmed the HFSCs do not express MHC-I using an antibody that stains a different MHC-I gene (H-2Db) (Figure 3D). We also found the HFSCs did not express beta-2 microglobulin (B2m), an essential component of the MHC-I complex (Figure 3E,F). Additionally, we stained sections of epidermis from Lgr5-GFP mice for MHC-I, and found the HFSCs were MHC-I−, whereas other cells in the hair follicle were MHC-I+ (Figure 3G). Importantly, we observed the same result in the epidermis from wildtype mice using CD34 to mark the HFSCs (Figure 3H). Looking at the HF in anagen, the stem cells (Lgr5+CD34+) remained MHC-I−, but the Keratinocytes (Krt14+GFP+CD34−) and, Lgr5+CD34− ORS cells, which were both targeted by Jedi T cells (see Figure 2E,F), were MHC-I+ (Figure 3I and Figure 3J). Thus, the absence of MHC-I is a property of HFSCs, and correlates with protection from immunity. These results suggest HFSCs do not present antigen to CD8+ T cells.
To determine if loss of MHC-I would protect the sensitive tissue stem cells, we took advantage of the fact that the Jedi’s TCR is restricted to the H2-Kd MHC-I haplotype. This means the Jedi’s TCR does not recognize antigen presented on H2-Kb MHC-I. We injected Jedi or control T cells in to Lgr5-GFP mice carrying only H2-Kb, and vaccinated with GFP. After 7 days, the frequency of GFP+ cells in the intestine was indistinguishable between Jedi and control treated mice, indicating loss of antigen presentation on sensitive tissue stem cells protects them from antigen-specific T cells (Fig. 3K, L).
One reason it is unexpected to find an MHC-I− population is because there are immune cells, the natural killer (NK) cells, which are specialized in killing MHC-I− cells (Orr and Lanier, 2010). We sought to determine if the HFSCs would be targets of NK cells. We isolated HFSCs, and co-cultured them with NK cells. As a negative control, we isolated keratinocytes which express MHC-I, and as a positive control we used YAC-1 cells, that expresses low MHC-I (Piontek et al., 1985). As expected, YAC-1 cells activated the NK cells and were killed, whereas the keratinocytes did not stimulate the NK cells and were not killed (Figure S3B,C). Despite being MHC-I−/low, the HFSCs did not activate the NK cells, and were not eliminated. Thus, the HFSCs also appear to be protected from NK cell killing.
Downregulation of MHC-I is a property of quiescent hair follicle stem cells
HFSCs share some characteristic stem cell features with stem cells of the intestine, such as their ability to self-renew and repopulate their tissue of residence, but a notable difference between these stem cell populations is that the intestinal stem cells are continuously proliferating, whereas the HFSCs are mostly quiescent (Blanpain and Fuchs, 2014). In support of previous reports (Jaks et al., 2008; Ng et al., 2014), we found Lgr5+ stem cells from the gut and ovary were cycling (Figure 4A). Instead, <0.5% of stem cells in the skin were cycling. To determine if MHC expression was associated with the proliferative state of the stem cells, we looked at MHC-I on the small fraction of HFSCs that were proliferating using Ki67 or BrdU. HFSCs that were proliferating (Ki67+ or BrdU+) expressed MHC-I, whereas non-proliferating HFSCs were MHC-I negative (Figure 4B,C). We further confirmed this using the Fucci mice (Sakaue-Sawano et al., 2008), in which cells express differential florescence depending on cell cycle status, and once again found that MHC-I was only expressed on the small population of HFSCs in S, G2 or M phase (Figure S4A,B).
Figure 4. Downregulated MHC class I is a property of quiescent HFSCs.
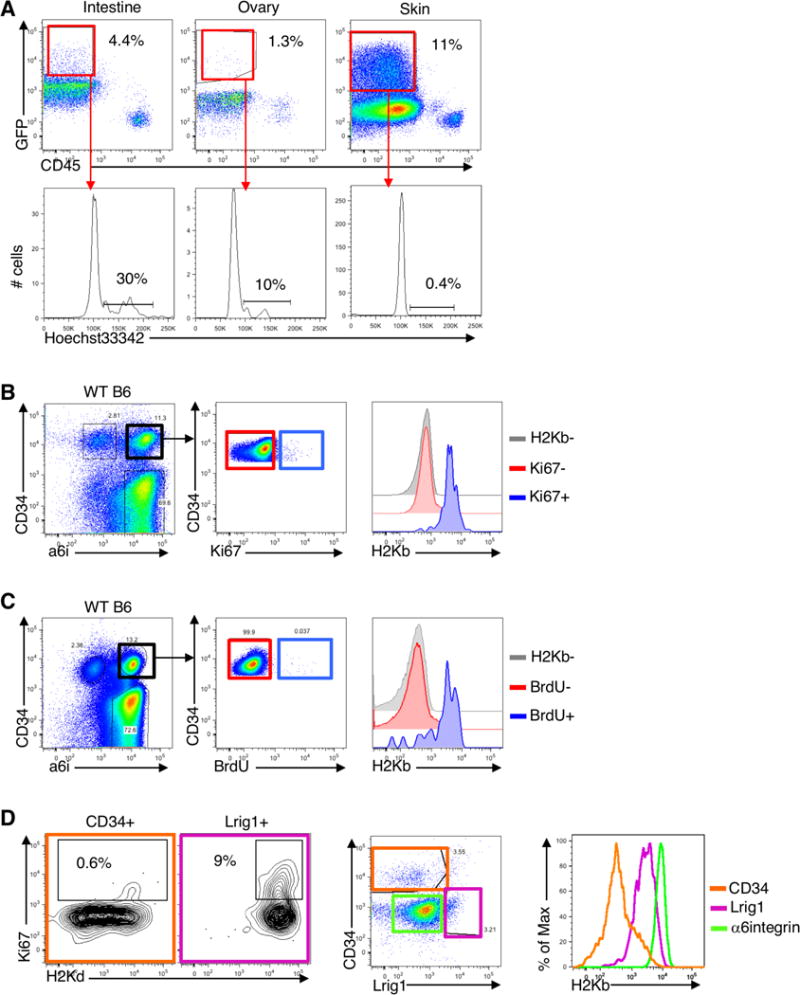
(A) Intestine, ovaries and skin (P56) from Lgr5-GFP mice were processed to obtain a single cell suspension and stained with Hoechst33342 to assess proliferation. Representative flow cytometry plots shown (n=3 mice). Histograms show GFP+ live (7AAD-negative) cells. Gate in the histogram includes cells in S and G2. (B) Ki67 was assessed in the skin of C57Bl/6 mice in telogen. The skin was processed and cells were stained with CD34 and alpha-6-integrin (a6i) to label HFSCs, CD45 to label hematopoietic cells, ki67 to label proliferating cells and H2Kb for MHC-I. Representative flow cytometry plots shown (n=5 mice/group, 2 independent experiments). (C) C57Bl/6 mice in telogen (P56) were injected with BrdU. Two hours later, the skin was processed and stained with anti-BrdU to assess proliferation. Representative flow cytometry plots shown (n=3 mice/group, 2 independent experiments). (D) Flow cytometry analysis of Ki67 and MHC-I in CD34+ bulge HFSCs (CD45−Sca1−), Lrig1+ stem cells (CD45− a6i+Sca1low) and non HFSCs a6i+CD34− epidermal cells (n=3 mice).
The studies of HFSCs described above were carried out when the HF of the mice were in telogen, and the HFSCs quiescent. However, during anagen Lgr5+ cells proliferate (Figure S4C), and, as we found, the Lgr5+ cells also express MHC-I during anagen (see Figure 3J), which supports the notion MHC-I is linked to stem cell quiescence. To further test this hypothesis, we examined MHC-I on another population of proliferating stem/progenitor cells in the HF, the Lrig1+ cells (Page et al., 2013). Consistent with our findings for the proliferating Lgr5+ cells in anagen, the cycling Lrig1+ stem cells also expressed MHC-I (Figure 4D). Thus, downregulation of MHC-I appears to be a specific property of the quiescent stem cells in the HF.
Nlrc5 is downregulated in quiescent stem cells and its expression upregulates MHC-I on HFSCs
All nucleated cells are expected to express MHC-I (Pamer and Cresswell, 1998). Though MHC-I can be downregulated by viruses and mutated in some cancer cells, it is unexpected to find populations of naturally existing MHC-I− cells in the periphery, and thus we sought to understand how its expression is controlled in the HFSCs. We isolated Lgr5+ cells from telogen and anagen HFs by flow cytometry, and performed RNA-seq. As expected, the Lgr5+ HFSCs from telogen HF expressed lower levels of cell cycle genes, consistent with the fact that they are quiescent. There was also a major reduction in the expression of numerous genes essential for antigen presentation in the resting HFSCs (Figure 5A). The expression of genes encoding MHC-I and B2m were downregulated by as much as 80% (Figure S5A). The genes responsible for loading peptide into the MHC-I complex were also downregulated in the resting stem cells, including Tap1, Tap2, and Tapbp. Moreover, key genes involved in cell intrinsic control of inflammation were highly downregulated in telogen Lgr5+ cells. These included interleukin and cytokine receptors, such as Ifngr1, Il6ra, Il17re, the Nfkb subunit Rela, the inflammasome component Pycard, and inflammation-responsive transcription factors Irf3, Irf5, Stat1, and Stat3.
Figure 5. Nlrc5 is downregulated in slow cycling stem cells and its expression restores MHC class I in HFSCs.
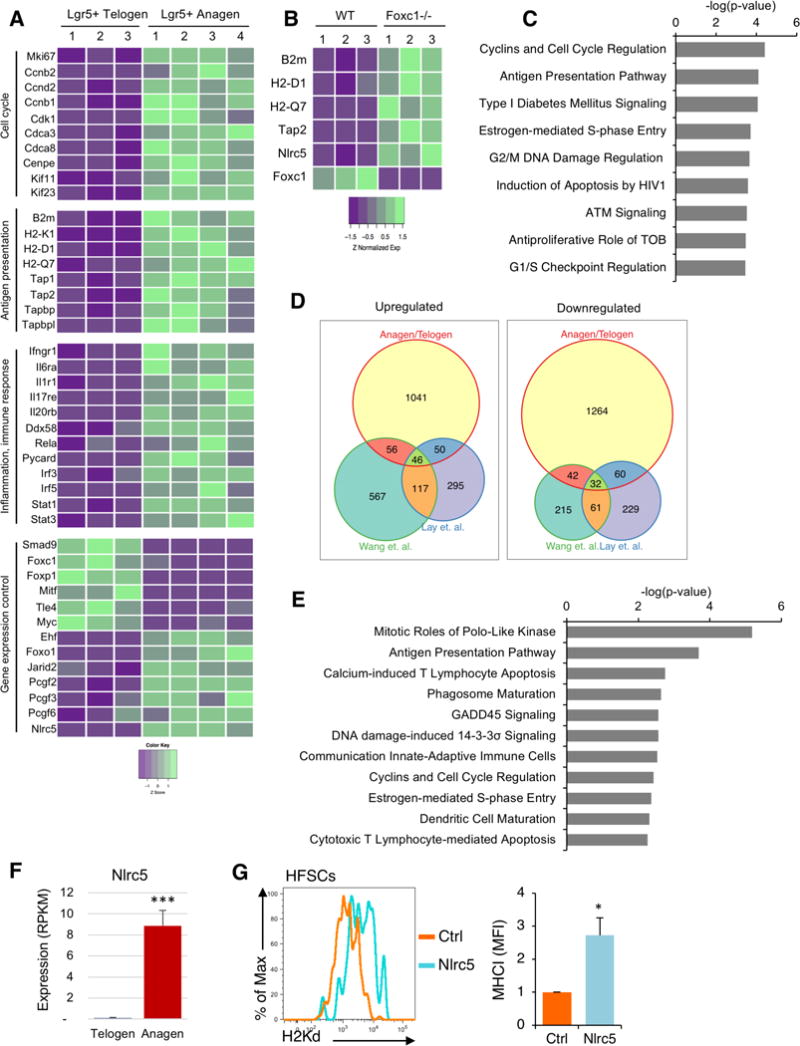
(A) RNAseq analysis of isolated Lgr5+ cells from telogen and anagen skin. Heatmap shows key differentially expressed genes involved in cell cycle, antigen presentation, response to inflammation and gene expression control. Each column is one individual Lgr5-GFP mouse. Data is color coded to reflect gene expression Z-scores. (B) Heatmap shows key differentially expressed genes involved in antigen presentation in RNAseq data from Wang et al. Science 2016 (GSE67404), in which HFSCs from Foxc1 deficient mice were compared to HFSCs from littermate controls. Each column shows an individual mouse. Data is color coded to reflect gene expression Z-scores. (C) Ingenuity analysis of differential pathway expression between wildtype and Foxc1−/− HFSCs from Wang et al. We analyzed genes that had p<0.05 and a cutoff of 10 reads. (D) Venn diagram comparing the number of common differentially expressed genes between anagen and telogen Lgr5+ cells (described in A), and wildtype and Foxc1−/− HFSCs from Wang et al. and Lay et al (GSE77256). (E) Ingenuity pathway analysis of common differential pathway usage between Lgr5+ cells from anagen and telogen skin, and WT and Foxc1−/− HFSCs (from Wang et al. and Lay et al). (F) Nlrc5 expression from RNAseq of GFP+ cells isolated from telogen and anagen skin of Lgr5-GFP mice. Graph presents the mean±s.d. (n=3–4). ***P<0.001 vs telogen Lgr5+ cells. (G) CD34+ HFSCs were flow sorted and nucleofected with either a plasmid encoding Nlrc5 and GFP or GFP alone as a control (Ctrl). Cells were cultured for 36h and stained with H2Kd antibody to determine MHC-I expression. Histograms show DAPI− (live) GFP+ cells. Graph presents the mean±s.d. fold-change of MHC-I of Nlrc5/GFP versus GFP transfected CD34+ cells (n=3 of 3 independent experiment). *P<0.05 vs Control treated.
The transcriptomic comparison of telogen and anagen Lgr5+ cells indicated the antigen presentation machinery is downregulated at the transcriptional level. However, because the Lgr5+ cells from anagen follicles also contain more committed cells, it is difficult to distinguish between mechanisms related to stemness versus quiescence. Two recent studies reported the transcription factor Foxc1 is essential for HFSC quiescence (Lay et al., 2016; Wang et al., 2016). Both studies compared gene expression changes between the quiescent Foxc1+/+ and proliferating Foxc1−/− HFSCs. When we examined those signatures, amongst the genes that were most significantly upregulated in HFSCs upon Foxc1 deletion were those encoding MHC-I and B2m (Figure 5B and Figure S5B). Indeed, pathway analysis indicated that in both data sets (Lay et al. and Wang et al.) antigen presentation was, after cell cycle, the most significantly increased pathway in the HFSCs upon loss of Foxc1 (Figure 5C and Figure S5C). This supports the notion that downregulation of the antigen presentation machinery is a feature of quiescent HFSCs, and molecularly linked to one of the regulatory factors that controls stem cell quiescence.
Since several components of the MHC-I pathway were downregulated we hypothesized that this might be due to a common regulatory factor. We cross-compared the differentially expressed genes between the anagen and telogen Lgr5+ cells, and Foxc1 deficient HFSCs. There were 78 genes consistently altered between proliferating and quiescent HFSCs (Figure 5D) and pathway analysis showed that cell cycle and antigen presentation are the two most significantly downregulated pathways (Figure 5E). We looked for regulatory sequences shared between the promoters of downregulated antigen presentation genes, and found several contained motifs for Nlrc5. Nlrc5 is a member of the NOD-like receptor family of genes (Cui et al., 2010) that has been shown to interact with the basal transcriptional machinery of several MHC-I complex genes to regulate MHC levels (Meissner et al., 2010, 2012; Staehli et al., 2012). Nlrc5 was virtually undetectable in the telogen HFSCs, whereas it was well expressed in the anagen cells (Figure 5A,F). Nlrc5 was also one of the most significantly upregulated genes in HFSCs upon Foxc1 knockout (Figure 5B and Figure S5B).
To determine if Nlrc5 might be involved in mediating the differential MHC-I between the quiescent and proliferating HFSCs, we isolated CD34+ cells from telogen HF, and transfected them with a plasmid encoding Nlrc5 and GFP, or a control plasmid. After 36 hours, there was upregulation of MHC-I on the HFSCs transfected with the Nlrc5 plasmid, which did not occur with the control (Figure 5G). This was not a general effect of overexpressing Nlrc5, as transfection of isolated keratinocytes did not lead to an upregulation of MHC-I (Figure S5B). These studies suggest Nlrc5 is one of the regulatory factors that controls expression of the antigen presentation pathway between proliferating and quiescent stem cell states.
Quiescent muscle stem cells evade immunity
Our findings indicated that fast cycling epithelial stem cells expressed MHC-I, whereas the non-proliferating HFSCs did not. We wondered if other slow cycling stem cells would have a similar phenotype. Adult muscle stem cells, or satellite cells, have been shown to be quiescent in the absence of muscle injury (Brack and Rando, 2012). We harvested muscles from mice, and stained for MHC-I and markers to distinguish the satellite cells (Sca1−CD31−CD45−Vcam+CD34+) as well as the endothelial and Sca1+ cells and hematopoietic cells (CD45+) (Figure S6A). Whereas all the endothelial and hematopoietic cells expressed MHC-I, the satellite cells expressed little to no MHC-I (Figure 6A). As observed with HFSCs, the small population of proliferating satellite cells (Ki67+) expressed MHC-I (Figure 6B and Figure S6B). We confirmed that MHC-I, as well as B2m, was downregulated at the RNA level by isolating the satellite cells and measuring expression by RT-qPCR (Figure 6C). Like the HFSCs, the satellite cells did not express Nlrc5, which suggests a similar mechanism of antigen presentation control operates in different slow cycling stem cells (Figure 6C).
Figure 6. Immune evasion is a property of quiescent muscle stem cells.
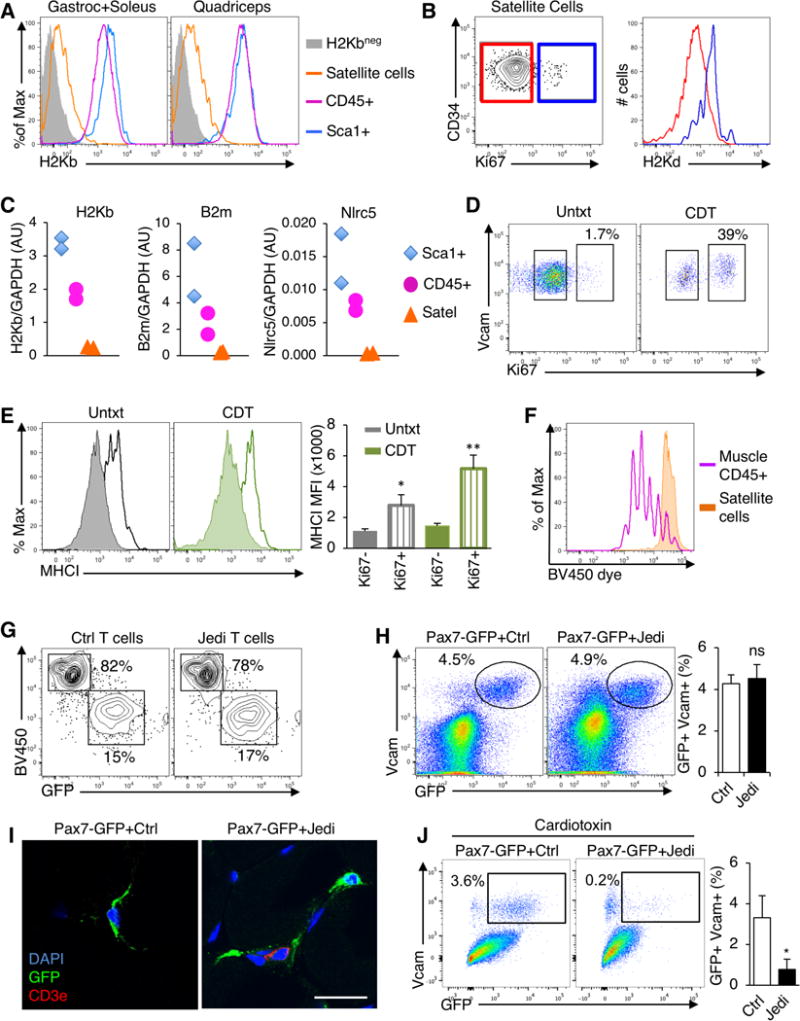
(A) Gastrocnemius, soleus and quadriceps were processed from C57Bl/6 mice to single cells and analyzed by flow cytometry. Satellite cells (Sca1−CD45−CD31−CD34+Vcam+) were compared with hematopoietic (CD45+) and stroma cells (Sca1+). Histograms show H2Kb expression. Muscle from B10D2 mice was used as a negative control for H2Kb staining. Representative histograms shown (n=8 mice, 4 independent experiments). (B) Flow cytometry analysis of Ki67 in satellite cells from gastrocnemious+soleus. Satellite cells were gated on Ki67− (red) and Ki67+ (blue) populations and MHC-I (H2Kd) was assessed in these populations (right). Representative flow cytometry plots are shown (n=4 mice/group, 2 independent experiments). (C) Measurement of H2-K1 (H2Kb), B2m, and Nlrc5 mRNA in purified Satellite cells, hematopoietic and stroma cells from the muscle by RT-qPCR. Each sample corresponds to a different mouse. Graphs present expression of indicated genes vs GAPDH in each population (n=2 samples/group). (D) Flow cytometry analysis of Ki67 in satellite cells from the muscles of C57Bl/6 mice 40 hours after intramuscular injection of cardiotoxin (CDT) (n=3 mice/group). (E) Flow cytometry analysis of MHC-I on Ki67+ and Ki67− satellite cells from mice in (D). Graph presents the mean±s.d. of the MFI of MHC-I (n=3 mice/group). *P<0.05; **P<0.01 vs Ki67− satellite cells in the same muscle. (F) Analysis of Jedi T cell proliferation in response to GFP+ satellite cells. Satellite cells and CD45+ cells were isolated from the muscles of actin-GFP mice and co-cultured with Brilliant Violet proliferation dye-loaded Jedi T cells. Proliferation was measured at day 4 by flow cytometry. A representative histogram is shown. (G) Flow cytometry analysis of GFP+ satellite cells (from actin-GFP mice) co-cultured with either control or Jedi T cells. T cells are visualized by BV450 (Brilliant Violet 450 dye) and satellite cells by GFP. Gated on live (DAPI−) cells. (H) Pax7-CreERT2 mice were bred with CAG-DsRed-GFP and with B10D2 to acquire H2Kd haplotype. Mice were treated with Tamoxifen and 2 days later CD45.1 control or Jedi T cells were injected. 1 week later, the gastrocnemius and quadriceps muscles were analyzed. Representative flow cytometry plots show GFP+Vcam+ satellite. Graph present the mean±s.d. percentage of GFP+ satellite cells (n=5 mice/group, 2 independent experiments). (I) Florescence microscopy analysis of the muscles from mice in (H). Sections were stained with anti-GFP and anti-CD3e to mark satellite cells (green) and T cells (red). Representative images shown (n=3/group). White bar represents 20μm. (J) Pax7-CreERT2 x CAG-DsRed-GFP carrying the H2Kd haplotype were treated with Tamoxifen and 3 days later Cardiotoxin (CDT) was injected in the muscle. After 2 days, control or Jedi T cells were injected and 1 week later muscles were analyzed by flow cytometry. Representative plots show GFP+ satellite cells. Graph represents the mean±s.d. of the percentage of live GFP+ satellite cells (n=4 mice/group). *P<0.05
To further clarify if the downregulation of MHC-I was linked to stem cell quiescence, we injected cardiotoxin (CDT) into the muscle to induce damage, and activate satellite cell proliferation (Figure 6D, Figure S6C). In the satellite cells that remained quiescent (Ki67−) MHC-I levels did not increase (Figure 6E, Figure S6D), whereas proliferating satellite cells (Ki67+) upregulated MHC-I by over 3-fold (Figure 6E, Figure S6E).
To understand if the satellite cells could present antigen, we isolated GFP-expressing satellite cells from actin-GFP mice, along with GFP-expressing CD45+ cells from muscle and co-cultured them with Violet dye-labeled Jedi T cells. Whereas the CD45+ cells triggered Jedi proliferation, the satellite cells did not activate the T cells and were not killed (Figure 6F,G). Thus, like HFSCs, satellite cells do not present antigen.
To determine if satellite cells would be protected from immune surveillance in vivo, we generated mice in which GFP was only expressed in satellite cells by crossing a Pax7-CreERT2 mouse (Mathew et al., 2011) with a Stop-Flox GFP mouse. After tamoxifen, we injected Jedi or control T cells. Despite Jedi T cell recruitment to the muscle (Figure 6H and Figure S6F), there was no change in the number of satellite cells (Figure 6I,J) indicating muscle stem cells are protected from immune surveillance. Since muscle injury triggers satellite cell proliferation and upregulation of MHC-I, we could test whether exiting quiescence altered satellite cell privilege. We injected CDT in to the muscle of Pax7-GFP mice, and 1 day later we transferred Jedi or control T cells. Unlike the resting satellite cells, there was significant loss of GFP+ satellite cells in the injured muscle of mice injected with Jedi T cells (Fig. 6J). Together, this data indicates immune evasion, through downregulation of MHC-I, is a property shared by slow cycling tissue stem cells.
DISCUSSION
Peripheral tissues are defended from malignant and pathogen-infected cells by immune surveillance. Harmful cells are killed by T cells, and, in many tissues, replaced by cells differentiating from stem and progenitor cells within the tissue. Our studies indicate some naturally occurring adult stem cell populations can hide from immune surveillance.
As stated above, there was a notion that stem cells may be immune privileged. This was based predominately on studies of ESCs and MSCs. ESCs were reported to express low levels of MHC-I in vitro (Drukker et al., 2002). However, both types of stem cells can be rejected upon transplant (Chidgey and Boyd, 2008). Our data indicates immune evasion is not a property of all adult stem cells, but instead suggests it is a property of slow cycling stem cells, as the two most well defined populations of quiescent tissue stem cells, the HFSCs and the satellite cells (Clevers, 2015), shared this phenotype, even though they are functionally and ontologically distinct cell types. It is not a general property of quiescent cells since resting T cells, pancreatic beta cells and many other differentiated cells, which are not constantly proliferating, express B2m and MHC-I and are subject to immune clearance (Agudo et al., 2015). This is thus a rare but potent phenomenon that appears to be specific for these adult tissue stem cells. It is interesting that this property was not shared by fast cycling stem cells, such as the intestinal stem cells, and may be because these cells can be replaced if they are destroyed by ‘backup’ stem cells, as can occur in the gut (Tian et al., 2013). Immune protection may then be a property of stem cells at the top of their tissue hierarchy, as this may also correlate with proliferation status.
It is important to note that we cannot rule out the possibility there are populations of stem cells in the intestine, ovary, and mammary glad that may be privileged, but do not express Lgr5. Indeed, in the gut there are non-Lgr5 expressing cells with stem cell potential, and they have slower cycling kinetics (Li et al., 2016; Yan et al., 2012). These cells may be less susceptible to immune clearance, but this will need to be determined experimentally. It will also be relevant to investigate the immunogenicity of other stem cell populations, including hematopoietic stem cells (HSC) and neural stem cells (NSC), which both have a fraction that are quiescent (Codega et al., 2014; Wilson et al., 2008). As HSCs and NSCs have a very different physical association with the immune system than peripheral tissue stem cells - HSCs being intimately connected and NSCs being markedly isolated - they may not utilize the same mechanism of the HFSCs and satellite cells, but this must be studied. It will also be worthwhile to examine how cell state affects the immunogenicity or privilege of MSCs, as there are MSCs in the bone marrow with slower cycling kinetics (Méndez-Ferrer et al., 2010). Pairing Jedi T cells with additional GFP-expressing stem cell models will provide a means to investigate the immunogenicity of other stem cell populations, but it will also be important to utilize additional model antigens to provide an alternative evaluation.
It is notable that we could detect some MHC-I and B2m transcripts in the HFSCs and satellite cells, albeit low levels. This is despite the fact that there was little to no MHC-I complexes measured by flow cytometry and histology, and more significantly, that the antigen-specific T cells were not activated by the stem cells, which provides functional evidence they are invisible to the adaptive immune system, as a T cell only requires a few peptide MHC complexes for activation (Purbhoo et al., 2004). It appears than that the collective reduction of several critical antigen presentation genes reduces component stoichiometry to a level that prevents efficient MHC-I and peptide complex assembly, and effectively collapses the pathway. Nlrc5 serves as a key factor here since it is a transactivator of several MHC-I genes, and it’s downregulation in HFSCs and satellite cells reduces expression of a network of genes relevant to antigen presentation.
MHC-I is an inhibitory receptor for NK cells, and its absence serves as a signal for NK cell activation. However, the HFSCs did not activate or get killed by NK cells in vitro. This suggests the HFSCs are protected not only from adaptive cellular immunity, but also the innate killer response, and that additional mechanisms protect the HFSCs from the immune system. This could be due to low expression of activating NK cell ligands on the HFSCs, or through expression of inhibitory molecules (Orr and Lanier, 2010). This will require further investigation to determine. As there are few known healthy cell types that are naturally MHC-I negative, HFSCs and satellite cells present an opportunity to understand how a cell can downregulate the antigen presentation pathway and survive.
An outstanding question is why some tissue stem cells are programmed to evade immune surveillance. One reason may be because long-lived stem cells acquire mutations over time, which would give rise to neo-antigens, and make the stem cells susceptible to immune clearance. Exome-sequencing has identified an abundance of mutations present in stem cells (Jan et al., 2012), including quiescent stem cells (Beerman et al., 2014), and ultra-deep sequencing of targeted genes from healthy skin revealed that up to 20% of skin cells carried mutations in coding genes (Martincorena et al., 2015). Clearance of differentiated cells expressing these mutated genes is beneficial to prevent malignancy, but clearance of stem cells carrying the mutations could lead to impaired tissue homeostasis. Thus, there would be selective pressure for long-lived stem cells to evade immune surveillance.
Tissue stem cells can serve as the cancer-initiating cells of some tumors (Barker et al., 2009), and so their permissiveness to immune surveillance is relevant to preventing malignancy. Established tumors use a number of mechanisms to prevent their clearance by the immune system (Chen and Mellman, 2013), which responds to the neo-antigens produced by mutated genes (Tran et al., 2015), but the earliest events of immune evasion are not known. Our findings suggest that one explanation may be that the cancer-initiating cells start out as immune privileged because they are quiescent stem cells. This is speculative, but in support of the hypothesis that cancer cells coopt properties of quiescent stem cells, it was recently shown that cancer stem-like cells have immune evasive properties when they enter quiescence (Malladi et al., 2016).
It had been suggested the human hair follicle is privileged (Paus et al., 2005; Westgate et al., 1991). This was based mainly on histological analysis showing differential expression of immune regulatory genes, including lower B2m and MHC-I. Our data provide functional evidence that, at least in mice, the hair follicle per se is not privileged, but that quiescent stem cells in the hair follicle are protected from immune clearance. It may be humans evolved more extensive privilege in the hair follicle, or there could be gradients of privilege, with quiescent stem cells being the most resilient.
As immunotherapies are being increasingly used to direct the immune system against cancer, including injections of antigen-specific T cells (Rosenberg and Restifo, 2015), there is an emerging need to better understand immune privilege in humans. These therapies can lead to unwanted killing of non-cancer cells, and even autoimmune-like disease (Stucci et al., 2017). If particular stem cell populations are protected from immune system detection, as we found with HFSCs and satellite cells, this could minimize the long-term effects of immunotherapy on some tissues.
STAR METHODS
CONTACT FOR REAGENT AND RESOURCE SHARING
Further information and requests for reagents may be directed to, and will be fulfilled by, the Lead Contact, Dr. Brian Brown (brian.brown@mssm.edu)
EXPERIMENTAL MODEL AND SUBJECT DETAILS
Mice
Lgr5-GFP, Langerin-GFP, Sca1-GFP and actin-GFP mice were bred with B10D2 mice to express H2-Kd allele of MHC class I. Lgr5-GFP were also bred with C57Bl/6 to express H2-Kb allele only. Pax7-CreERT2 and Krt14-CreERT2 were bred with CAG-DsRed-GFP and with B10D2 to acquire both GFP and H2-Kd. Lgr5-GFP, Sca1-GFP, actin-GFP, Pax7-CreERT2, Krt14-CreERT2 and CAG-DsRed-GFP were purchased from Jackson Laboratories. Langerin-GFP mice were a generous gift from Dr. Malissen. Jedi mice were previously described (Agudo et al., 2015) and generated and bred in our facility, All animal procedures were performed according to protocols approved by the Mount Sinai School of Medicine Institutional Animal Care and Use Committee.
METHOD DETAILS
No randomization or blinding was performed in this study. Sample-size and statistical methods are indicated in the quantification and statistical analysis paragraph.
Adoptive transfer of CD8+ T cells
Jedi and control CD8+ T cells were purified from spleens and LNs (cranial, axillar, brachial, inguinal and mesenteric) after obtaining a single cell suspension by mechanical disruption and filtering through 70μm cell strainer. After RBC lysis, CD8+ T cells were selected with the mouse CD8+ T cells isolation kit from eBiosciences following manufacturer’s instructions. 3–5×10⁶ Jedi or control T cells were injected via tail vein. In parallel, all mice were also intravenously injected with ~2×10⁸ transducing units (TU) of a vesicular stomatitis virus (VSV)-pseudotyped lentiviral vectors (LV) encoding green florescent protein (GFP).
Irradiation
Lgr5-GFP that had been injected with either control or Jedi T cells were irradiated once at 10Gy 7 days later with a X-ray source (RS 2000), held in Hess building mouse facility, Icahn School of Medicine.
Immunostaining and histology
Skin, ovaries and mammary gland were harvested, frozen directly in OCT and kept at −80C. Intestines were fixed and equilibrated in 20% sucrose (Sigma-Aldrich) 4% paraformaldehyde (Sigma-Aldrich) and embedded in OCT prior to sectioning. Sections from skin, ovary and mammary gland were fixed for 5 min with 4% paraformaldehyde prior to staining. GFP was directly visualized without staining. Sections (8μm) were blocked with 2% rat serum and 0.5% BSA in PBS before staining. AlexaFluor594-conjugated anti-CD8a (53–6.7), AlexaFluor647-conjugated anti-CD3e (17A2), Alexa647-conjugated or biotin-conjugated H2Kd and CD34 (RAM34)-biotin (along with Alexa-594-conjugated streptavidin all from BioLegend, except CD34 from eBiosciences, were used for CD8, CD3, CD34 and MHCI staining respectively. For Ki67 staining anti-Ki67 (VP-RM04) from Vector Laboratories was used.
For epidermal sheet preparation, after the hair removal cream was applied, the ears were harvested and the dorsal and ventral surfaces were separated and mounted epidermis-side down on microscope slides using clear double-sided tape (3M). They were incubated in 10mM EDTA for 2 h at 37C and the dermis was removed. The sheets were stained with anti-Langerin (E-17) from Santa Cruz. The slides were then fixed, blocked and stained.
For muscle immunofluorescent images, quadriceps and gastrocnemius were harvested, embedded in OCT and directly frozen. Sections (8μm) were fixed with cold acetone for 5 minutes and blocked with 2% rat serum and 1% BSA in PBS before staining. Anti-GFP-Alexa-488 serum (Invitrogen) and AlexaFluor647-conjugated anti-CD3e (17A2) were used to visualize GFP and T cells.
DAPI (Vector Laboratories) staining was used for nuclei labeling. Images were obtained with an upright wide-field microscope (Nikon) and analyzed with NisElements software and with a Zeiss LSM780 confocal microscope.
Flow cytometry analysis
Intestines were harvested, cleaned and rinsed twice with cold PBS. Once cleaned, they were transferred to 0.5% BSA (Sigma-Aldrich) PBS supplemented with 20mM EDTA (Fisherbrand) and cut into small pieces and incubated for ~45 minutes in ice with vigorous agitation every 10 – 15 minutes. Intestinal crypts were enriched by filtration through a 100μm cell strainer (Fisherbrand). The intestines were further filtered through a 70μm cell strainer to remove mucus. The crypts were dissociated by digestion with 1x Accutase (Gibco) for 3 minutes at 37°C. Cells were then stained and washed for flow cytometry analysis. They were again filtered using a 70μm cell strainer immediately before analysis.
For flow cytometry analysis of the skin, we followed a protocol adapted from a previously established protocol from the Fuchs lab. Briefly, the back of the mice was shaved, and fur was completely removed by using depilatory cream. Skin back was harvested, and placed in cold PBS after the underlying fat was removed. PBS was removed and replaced with 1x Trypsin-EDTA (Invitrogen) and skins were then placed at 37°C for 35 minutes and the epidermis was mechanically separated from the dermis by scrapping with a scalpel to obtain single cell suspensions. Cells were filtered using a 70μm cell strainer and stained for flow cytometry analysis. For flow cytometry analysis of Lrig1 cells in the skin, Thermolysin (R&D) was used for tissue digestion at 0.25mg/ml for 45 min at 37C as previously established by the Watt lab. The cells were stained used goat anti-Lrig1 (R7D) and anti-goat IgG-AlexaFluor647 (Invitrogen).
Ovaries were harvested and placed in 1x Trypsin-EDTA (Invitrogen). After cutting in small pieces, they were placed at 37°C for ~20 minutes. After ob taining a single cell suspension by mechanically disrupting the tissue, RBC lysis was performed and cells were filtered through a 70μm cell strainer. Samples were stained with appropriate antibodies for flow cytometry analysis.
Mammary glands were harvested and placed into 1.5mg/ml collagenase I (Sigma) and 10 μg/ml DNase I (Roche) in 10% FBS supplemented HBSS (Invitrogen). After cut in small pieces, they were kept at 37°C for 45 minutes. To enrich for organoids, th e samples were briefly centrifuged at 1,200 rpm for 3 minutes. They were digested with 1x Accutase (Gibco) at 37°C for 5 minutes, washed and filtered through a 70 μm cell strainer. After RBC lysis, cells were stained for flow cytometry analysis.
LNs were mechanically disrupted in flow buffer (PBS containing 0.5% BSA and 2mM EDTA) to obtain a single cell suspension. After filtration using 70μm cell strainer (Fisherbrand), red blood cells (RBC) in the spleen were lysed with RBC lysis buffer (eBioscience) for 3 minutes.
Skeletal muscles (gastrocnemious, soleous and quadriceps) were digested in 1mg/ml collagenase IV (Sigma-Aldrich) and 0.2mg/ml Dispase (Sigma-Aldrich) in 10% FBS HBSS for 40 minutes at 37°C and similarly filtered through a 70 μM cell strainer and RBC were lysed for 3 minutes.
Samples were stained with: CD45 (30-F11) APC-Alexa780 and eFluor450, CD8 (53–6.7)-PerCPCy5.5 and PE, CD3e (145-2C11)-PE, H2-Kb (AF6-88.5.5.3)-APC, H2-Kd (SF1-1.1.1)-PE, APC and biotin, CD24 (M1/69)-PE and eFluor450, alpha-6-integrin (GoH3)-APC and PerCPCy5.5, Sca1 (D7)-FITC and APC, CD31 (390)-FITC, Vcam (429)-PE, CD34 (RAM34)-biotin, streptavidin PE and APC-Alexa780 from eBioscience. Anti-mouse beta-2-microglubulin (S19.8)-PE was from Santa Cruz Laboratories. DAPI (Sigma-Aldrich) or LIVE/DEAD® Fixable Blue Dead Cell Stain Kit (Life Technologies) was used to stain dead cells.
For proliferation analysis tissues were stained with Hoechst33342, Ki67 or BrdU. For Hoechst33342 staining, 10μg/ml was used for 40 min at 37C. For intranuclear staining of Ki67 cells were fixed and permeabilized with FoxP3 buffer set from eBiosciences and stained with either anti-mouse Ki67 (SolA15)-PE or FITC. For BrdU labeling, mice were intraperitoneally injected with BrdU (1mg/kg of body weight) 2 h prior to harvesting the samples. After obtaining a single cell suspension, BrdU staining kit (BD Pharmingen) was used following manufacturer’s indications.
LSR-Fortessa (BD) was used to acquire the samples and FlowJo® was used to analyze the data.
Regulatory T cell depletion
Lgr5-GFP mice were injected with 500 μg of anti-CD25 (clone PC61) or a rat isotype IgG control both from Bio X Cell by tail vein injection. Five days later, depletion was ensured by flow cytometry analysis of CD4 (GK1.5)-FITC and CD25 (PC61)-PerCP-Cy5.5 in blood obtained by clipping the tail. At day five Jedi CD8+ T cells were transferred.
T cell proliferation in vitro
Lgr5+ HF cells were isolated from Lgr5-GFP mice during telogen, CD45− Sca1+ GFP+ epidermal cells were isolated from Sca1-GFP mice, muscle GFP+ CD45+ and GFP+ satellite cells were isolated from actin-GFP mice. Cells were isolated by flow cytometry sorting to achieve high purity. Jedi T cells were isolated as described above and stained with Brilliant Violet 450 proliferation dye (Invitrogen) following the manufacturer’s instructions. Cells were co-cultured in 96-well round bottom plates for 4 – 5 days in RPMI 1640 media (Gibco) supplemented with 10% FBS and 1% penicillin/streptamicin (Gibco).
Cardiotoxin treatment
Animals were injected with 5 μg of Cardiotoxin (Sigma) in 10 μl of PBS per muscle. Tibialis, gastrocnemius and quadriceps from the left leg were injected by using a Hamilton syrenge.
Tamoxifen treatment
Animals were intraperitoneally injected with 100 μl of a solution of Tamoxifen (Sigma) in corn oil (Sigma) at a concentration of 20 mg/ml. Pax7-CreERT2xCAG-GFP mice were injected 5 consecutive days and Krt14-CreERT2 were injected only 2 consecutive days.
NK cell activation and killing assay
HFSCs (CD45− CD34+ Sca1− H2Kb-/low) and keratinocytes (CD45− CD34− Sca1+ H2Kb+) were flow sorted at high purity and co-cultured with total blood leukocytes from littermates. The blood was collected the previous day, red blood cells were lysed and leukocytes were cultured in complete DMEM with 5ng/ml of IL-2 for 16h. YAC-1 cell line (a gift from Dr Bhardwaj) was used as a positive control. Equal numbers of HFSCs, keratinocytes and YAC-1 cells were co-cultured with blood leukocytes at a ratio 1:50. CD107a (1D4B)-APC antibody (0.5ug/ml) and Monensin 1x both from BD Biosciences were added at the beginning of the culture. The cells were harvested and stained for analysis 6 hours later.
mRNA expression analysis
Skin from P35 and P49 Lgr5-GFP mice were harvested and processed as described above. GFP+ CD45− cells were collected directly in Trizol LS (Qiagen) and the RNA was then extracted with miRNeasy Mini kit (Qiagen) following the manufacturer’s instructions. For detection of the Jedi T cells by qPCR, skin was harvested and directly frozen in dry ice prior to homogenization in Trizol (Qiagen) by mechanical disruption by using the Tissue Disruptor (Qiagen) and the RNA was then extracted following the manufacturer’s instructions.
For qPCR, 0.1 – 1 μg total RNA was reverse-transcribed for 1 h at 37 °C using RNA-to-cDNA kit (Applied Biosystems). qPCR was performed using the SYBR green qPCR master mix 2x (Fermentas, Thermo Scientific).
For RNA-seq of the telogen and anagen HFSCs, we isolated GFP+ cells from the epidermis of Lgr5-GFP mice directly into Trizol. Total RNA was extracted and RNA integrity and concentration was determined on the Agilent 2100 Bioanalyzer (Agilent; Palo Alto, CA, USA). 20ng of total RNA was pre-amplified using the Nugen Ovation RNA-seq System 2 (Nugen, San Carlos, CA), and then prepared for sequencing on the Illumina platform using the Tru-seq RNA Library Prep V2 (Illumina, San Diego, CA). The barcoded samples were multiplexed and sequenced on an Illumina NextSeq 550 to a depth of at least 50,000,000 reads per sample. The reads were mapped using RNA Dashboard software, as previously. Normalized gene expression levels were calculated by RPKM using exon mapping reads. Differential expression of transcripts between Lgr5+ Anagen and Telogen cells was assessed using DESeq2. Transcripts were identified as significantly different between the two conditions if they had a Benjamini-Hochberg adjusted p value less than 0.001, a log2 fold change greater than 1.4, and a mean expression value greater than 2 FPKM across all samples. Differential genes represented in the Venn diagram from the other studies were identified either by a Student’s T-test p value less than 0.05 and a log2 fold change greater than 1 for Wang et. al., or by the authors label of significance for Lay et. al.
Nucleofection of epidermal cells
Skin from wild-type mice in telogen was harvested and processed into single cell suspension as described above. CD34+ (HFSCs) and keratynocytes (CD34-CD45-) were flow cytometry-sorted. 25 μg of plasmid expressing GFP alone, Nlrc5-GFP (gift from Dr. Kobayashi) were used for nucleofection of ~500,000 cells, using Cell Line Nucleofector Kit L and the Amaxa Nucleofector II device (Lonza). Cells were cultured in DMEM/F12 media (Gibco) supplemented with 10% FBS, 1% pen/strep and 0.1% insulin-transferrin (Gibco).
QUANTIFICATION AND STATISTICAL ANALYSIS
To assess differences between groups we first used Fisher test for Variance to discern whether our samples followed a Normal distribution. When our samples did not follow a Normal distribution, we used Mann-Whitney test. A P value < 0.05 was considered statistically significant.
Supplementary Material
Highlights.
Lgr5+ intestinal, ovary, and mammary stem cells are subject to T cell clearance.
Hair follicle and muscle stem cells evade detection and killing by innate and adaptive immunity.
Hair follicle and muscle stem cells downregulate Nlrc5 and MHC class I presentation in their quiescent state.
Expression of Nlrc5 upregulates MHC class I on hair follicle stem cells.
Acknowledgments
We thank Marc Feldmann (U. Oxford), Daniel Schramek (U. Toronto), Ken Lau (Vanderbilt), Adeeb Rahman (Icahn School of Medicine), and Mark Lebwohl and Emma Guttman (Mount Sinai) for helpful discussions and Albert Ruzo for technical assistance. B.D.B. and M.M. were supported by NIH R01AI104848, R01AI113221, R21OD020185, and R01DK106593. J.A. was supported by the Robin Chemers Neustein Award, and a Juvenile Diabetes Research Foundation (JDRF) postdoctoral fellowship.
Footnotes
Publisher's Disclaimer: This is a PDF file of an unedited manuscript that has been accepted for publication. As a service to our customers we are providing this early version of the manuscript. The manuscript will undergo copyediting, typesetting, and review of the resulting proof before it is published in its final citable form. Please note that during the production process errors may be discovered which could affect the content, and all legal disclaimers that apply to the journal pertain.
CONTRIBUTIONS
J.A. designed and performed experiments, analyzed data and wrote the manuscript, E.S.P., E.A., R.S., M.D and A.B. performed experiments, S.R. and R.S. analyzed data, K.S.K provided reagents, M.M. designed experiments, analyzed data, supervised research, and edited the manuscript, B.D.B. designed and supervised the research, analyzed data and wrote the manuscript.
DECLARATION INTERESTS
The authors declare no competing interests.
References
- Agudo J, Ruzo A, Park ES, Sweeney R, Kana V, Wu M, Zhao Y, Egli D, Merad M, Brown BD. GFP-specific CD8 T cells enable targeted cell depletion and visualization of T-cell interactions. Nat Biotechnol. 2015;33:1287–1292. doi: 10.1038/nbt.3386. [DOI] [PMC free article] [PubMed] [Google Scholar]
- Ali N, Zirak B, Rodriguez RS, Pauli ML, Truong HA, Lai K, Ahn R, Corbin K, Lowe MM, Scharschmidt TC, et al. Regulatory T Cells in Skin Facilitate Epithelial Stem Cell Differentiation. Cell. 2017;169:1119–1129.e11. doi: 10.1016/j.cell.2017.05.002. [DOI] [PMC free article] [PubMed] [Google Scholar]
- Ankrum JA, Ong JF, Karp JM. Mesenchymal stem cells: immune evasive, not immune privileged. Nat Biotechnol. 2014:1–9. doi: 10.1038/nbt.2816. [DOI] [PMC free article] [PubMed] [Google Scholar]
- Barker N. Adult intestinal stem cells: critical drivers of epithelial homeostasis and regeneration. Nat Rev Mol Cell Biol. 2014;15:19–33. doi: 10.1038/nrm3721. [DOI] [PubMed] [Google Scholar]
- Barker N, van Es JH, Kuipers J, Kujala P, van den Born M, Cozijnsen M, Haegebarth A, Korving J, Begthel H, Peters PJ, et al. Identification of stem cells in small intestine and colon by marker gene Lgr5. Nature. 2007;449:1003–1007. doi: 10.1038/nature06196. [DOI] [PubMed] [Google Scholar]
- Barker N, Ridgway RA, van Es JH, van de Wetering M, Begthel H, van den Born M, Danenberg E, Clarke AR, Sansom OJ, Clevers H. Crypt stem cells as the cells-of-origin of intestinal cancer. Nature. 2009;457:608–611. doi: 10.1038/nature07602. [DOI] [PubMed] [Google Scholar]
- Beerman I, Seita J, Inlay MA, Weissman IL, Rossi DJ. Quiescent hematopoietic stem cells accumulate DNA damage during aging that is repaired upon entry into cell cycle. Cell Stem Cell. 2014;15:37–50. doi: 10.1016/j.stem.2014.04.016. [DOI] [PMC free article] [PubMed] [Google Scholar]
- Blanpain C, Fuchs E. Plasticity of epithelial stem cells in tissue regeneration. Science (80-.) 2014;344:1242281–1242281. doi: 10.1126/science.1242281. [DOI] [PMC free article] [PubMed] [Google Scholar]
- Blokzijl F, de Ligt J, Jager M, Sasselli V, Roerink S, Sasaki N, Huch M, Boymans S, Kuijk E, Prins P, et al. Tissue-specific mutation accumulation in human adult stem cells during life. Nature. 2016;538:260–264. doi: 10.1038/nature19768. [DOI] [PMC free article] [PubMed] [Google Scholar]
- Brack AS, Rando TA. Tissue-specific stem cells: lessons from the skeletal muscle satellite cell. Cell Stem Cell. 2012;10:504–514. doi: 10.1016/j.stem.2012.04.001. [DOI] [PMC free article] [PubMed] [Google Scholar]
- Busch K, Rodewald HR. Unperturbed vs. post-transplantation hematopoiesis. Curr Opin Hematol. 2016;23:295–303. doi: 10.1097/MOH.0000000000000250. [DOI] [PMC free article] [PubMed] [Google Scholar]
- Chen DS, Mellman I. Oncology meets immunology: the cancer-immunity cycle. Immunity. 2013;39:1–10. doi: 10.1016/j.immuni.2013.07.012. [DOI] [PubMed] [Google Scholar]
- Chidgey AP, Boyd RL. Immune privilege for stem cells: not as simple as it looked. Cell Stem Cell. 2008;3:357–358. doi: 10.1016/j.stem.2008.09.011. [DOI] [PubMed] [Google Scholar]
- Clevers H. STEM CELLS. What is an adult stem cell? Science. 2015;350:1319–1320. doi: 10.1126/science.aad7016. [DOI] [PubMed] [Google Scholar]
- Codega P, Silva-Vargas V, Paul A, Maldonado-Soto AR, Deleo AM, Pastrana E, Doetsch F. Prospective identification and purification of quiescent adult neural stem cells from their in vivo niche. Neuron. 2014;82:545–559. doi: 10.1016/j.neuron.2014.02.039. [DOI] [PMC free article] [PubMed] [Google Scholar]
- Cui J, Zhu L, Xia X, Wang HY, Legras X, Hong J, Ji J, Shen P, Zheng S, Chen ZJ, et al. NLRC5 negatively regulates the NF-kappaB and type I interferon signaling pathways. Cell. 2010;141:483–496. doi: 10.1016/j.cell.2010.03.040. [DOI] [PMC free article] [PubMed] [Google Scholar]
- Drukker M, Katz G, Urbach A, Schuldiner M, Markel G, Itskovitz-Eldor J, Reubinoff B, Mandelboim O, Benvenisty N. Characterization of the expression of MHC proteins in human embryonic stem cells. Proc Natl Acad Sci U S A. 2002;99:9864–9869. doi: 10.1073/pnas.142298299. [DOI] [PMC free article] [PubMed] [Google Scholar]
- Flesken-Nikitin A, Hwang CI, Cheng CY, Michurina TV, Enikolopov G, Nikitin AY. Ovarian surface epithelium at the junction area contains a cancer-prone stem cell niche. Nature. 2013;495:241–245. doi: 10.1038/nature11979. [DOI] [PMC free article] [PubMed] [Google Scholar]
- van der Flier LG, Clevers H. Stem cells, self-renewal, and differentiation in the intestinal epithelium. Annu Rev Physiol. 2009;71:241–260. doi: 10.1146/annurev.physiol.010908.163145. [DOI] [PubMed] [Google Scholar]
- Jaks V, Barker N, Kasper M, van Es JH, Snippert HJ, Clevers H, Toftgård R. Lgr5 marks cycling, yet long-lived, hair follicle stem cells. Nat Genet. 2008;40:1291–1299. doi: 10.1038/ng.239. [DOI] [PubMed] [Google Scholar]
- Jan M, Snyder TM, Corces-Zimmerman MR, Vyas P, Weissman IL, Quake SR, Majeti R. Clonal evolution of preleukemic hematopoietic stem cells precedes human acute myeloid leukemia. Sci Transl Med. 2012;4:149ra118. doi: 10.1126/scitranslmed.3004315. [DOI] [PMC free article] [PubMed] [Google Scholar]
- Kissenpfennig A, Henri S, Dubois B, Laplace-Builhé C, Perrin P, Romani N, Tripp CH, Douillard P, Leserman L, Kaiserlian D, et al. Dynamics and function of Langerhans cells in vivo: dermal dendritic cells colonize lymph node areas distinct from slower migrating Langerhans cells. Immunity. 2005;22:643–654. doi: 10.1016/j.immuni.2005.04.004. [DOI] [PubMed] [Google Scholar]
- Lay K, Kume T, Fuchs E. FOXC1 maintains the hair follicle stem cell niche and governs stem cell quiescence to preserve long-term tissue-regenerating potential. Proc Natl Acad Sci U S A. 2016 doi: 10.1073/pnas.1601569113. [DOI] [PMC free article] [PubMed] [Google Scholar]
- Li N, Nakauka-Ddamba A, Tobias J, Jensen ST, Lengner CJ. Mouse Label-Retaining Cells Are Molecularly and Functionally Distinct From Reserve Intestinal Stem Cells. Gastroenterology. 2016;151:298–310.e7. doi: 10.1053/j.gastro.2016.04.049. [DOI] [PMC free article] [PubMed] [Google Scholar]
- Malladi S, Macalinao DG, Jin X, He L, Basnet H, Zou Y, de Stanchina E, Massagué J. Metastatic Latency and Immune Evasion through Autocrine Inhibition of WNT. Cell. 2016;165:45–60. doi: 10.1016/j.cell.2016.02.025. [DOI] [PMC free article] [PubMed] [Google Scholar]
- Mandal PK, Blanpain C, Rossi DJ. DNA damage response in adult stem cells: pathways and consequences. Nat Rev Mol Cell Biol. 2011;12:198–202. doi: 10.1038/nrm3060. [DOI] [PubMed] [Google Scholar]
- Martincorena I, Roshan A, Gerstung M, Ellis P, Van Loo P, Mclaren S, Wedge DC, Fullam A, Alexandrov LB, Tubio JM, et al. High burden and pervasive positive selection of somatic mutations in normal human skin. Science (80-.) 2015;348:880–887. doi: 10.1126/science.aaa6806. [DOI] [PMC free article] [PubMed] [Google Scholar]
- Mathew SJ, Hansen JM, Merrell AJ, Murphy MM, Lawson JA, Hutcheson DA, Hansen MS, Angus-Hill M, Kardon G. Connective tissue fibroblasts and Tcf4 regulate myogenesis. Development. 2011;138:371–384. doi: 10.1242/dev.057463. [DOI] [PMC free article] [PubMed] [Google Scholar]
- Meissner TB, Li A, Biswas A, Lee K, Liu Y, Bayir E, Iliopoulos D, van den Elsen PJ, Kobayashi KS. NLR family member NLRC5 is a transcriptional regulator of MHC class I genes. Proc Natl Acad Sci U S A. 2010;107:13794–13799. doi: 10.1073/pnas.1008684107. [DOI] [PMC free article] [PubMed] [Google Scholar]
- Meissner TB, Liu YJ, Lee KH, Li A, Biswas A, van Eggermond MCJA, van den Elsen PJ, Kobayashi KS. NLRC5 cooperates with the RFX transcription factor complex to induce MHC class I gene expression. J Immunol. 2012;188:4951–4958. doi: 10.4049/jimmunol.1103160. [DOI] [PMC free article] [PubMed] [Google Scholar]
- Méndez-Ferrer S, Michurina TV, Ferraro F, Mazloom AR, MacArthur BD, Lira SA, Scadden DT, Ma’ayan A, Enikolopov GN, Frenette PS. Mesenchymal and haematopoietic stem cells form a unique bone marrow niche. Nature. 2010;466:829–834. doi: 10.1038/nature09262. [DOI] [PMC free article] [PubMed] [Google Scholar]
- Metcalfe C, Kljavin NM, Ybarra R, de Sauvage FJ. Lgr5+ Stem Cells Are Indispensable for Radiation-Induced Intestinal Regeneration. Cell Stem Cell. 2014;14:149–159. doi: 10.1016/j.stem.2013.11.008. [DOI] [PubMed] [Google Scholar]
- Morris RJ, Liu Y, Marles L, Yang Z, Trempus C, Li S, Lin JS, Sawicki JA, Cotsarelis G. Capturing and profiling adult hair follicle stem cells. Nat Biotechnol. 2004;22:411–417. doi: 10.1038/nbt950. [DOI] [PubMed] [Google Scholar]
- Ng A, Tan S, Singh G, Rizk P, Swathi Y, Tan TZ, Huang RY, Leushacke M, Barker N. Lgr5 marks stem/progenitor cells in ovary and tubal epithelia. Nat Cell Biol. 2014;16:745–757. doi: 10.1038/ncb3000. [DOI] [PubMed] [Google Scholar]
- Orr MT, Lanier LL. Natural killer cell education and tolerance. Cell. 2010;142:847–856. doi: 10.1016/j.cell.2010.08.031. [DOI] [PMC free article] [PubMed] [Google Scholar]
- Page ME, Lombard P, Ng F, Göttgens B, Jensen KB. The Epidermis Comprises Autonomous Compartments Maintained by Distinct Stem Cell Populations. Cell Stem Cell. 2013;13:471–482. doi: 10.1016/j.stem.2013.07.010. [DOI] [PMC free article] [PubMed] [Google Scholar]
- Pamer E, Cresswell P. Mechanisms of MHC class I–restricted antigen processing. Annu Rev Immunol. 1998;16:323–358. doi: 10.1146/annurev.immunol.16.1.323. [DOI] [PubMed] [Google Scholar]
- Paus R, Nickoloff BJ, Ito T. A “hairy” privilege. Trends Immunol. 2005;26:32–40. doi: 10.1016/j.it.2004.09.014. [DOI] [PubMed] [Google Scholar]
- Piontek GE, Taniguchi K, Ljunggren HG, Grönberg A, Kiessling R, Klein G, Kärre K. YAC-1 MHC class I variants reveal an association between decreased NK sensitivity and increased H-2 expression after interferon treatment or in vivo passage. J Immunol. 1985;135:4281–4288. [PubMed] [Google Scholar]
- Plaks V, Brenot A, Lawson DA, Linnemann JR, Van Kappel EC, Wong KC, de Sauvage F, Klein OD, Werb Z. Lgr5-Expressing Cells Are Sufficient And Necessary for Postnatal Mammary Gland Organogenesis. Cell Rep. 2013;3:70–78. doi: 10.1016/j.celrep.2012.12.017. [DOI] [PMC free article] [PubMed] [Google Scholar]
- Purbhoo MA, Irvine DJ, Huppa JB, Davis MM. T cell killing does not require the formation of a stable mature immunological synapse. Nat Immunol. 2004;5:524–530. doi: 10.1038/ni1058. [DOI] [PubMed] [Google Scholar]
- Quarta M, Brett JO, DiMarco R, De Morree A, Boutet SC, Chacon R, Gibbons MC, Garcia VA, Su J, Shrager JB, et al. An artificial niche preserves the quiescence of muscle stem cells and enhances their therapeutic efficacy. Nat Biotechnol. 2016;34:752–759. doi: 10.1038/nbt.3576. [DOI] [PMC free article] [PubMed] [Google Scholar]
- Rosenberg SA, Restifo NP. Adoptive cell transfer as personalized immunotherapy for human cancer. Science (80-.) 2015;348:62–68. doi: 10.1126/science.aaa4967. [DOI] [PMC free article] [PubMed] [Google Scholar]
- Sakaue-Sawano A, Kurokawa H, Morimura T, Hanyu A, Hama H, Osawa H, Kashiwagi S, Fukami K, Miyata T, Miyoshi H, et al. Visualizing spatiotemporal dynamics of multicellular cell-cycle progression. Cell. 2008;132:487–498. doi: 10.1016/j.cell.2007.12.033. [DOI] [PubMed] [Google Scholar]
- Setiady YY, Coccia JA, Park PU. In vivo depletion of CD4+FOXP3+ Treg cells by the PC61 anti-CD25 monoclonal antibody is mediated by FcγRIII+ phagocytes. Eur J Immunol. 2010;40:780–786. doi: 10.1002/eji.200939613. [DOI] [PubMed] [Google Scholar]
- Staehli F, Ludigs K, Heinz LX, Seguín-Estévez Q, Ferrero I, Braun M, Schroder K, Rebsamen M, Tardivel A, Mattmann C, et al. NLRC5 deficiency selectively impairs MHC class I-dependent lymphocyte killing by cytotoxic T cells. J Immunol. 2012;188:3820–3828. doi: 10.4049/jimmunol.1102671. [DOI] [PubMed] [Google Scholar]
- Stucci S, Palmirotta R, Passarelli A, Silvestris E, Argentiero A, Lanotte L, Acquafredda S, Todisco A, Silvestris F. Immune-related adverse events during anticancer immunotherapy: Pathogenesis and management (Review) Oncol Lett. 2017;14:5671–5680. doi: 10.3892/ol.2017.6919. [DOI] [PMC free article] [PubMed] [Google Scholar]
- Swijnenburg RJ, Schrepfer S, Govaert JA, Cao F, Ransohoff K, Sheikh AY, Haddad M, Connolly AJ, Davis MM, Robbins RC, et al. Immunosuppressive therapy mitigates immunological rejection of human embryonic stem cell xenografts. Proc Natl Acad Sci U S A. 2008;105:12991–12996. doi: 10.1073/pnas.0805802105. [DOI] [PMC free article] [PubMed] [Google Scholar]
- Tang C, Weissman IL, Drukker M. Immunogenicity of in vitro maintained and matured populations: potential barriers to engraftment of human pluripotent stem cell derivatives. Methods Mol Biol. 2013;1029:17–31. doi: 10.1007/978-1-62703-478-4_2. [DOI] [PMC free article] [PubMed] [Google Scholar]
- Tian H, Biehs B, Warming S, Leong KG, Rangell L, Klein OD, de Sauvage FJ. A reserve stem cell population in small intestine renders Lgr5-positive cells dispensable. Nature. 2013;478:255–259. doi: 10.1038/nature10408. [DOI] [PMC free article] [PubMed] [Google Scholar]
- Tran E, Ahmadzadeh M, Lu YC, Gros A, Turcotte S, Robbins PF, Gartner JJ, Zheng Z, Li YF, Ray S, et al. Immunogenicity of somatic mutations in human gastrointestinal cancers. Science (80-.) 2015;350:1387–1390. doi: 10.1126/science.aad1253. [DOI] [PMC free article] [PubMed] [Google Scholar]
- Turner JR. Intestinal mucosal barrier function in health and disease. Nat Rev Immunol. 2009;9:799–809. doi: 10.1038/nri2653. [DOI] [PubMed] [Google Scholar]
- Vasioukhin V, Degenstein L, Wise B, Fuchs E. The magical touch: genome targeting in epidermal stem cells induced by tamoxifen application to mouse skin. Proc Natl Acad Sci U S A. 1999;96:8551–8556. doi: 10.1073/pnas.96.15.8551. [DOI] [PMC free article] [PubMed] [Google Scholar]
- Wang L, Siegenthaler JA, Dowell RD, Yi R. Foxc1 reinforces quiescence in self-renewing hair follicle stem cells. Science. 2016;351:613–617. doi: 10.1126/science.aad5440. [DOI] [PMC free article] [PubMed] [Google Scholar]
- Westgate GE, Craggs RI, Gibson WT. Immune privilege in hair growth. J Invest Dermatol. 1991;97:417–420. doi: 10.1111/1523-1747.ep12481002. [DOI] [PubMed] [Google Scholar]
- Wilson A, Laurenti E, Oser G, van der Wath RC, Blanco-Bose W, Jaworski M, Offner S, Dunant CF, Eshkind L, Bockamp E, et al. Hematopoietic stem cells reversibly switch from dormancy to self-renewal during homeostasis and repair. Cell. 2008;135:1118–1129. doi: 10.1016/j.cell.2008.10.048. [DOI] [PubMed] [Google Scholar]
- Wood KJ, Issa F, Hester J. Understanding Stem Cell Immunogenicity in Therapeutic Applications. Trends Immunol. 2016;37:5–16. doi: 10.1016/j.it.2015.11.005. [DOI] [PubMed] [Google Scholar]
- Wu DC, Boyd AS, Wood KJ. Embryonic stem cells and their differentiated derivatives have a fragile immune privilege but still represent novel targets of immune attack. Stem Cells. 2008;26:1939–1950. doi: 10.1634/stemcells.2008-0078. [DOI] [PubMed] [Google Scholar]
- Yan KS, Chia LA, Li X, Ootani A, Su J, Lee JY, Su N, Luo Y, Heilshorn SC, Amieva MR, et al. The intestinal stem cell markers Bmi1 and Lgr5 identify two functionally distinct populations. Proc Natl Acad Sci. 2012;109:466–471. doi: 10.1073/pnas.1118857109. [DOI] [PMC free article] [PubMed] [Google Scholar]
Associated Data
This section collects any data citations, data availability statements, or supplementary materials included in this article.