

Abstract
The anterior limb of the internal capsule (ALIC) carries thalamic and brainstem fibers from prefrontal cortical regions that are associated with different aspects of emotion, motivation, cognition processing, and decision-making. This large fiber bundle is abnormal in several psychiatric illnesses and a major target for deep brain stimulation. Yet, we have very little information about where specific prefrontal fibers travel within the bundle. Using a combination of tracing studies and diffusion MRI in male nonhuman primates, as well as diffusion MRI in male and female human subjects, we segmented the human ALIC into five regions based on the positions of axons from different cortical regions within the capsule. Fractional anisotropy (FA) abnormalities in patients with bipolar disorder were detected when FA was averaged in the ALIC segment that carries ventrolateral prefrontal cortical connections. Together, the results set the stage for linking abnormalities within the ALIC to specific connections and demonstrate the utility of applying connectivity profiles of large white matter bundles based on animal anatomic studies to human connections and associating disease abnormalities in those pathways with specific connections. The ability to functionally segment large white matter bundles into their components begins a new era of refining how we think about white matter organization and use that information in understanding abnormalities.
SIGNIFICANCE STATEMENT The anterior limb of the internal capsule (ALIC) connects prefrontal cortex with the thalamus and brainstem and is abnormal in psychiatric illnesses. However, we know little about the location of specific prefrontal fibers within the bundle. Using a combination of animal tracing studies and diffusion MRI in animals and human subjects, we segmented the human ALIC into five regions based on the positions of axons from different cortical regions. We then demonstrated that differences in FA values between bipolar disorder patients and healthy control subjects were specific to a given segment. Together, the results set the stage for linking abnormalities within the ALIC to specific connections and for refining how we think about white matter organization in general.
Keywords: anatomic tracing, bipolar disorder, diffusion MRI, prefrontal cortex, white matter
Introduction
The anterior limb of the internal capsule (ALIC) carries thalamic and brainstem fibers from prefrontal cortical regions (PFC) that are associated with different aspects of emotion, motivation, cognition processing, and decision-making (Rushworth et al., 2011; Haber and Behrens, 2014). These cortical areas [the dorsomedial PFC (dmPFC), dorsolateral PFC (dlPFC), ventrolateral PFC (vlPFC), orbitofrontal cortex (OFC), dorsal anterior cingulate cortex (dACC), and ventromedial PFC (vmPFC)] are linked to several psychiatric illnesses (Mayberg, 1997; Callicott et al., 2000; Goldstein and Volkow, 2011; Nakamae et al., 2011). Importantly, these diseases are not only linked with abnormal gray matter structure, but also with abnormal white matter (WM; Cannistraro et al., 2007; Ardekani et al., 2011; Huang et al., 2011; Phillips and Swartz, 2014). Yet, unlike gray matter, we know very little about how WM is organized. In particular, although we know that each WM bundle carries multiple cortical connections, we do not know where each connection is localized within a bundle. This limits our ability to link abnormalities to specific connections. Changes in ALIC integrity are among the most widely reported WM abnormalities in obsessive–compulsive disorder, addiction, bipolar disorder (BD), and depression (McIntosh et al., 2008; Benedetti et al., 2011; Lin et al., 2012; Lochner et al., 2012; Rosenberger et al., 2012), and the ALIC is a surgical target for several disorders (Greenberg et al., 2010).
We recently showed that ALIC axons from different OFC areas are organized based on their medial/lateral cortical origin (Lehman et al., 2011; Jbabdi et al., 2013). Building on these previous finds, the studies reported here first demonstrate the trajectories of fibers from all PFC regions to the ALIC and their positions within it in nonhuman primates (NHPs). The results showed that the dorsal and lateral PFC fibers use more complex trajectories, traversing larger white matter regions to reach the ALIC compared with ventral PFC fibers. To test whether these fibers have the same topology in the human ALIC using diffusion magnetic resonance imaging (dMRI), we first investigated how well dMRI streamlines followed the correct paths using a small set of experiments with both tracing and dMRI data in the same animal. By matching the seed placement with the location of injection sites, we could determine the correct streamlines to follow and thus identify systematic dMRI errors for the streamlines traversing the WM and entering the ALIC. This information was particularly important for using dMRI tractography to determine whether the fiber organization was similar in the human ALIC, which we tested on data from the Human Connectome Project (HCP). Using this cross-species, cross-modal information (NHP tracing, NHP dMRI in the same animal, and dMRI in humans), we segmented the human ALIC based on the positions of axons from different cortical regions within the capsule. Finally, we used those results to explore the extent to which differences in fractional anisotropy (FA) values between BD patients and healthy control subjects were specific to a given segment of the ALIC.
The tracing results show that fibers from different cortical locations travel to and are positioned within the ALIC in a predictable manner based on their cortical origin. Fibers follow specific trajectories that are linked to their relative dorsoventral (DV), anteroposterior (AP), and mediolateral (ML) positions in cortex. Tractography demonstrates a similar organization to and through the ALIC in both NHPs and humans. Importantly, the tracing experiments were critical for identifying the correct dMRI streamlines to follow to the ALIC. Based on the location of fibers from different cortical regions, the ALIC is segmented into five regions: vmPFC/OFC fibers, vlPFC fibers, dlPFC fibers, dACC fibers, and dmPFC fibers. Finally, abnormalities in FA values in the ALIC in BD patients compared with control subjects are associated specifically with connections of the left vlPFC. Together, these analyses show that the main PFC–subcortical bundle, the ALIC, is segmented into regions based on specific connections and that these data can be used to understand abnormal connectivity in disease.
Materials and Methods
Experimental design
We first charted the fiber pathways following tracer injections placed throughout the PFC using a combination of our extensive library of previous experiments and six new experiments in which the same animals received both tracer injections and high-resolution ex vivo dMRI. Based on the tracer experiments, we determined the organization of fibers within the ALIC and divided it into five segments according to where fibers from different frontal regions were located. Generating seeds in each NHP dMRI data set to match the injection site placements, we then compared the streamlines and fiber pathways in the same animal to create an accurate dMRI map of streamlines through the ALIC. Using the dMRI from the HCP, we then placed seeds in homologous regions of the human brain. The NHP data provided guidance for following the correct streamlines. The human ALIC was then divided in the five segments. Finally, we tested whether there were differences in FA values between the five segments in BD patients.
Anatomical tracing experiments
All animals were adult male macaque monkeys (Macaca nemestrina, Macaca fascicularis, and Macaca mulatta). Anterograde or bidirectional tracers were injected into six cortical regions: vmPFC (areas 25, 10, and subgenual ACC), dACC (area 24), dmPFC (medial area 9 and dorsal area 10), dlPFC (areas 46 and lateral 9), vlPFC (areas 44, 45, and 12/47), and OFC (areas 11 and 13). All experiments were performed in accordance with the Institute of Laboratory Animal Resources Guide for the Care and Use of Laboratory Animals and approved by the University Committee on Animal Resources.
Details of the surgical and histological procedures have been described previously (Haber et al., 2006; Lehman et al., 2011; Haynes and Haber, 2013). Monkeys received an injection of one or more of the following anterograde/bidirectional tracers: Lucifer yellow (LY), fluororuby (FR), or fluorescein (FS) conjugated to dextran amine [40–50 nl, 10% in 0.1 m phosphate buffer (PB), pH 7.4; Invitrogen] or tritiated amino acids (100 nl, 1:1 solution of [3H] leucine and [3H]-proline in dH2O, 200 mCi/ml; NEN). Tracers were pressure-injected over 10 min using a 0.5 μl Hamilton syringe. After each injection, the syringe remained in situ for 20–30 min. Twelve to 14 days after surgery, animals were initially anesthetized with ketamine (10 mg/kg, i.m.) and deeply anesthetized and perfused with saline, followed by a 4% paraformaldehyde/1.5% sucrose solution in 0.1 m PB, pH 7.4. Brains were postfixed overnight and cryoprotected in increasing gradients of sucrose (10, 20, and 30%). Brains were removed and shipped to the Martinos Center for Biomedical Imaging. dMRI data were collected in a small-bore 4.7T Bruker BioSpin MRI system, with a gradient internal diameter of 116 mm, a maximum gradient strength of 480 mT/m, and a birdcage volume radiofrequency (RF) RF coil internal diameter of 72 mm. The brains were scanned while submerged in Fomblin solution to eliminate susceptibility artifacts at air–tissue interfaces and background signal. A two-shot echo-planar imaging (EPI) sequence was used for dMRI: TR, 750 ms; TE, 43 ms; δ = 15 ms; Δ = 19 ms; bmax = 40,000 s/mm2; 514 gradient directions; matrix size, 96 × 96 × 112; 0.7 mm isotropic resolution. The brains were shipped back to Rochester for histological processing for each tracer.
Serial sections of 50 μm were cut on a freezing microtome, and immunocytochemistry was performed on free-floating sections (one in eight for each tracer) to visualize LY, FR, and FS tracers. Before incubation in primary antisera, tissue was treated with 10% methanol and 3% hydrogen peroxide in 0.1 M PB to inhibit endogenous peroxidase activity, rinsed in PB with 0.3% Triton X-100 (TX; Sigma), and preincubated in 10% normal goat serum (NGS) and 0.3% TX in PB for 30 min. Tissue was placed in the primary anti-LY (1:3000 dilution; Invitrogen), anti-FS (1:1000; Invitrogen), and anti-FR (1:1000; Invitrogen) in 10% NGS and 0.3% TX in PB for 4 nights at 4°C. After extensive rinsing, the tissue was incubated in biotinylated secondary antibody, followed by incubation with the avidin–biotin complex solution (Vectastain ABC kit; Vector Laboratories). Immunoreactivity was visualized using standard 3,3-diaminobenzidine tetra-hydrochloride (DAB) procedures. Staining was intensified by incubating the tissue for 5–15 min in a solution of 0.05% DAB, 0.025% cobalt chloride, 0.02% nickel ammonium sulfate, and 0.01% H2O2 to yield a black reaction product. Sections were mounted onto gel-coated slides, dehydrated, defatted in xylenes, and coverslipped with Permount. In cases in which more than one tracer was injected into a single animal, adjacent sections were processed for each antibody reaction. To visualize amino acid staining, sections were mounted on chrome-alum gelatin-subbed slides for autoradiography. Sections were defatted in xylene for 1 h and dipped in Kodak NTB 2 photographic emulsion. Exposure time of the autoradiograms ranged from 6 to 9 weeks. The sections were then developed in Kodak D for 2.5 min, fixed, washed, and counterstained with cresyl violet.
Data analysis.
Sixty-five (of 156) PFC injection sites were selected for analysis based on the following criteria: (1) localized injection site without contamination into adjacent cortical regions or into WM; (2) outstanding transport; and (3) low background (Fig. 1). Under dark-field microscopy, outlines of the brain sections and the fibers traveling to the ALIC in bundles were outlined with a 4.0 or 6.4× objective, respectively, using Neurolucida software (MBF Bioscience; RRID:SCR_001775). Orientation was indicated for each bundle by charting individual fibers (at 10×) within each outline. Axons were charted as they left the tracer injection site and followed to and through the ALIC. The 2D outlines were combined across slices to create 3D renderings of the pathways using IMOD software (Boulder Laboratory for 3-Dimensional Electron Microscopy of Cells and the Regents of the University of Colorado, RRID:SCR_003297; Kremer et al., 1996). This was done for each case separately and then registered to a reference model to compare the relationship between fiber positions from the different cortical regions.
Figure 1.

Injection site locations are shown: frontal (A), orbital (B), and sagittal (C) views of cortex. Placements are 8 in vmPFC (red), 12 in OFC (cream), 3 in frontal pole (pink), 11 in dACC (yellow), 4 in dmPFC (green), 14 in dlPFC (blue), and 7 in vlPFC (teal).
Overall, the results showed a clear organization based on the relative DV, AP, and ML cortical positions of the injection sites. To test the hypothesis that the relative cortical position determines the location of fibers in the ALIC, we paired cases in which the injection sites differed in only one of the three axes (DV, AP, ML) varied, but had similar positions along the other two axes. Twelve pairs of injection sites were chosen for illustration: 7 for the DV axis, 4 for the AP axis, and 1 for the ML axis.
The NHP dMRI data were processed with the FSL software package to reduce distortions induced by eddy currents (Andersson et al., 2016) and to perform probabilistic tractography with the ball-and-stick model (Behrens et al., 2007; RRID:SCR_002823). Seed masks for each of the injection sites were drawn on the dMRI data of one of the NHPs, which was aligned to the remaining NHPs using a combination of linear and nonlinear registration. The seed masks were transformed to the space of each individual NHP and used to transform the cortical masks into the individual macaque scans. Each mask was then edited to ensure the placement was located in precisely the correct DV, AP, and ML position of the injection site. Tractography from each seed mask was performed using FSL PROBTRACKX. The threshold for each probabilistic tractography map was chosen to include streamlines going through the correct position in the ALIC, while eliminating as many false streamlines as possible.
We used publicly available in vivo dMRI data from 34 healthy young adults, collected as part of the MGH–USC HCP (Fan et al., 2016). The data had been acquired at the Martinos Center for Biomedical Imaging on the Connectom scanner, a Siemens Skyra 3T MRI system equipped with a 64-channel head array coil and the AS302 whole-body gradient array featuring a maximum strength of 300 mT/m and slew rate 200 T/m/s K (Setsompop et al., 2013). The dMRI sequence was 2D EPI: TR, 8800 ms; TE, 57 ms; bmax = 10,000 s/mm2; 512 gradient directions; 40 interspersed b = 0 volumes; volume size, 140 × 140 × 96; 1.5 mm isotropic resolution. The interspersed b = 0 volumes were used to estimate rigid motion. The data were already preprocessed to reduce artifacts because of head motion and eddy currents. Each cortical mask was hand drawn in the FMRIB58 FA template space in regions considered to be overall homologous to the NHP brain (Chiavaras and Petrides, 2000; Ongür and Price, 2000; Petrides, 2005; Petrides et al., 2012; Frey et al., 2014). A nonlinear registration was performed between that space and each individual's native diffusion space. Masks were used as seeds for probabilistic tractography with FSL in each individual. As with NHP data, some editing in individual space was necessary to ensure that the seed was positioned in the correct DV, AP, and ML locations. The distributions were thresholded to retain streamlines that were considered accurate (i.e., followed a similar organization as that in the animal studies) while reducing those that were considered inaccurate (i.e., were not present in the anatomical tracing data). We transformed each subject's path probability distribution from individual diffusion space to the template space. Finally, we computed the expected value of the coordinates of the path centroid in the internal capsule (coronal slice y = 137).
dMRI analysis in individuals with BD.
We compared 34 adults with a diagnosis of BD type I, currently in remission [mean (SD) age, 34.8 (7.8); male/female (M/F), 11/23; mean (SD) illness duration, 15 (7.8) years; mean (SD) age of illness onset, 20 (6.6) years old], and 30 age- and gender-matched adults with no history of Axis-1 diagnoses [control (CONT), mean (SD) age, 32.4 (6.4); M/F, = 12/18; for further details on this sample, see Versace et al. (2008, 2014)]. At the time of the scan, adults with BD did not have active symptoms of illness [remission; mean (SD) 25-item Hamilton Rating Scale for Depression (Hamilton, 1960), 6.7 (4.7); mean (SD) Young Rating Scale for Mania (Young et al., 1978), 2.3 (2.4)]. dMRI scans were acquired using single-shot, spin-EPI (double spin echo, bipolar gradients) on a 3T Siemens Trio at the Magnetic Resonance Research Center (University of Pittsburgh Medical Center Health System, Pittsburgh, PA). A standard body coil was used for RF transmission, whereas the magnetic resonance signal was acquired with a Siemens 12-channel receive-only coil. The gradient coil set achieves 40 mT/m maximum amplitude and a slew rate of 200 mT/m/s. The combination of the array coils and multiple RF receivers enables the use of parallel imaging techniques, reducing the total scan time (up to 40%) and, therefore, the EPI-based distortions (Bammer et al., 2002). Restraining foam pads were used for minimizing head motion. Sixty-one optimized, non-collinear diffusion gradient directions were acquired along with seven b = 0 images (interleaved every nine non-collinear images). Planes were parallel to the anterior commissure – posterior commissure (AC–PC) line (TR, 8400 ms; TE, 90 ms; bandwidth, 1860 Hz/Px; flip angle, 90; field of view, 256 × 256; sixty-four 2-mm-thick slices; no gaps; matrix size, 128 × 128; EPI factor, 128; acquisition duration: 9 min, 56 s).
The lower spatial and angular resolution of these data would not allow the precise delineation of small bundles in each individual as it was performed in the HCP data. Therefore, we followed an ROI-based approach to analyzing the data from the BD study. Using the findings from the HCP subjects as a guide, the ALIC was divided into five ROIs in the space of the FMRIB58 FA template. The four dorsal ROIs represented the regions most likely to carry fibers of vlPFC (ventrolateral ALIC), dlPFC (dorsolateral ALIC), dACC (ventromedial ALIC), and mPFC. The ventral ROI represented the region most likely to carry fibers of vmPFC. Each patient and control from the BD study was registered to the FMRIB58 FA template using ANTS (Advanced Normalization Tools). The inverse of this registration was applied to map the mask of each of the ten ALIC segments (five for each hemisphere) to the individual and compute the mean FA value in each mask. Mean FA values were then exported into SPSS for statistical analysis.
Statistical analysis
HCP data.
We used paired t tests on the coordinates of the bundle centroids within each subject to test for the existence of a topology similar to the one we had found in the tracing data. Each test involved a pair of bundles and a specific hypothesis on their relative position, i.e., bundle A is dorsal to bundle B, hence the tests were one-sided. The HCP data are publicly available, which facilitates replication.
BD versus CONT data.
Differences in demographic and clinical characteristics between BD and CONT were tested using independent sample t tests. The same statistics were used for average translation/rotation. A multivariate multiple regression analysis was used to examine the main effect of group (BD, CONT) on mean FA in all 10 ALIC segments, covarying for age and gender. Head motion did not significantly differ between BD and CONT (average translation: t(62) = 1.7, p = 0.093; average rotation: t(62) = 1.6, p = 0.114). To determine the extent to which each ALIC segment contributed to the observed main effect of group, post hoc independent t tests were used to compare FA between groups for each of the 10 ALIC segments, using a false discovery rate (FDR) correction to control for the 10 parallel tests. We also performed a group comparison of the average FA in the entire ALIC.
Results
Overview
Based on the position of cortical fibers in the NHP anatomical tracing data, the ALIC can be segmented into five general regions: three dorsoventral areas and two mediolateral ones. vmPFC/OFC fibers occupy the ventralmost part of the ALIC, including small fascicles embedded within the ventral striatum. dACC and vlPFC fibers travel dorsal to the vmPFC/OFC fibers and within the main part of the ALIC. dACC fibers travel medial to the vlPFC fibers. dmPFC and dlPFC fibers travel the most dorsally, with dmPFC axons located medial to those from the dlPFC. Combining the tracing results with dMRI analysis in the NHPs helped to identify which tractography streamlines follow the correct path to the ALIC and which reach the ALIC through an incorrect path and hence must be eliminated. After eliminating the streamlines that did not agree with the anatomical tracing, a similar organization of bundles within the ALIC could be demonstrated using dMRI. Analysis of the HCP dMRI data also show a similar organization of streamlines in the human ALIC. Finally, this segmentation could be used to demonstrate that BD patients have significantly lower FA values than controls in the left ALIC region that carries vlPFC fibers.
Trajectories and general features of cortical projections through the ALIC
The tracing experiments show precisely how fibers leave the cortex and travel to the ALIC, and their position within it. Fibers from all injection sites (Fig. 1) exit the gray matter and form a dense, compact bundle that travels in the center of the underlying WM, referred to as a “stalk” (Krieg, 1973; Fig. 2). The stalk contains not only fibers traveling to the ALIC but also those traveling to the striatum, external and extreme capsules, and the corpus callosum (CC; Schmahmann and Pandya, 2006). The stalks from injection sites anterior to the ventricle and striatum travel directly through the WM such that those from the ventral surface of the PFC travel dorsally, those from the dorsal surface travel ventrally, those from the lateral surface travel medially, and those from the medial surface travel laterally (Fig. 2A). The emergence of the ventricle and striatum requires fibers to circumvent these structures (Fig. 2B). As the stalk enters the corona radiata, it splits into three bundles: callosal fibers, striatal fibers, and capsular fibers (Fig. 2C–F). Axons traveling to the CC most often separate first and continue as a separate bundle to enter the CC. Fibers traveling to the capsules separate into two groups: those entering the ALIC and those entering the external/extreme capsules. Axons from each cortical area remain clustered together as they enter and travel through the capsule. However, in addition to traveling within the main body of the capsule, some descending axons also travel within small fascicles adjacent and ventral to the main body of the capsule and, therefore, should be considered part of the capsule (Fig. 2G).
Figure 2.

Stalks and splits. A–C, Coronal sections demonstrating how fibers leave the injection sites in a compact bundle (stalk) and split into three bundles carrying callosal, striatal, and capsular fibers. D–F, dPFC fibers travel ventrally (D), vmPFC fibers move dorsally (E), and vlPFC fibers travel medially (F). Note, as each stalk enters the WM, it splits into three bundles. G, Fibers from the dACC travel both in the main body of the ALIC and within small fascicles medial to it. Scale bars, 2 mm.
Comparison with dMRI
To test whether pathways shown with the tracing experiments could be followed correctly using dMRI, in terms of both their trajectory from the cortex to the ALIC and their position within the ALIC, we generated seeds in each NHP dMRI data set in the same positions as the injection sites (Figs. 3, 4A,B). Overall, streamlines leave the seed region and travel through the WM in a position similar to the stalks seen in the tracing studies, splitting into separate bundles. Each seed also produced streamlines that did not exist in the histological material. In particular, fibers to the ALIC from dorsal cortical areas curve around the dorsolateral caudate and enter the ALIC as they split from fibers traveling to the external and extreme capsules. The tractography bundle that represents these fibers is found in the correct location in the dMRI data. However, an incorrect branch also enters the striatum and travels medial or perpendicular to the ALIC, in the subcallosal WM, and in a more dorsal position in the ALIC (Fig. 4B). This striatal branch is unlikely to represent the true cortico-striatal connection, as it is incorrectly positioned in the striatum (Haber et al., 2006). Importantly, there was a similar pattern with dMRI tractography in the human brain (Fig. 4C,D). Here, as in the NHP, tractography follows the correct trajectory, curving around the striatum, with fibers splitting off as they enter the ALIC. However, it also shows the same incorrect bundle, with some streamlines traveling medial or perpendicular to the ALIC, within the striatum, in the subcallosal WM, and in the dorsal ALIC.
Figure 3.
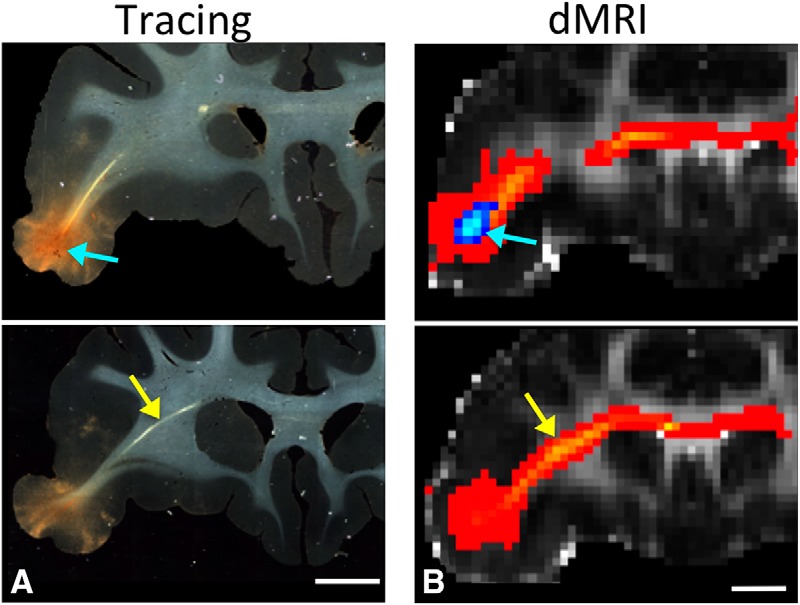
Anatomic tracing and dMRI. Histology and dMRI showing the injection site (A) and seed placement in vlPFC (B) (blue arrows) in the same animal. Fiber pathways and streamlines (yellow arrows) at the same position in a more caudal section. Scale bar, 5 mm. Scale bar, 4.9 mm. (Note that the difference between A and B in the scale bar is attributable to voxel size.)
Figure 4.

A, Histology showing fiber pathways after an injection site in the dACC. Scale bar, 5 mm. B, NHP dMRI streamlines generated from a seed at the injection site location from A. Scale bar, 4.9 mm. The coronal levels match those shown in A. Correct streamlines are indicated with yellow arrows and incorrect streamlines with blue arrows. C, D, Human dMRI data illustrating streamlines after placement of a seed in a similar area of vlPFC. Based on the NHP data, yellow arrows show the likely correct streamlines and blue arrows show the likely incorrect ones. Scale bars, 10 mm.
Fiber organization within the ALIC
The dorsoventral axis
Fibers that originate from dorsal cortical regions are positioned in the capsule dorsal to those that originate from more ventral positions, thus maintaining a dorsoventral topography throughout the capsule (Fig. 5). Three sets of injection sites demonstrate this: medial wall sites: areas 9, 24, and medial 14 (Fig. 5Ai); vlPFC sites: areas 45 and 47 (Fig. 5Bi); and dlPFC sites: areas 9 and 46 (Fig. 5Ci). Axons from areas 24 and 9 enter the dorsal part of the capsule, with those from area 24 entering the capsule rostrally, followed caudally by fibers from area 9. This positions area 9 fibers dorsal to axons from area 24. In contrast, axons from area 14 enter the capsule ventrally and move dorsally as they travel to the thalamus. Here, and throughout the ALIC, these three pathways occupy a DV topography that reflects their DV points of origin in the cortex. Fibers from lateral areas also obey this DV topology, which reflects their relative DV cortical positions (Fig. 5Bi,Ci).
Figure 5.

The dorsoventral fiber organization in the ALIC. A, Fibers from the medial wall (green, area 9m; yellow, area 24; red, area 14m); B, fibers from vlPFC (green, area 45; red, area 47); C, fibers from dlPFC (green, area 46d; red, area 46v). i, NHP tracing data derived from the 3-D model, illustrating the injection site and fibers from coronal and sagittal views; ii, NHP dMRI data, illustrating the seed placement and streamlines from coronal and sagittal views; iii, HCP data illustrating the seed placement and streamlines from coronal and sagittal views in humans; iv, Examples of the centroids of the dMRI tractography streamlines in six representative individuals. Scale bars: NHP histology, 5 mm; NHP dMRI, 4.9 mm; human, 10 mm.
NHP dMRI tractography streamlines from seeds placed in the same positions as the tracer injections on the medial wall in areas 9, 24, and 14 show a similar organization, with those from the dorsal cortical areas traveling dorsal to those from more ventral regions (Fig. 5Aii). Seeds placed in homologous regions in the human dMRI showed a similar DV organization, with streamlines from mPFC positioned dorsal to dACC and those from area 14 traveling most ventrally (Fig. 5Aiii). Streamlines in both NHPs and humans generated from the vlPFC and dlPFC seeds also show a similar pattern as the tracing experiments (Fig. 5Bii–Biii, Fig. 5Cii–Ciii). Those from the dorsal seed travel dorsal to those from the ventral seeds and maintain their relative positions within the capsule. Indeed, these results were remarkably robust across human subjects (Fig. 5Ai–Civ). Based on one-sided paired t tests on the coordinates of the path centroids within the ALIC of the HCP subjects, centroids were positioned more dorsally within the ALIC for area 9 paths compared with area 24 paths (t(33) = 13.9, p = 1.2e-15), area 24 paths compared with area 14 paths (t(33) = 16.6, p = 6.6e-18), area 46d paths compared with area 46v paths (t(33) = 5.0, p = 8.7e-06), and area 45 paths compared with area 47 paths (t(33) = 11.4, p = 3.1e-13).
The anteroposterior axis
The topology that governs the AP axis depends on the dorsal versus ventral origin of the fibers: fibers from more anterior regions of the dorsal cortex enter the capsule rostrally to those from more posterior regions and thus travel ventral to them. This creates an anteroventral/posterodorsal topography (Fig. 6Ai). In contrast, the topography from the ventral cortical areas is reversed. That is, fibers from anterior, ventral cortical areas are positioned dorsal to fibers from more posterior, ventral areas. Although axons from more anterior parts of the ventral cortex also enter the capsule before those from more posterior regions, the more anterior fibers move dorsally through the capsule AP. Thus, topography is reversed, creating an anterodorsal/posteroventral organization (Fig. 6Bi). The switch is gradual and occurs approximately midway between the dorsoventral axis, and it appears to be related to the direction of fiber travel (ventral or dorsal) to reach the corpus callosum.
Figure 6.

The anteroposterior fiber organization in the ALIC. A, Fibers from anterior and posterior regions of dorsomedial cortex (green, area dorsal 10; red, area medial 9); B, fibers from ventromedial cortex (green, area ventral 10; red, area medial 14). i, NHP tracing data derived from the 3-D model, illustrating the injection sites and fibers from coronal and sagittal views; ii, NHP dMRI data, illustrating the seed placement and streamlines from coronal and sagittal views; iii, HCP data illustrating the seed placement and streamlines in humans, from coronal and sagittal views; iv, Examples of the centroids of the dMRI tractography streamlines in six representative individuals.
Tractography streamlines from seeds placed in NHP dMRI data in the same positions as the NHP AP injection sites showed the same organization as the tracing experiments (Fig. 6Ai–Bii). Streamlines from anterior, dorsal regions entered the capsule dorsally and moved ventrally, followed by streamlines from more posterior, dorsal seeds. In contrast, those from anterior, ventral seeds entered the capsule from the ventral surface and moved dorsally, followed by the streamlines from more posterior, ventral seeds. These patterns were also demonstrated in the human dMRI (Fig. 6Ai–Biii). As with the DV organization, the results were consistent across individual subjects (Fig. 6Ai–Biv). Based on one-sided paired t tests on the coordinates of the path centroids within the ALIC of the HCP subjects, centroids of paths from area 9 medial, i.e., posterior dorsomedial cortex, were positioned significantly more dorsally within the ALIC than those of paths from area 10 dorsal, i.e., anterior dorsomedial cortex (t(33) = 6.1, p = 3.7e-07). On the other hand, centroids of paths from area 14 medial, i.e., posterior ventromedial cortex, were positioned significantly more ventrally within the ALIC than those of paths from area 10 ventral, i.e., anterior ventromedial cortex (t(33) = 8.6, p = 3.0e-10).
The mediolateral axis
Similar to the AP axis, the ML organization of fibers in the ALIC differs between fibers originating in dorsal versus ventral cortical regions. Axons from medial, dorsal regions enter and travel within the capsule medial to those from more lateral regions (Fig. 7A). Thus, these fibers maintain a simple ML organization. However, because of the compression of the capsule into a relatively narrow fiber bundle, there is considerable overlap between axons from medial and lateral regions. The dMRI tractography streamlines generated from seeds placed in the dorsal cortical areas demonstrated the difficulty in reconstructing the ML topography in NHPs because of the limited spatial resolution of dMRI and the compressed ALIC. However, this organization could be observed in the human dMRI data (Fig. 7B,C), but with somewhat lower statistical significance than the DV and AP organization. Based on one-sided paired t tests on the coordinates of the path centroids within the ALIC of the HCP subjects, centroids of paths from area 24 were positioned significantly more medially within the ALIC than those of paths from area 45 (t(33) = 2.9, p = 0.003). In contrast, we have previously demonstrated that medial fibers from the ventral surface of the brain (OFC and vmPFC; Lehman et al., 2011) are organized in a mediodorsal/lateroventral topography. That is, axons from medial regions are positioned within the capsule dorsal to those from more lateral positions. Moreover, this organization was also more easily demonstrated in human brains (Jbabdi et al., 2013).
Figure 7.

The mediolateral fiber organization in the ALIC. A, B, Fibers from medial and lateral cortex: A, areas 24 (red) and 45 (blue, monkey); B, areas 24 (red) and 46 (blue, HCP). C, Examples of the centroids of the dMRI tractography streamlines in six representative individuals. Note that in the NHP tracing data, the lateral injection site was somewhat ventral to the medial injection site. Scale bars: NHP, 5 mm; human, 10 mm.
Topological overview
Segmentation of the ALIC
Based on the tracing and dMRI data, we divided the human ALIC into five regions (Fig. 8). The ventralmost segment, embedded within the ventral striatum and anterior commissure, is the region that carries fibers from the vmPFC and OFC. Dorsal to this region is the main part of the ALIC, which is further divided into four areas. The ventral half contains fibers from the vlPFC laterally and the dACC medially. The dorsal half contains fibers from the dlPFC laterally and the dmPFC medially. However, because of partial volume effects in the dMRI data and the compression of the ALIC fibers, there is considerable overlap between medial and lateral fibers. The results are summarized in Table 1. Figure 9 illustrates all of the above findings on the relative positions of bundles in the human ALIC. The plots show the centroid coordinates of the dMRI tractography streamlines in the ALIC for each of the 34 HCP subjects. Each column of plots shows the centroids of streamlines from a different pair of seed regions, with each pair exemplifying a different topology based on the relative position of two seed regions in cortex (DV, AP, ML). The top row of plots shows the absolute coordinates of the centroids in the ALIC in template space, for each pair of bundles. The bottom row of plots shows the relative coordinates the centroids, i.e., the difference between the coordinates of the first and second bundle in each pair. In each plot of the bottom row, when a data point falls in the top left quadrant, the centroid of the first bundle lies dorsal/lateral to the centroid of the second bundle, and, therefore, that subject's bundles exhibit the corresponding topological invariance. For the ML topology, which requires the higher spatial resolution to demonstrate, the mean and SD of the distance between centroids of bundles from dorsal and ventral cortical regions within the ALIC was 1.83 ± 1.30 mm along the ML axis, i.e., comparable to the 1.5 mm voxel width of the HCP dMRI data. As seen from the plots (and confirmed by the paired t tests reported above), the topological invariance is remarkable across the 34 HCP subjects. Importantly, even in cases where there is considerable overlap between the first and second bundles of different subjects, the topological invariance of the two bundles (within subject) still hold.
Figure 8.
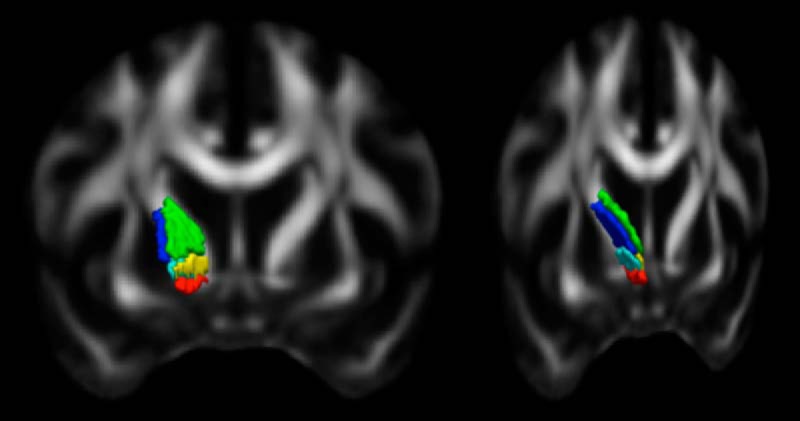
Segmentation of the ALIC. The five segments carry fibers from different areas of cortex (coronal view): red, vmPFC/OFC; yellow, dACC; green, dmPFC; teal, vlPFC; blue, dlPFC.
Table 1.
Overview of the topologies that were tested and p values from paired t test in the 34 HCP subjects
| DV axis | Bundles from cortical area | 9m | Travel within the ALIC more | Dorsal | Than bundles from cortical area | 24 | p < 10−14 |
| 24 | Dorsal | 14m | p < 10−17 | ||||
| 46d | Dorsal | 46v | p < 10−5 | ||||
| 45 | Dorsal | 47 | p < 10−12 | ||||
| AP axis | 9m | Dorsal | 10d | p < 10−6 | |||
| 10v | Dorsal | 14m | p < 10−9 | ||||
| ML axis | 45 | Lateral | 24 | p < 0.0035 |
Figure 9.

Topological overview. The centroid coordinates of the dMRI tractography streamlines in the ALIC are shown for all 34 HCP subjects. Each column of plots shows the centroids of streamlines from a different pair of seed regions, with each pair exemplifying the different topologies based on the relative position of two seed regions in cortex (DV, AP, ML). The top row of plots shows the absolute coordinates of the centroids of two bundles in the ALIC in template space (green and red for the first and second regions in each pair, respectively). The bottom row of plots shows the relative coordinates the centroids: when a data point falls in the top left quadrant, the centroid of the first bundle lies dorsolateral to the centroid of the second bundle, and, therefore, that subject's bundles adhere to the corresponding topology.
Individuals with BD versus CONT
There were no significant between-group differences in any demographic and head motion variables. As expected, when compared with control subjects, adults with BD reported higher levels of depressive and manic symptoms on the day of the neuroimaging procedure (t(62) = 5.2, p < 0.001 and t(62) = 3.7, p < 0.001, respectively; independent sample t tests). A multivariate ANOVA was used to examine the main effect of group and segment, and group × segment interaction, during FA in the five segments of ALIC bilaterally (n = 10 dependent variables). Exploratory analyses were performed in the 34 adults with BD only to explore the potential effects of age of illness onset, illness duration, symptom severity, lifetime number of manic episodes, lifetime number of depressive episodes, and use of psychotropic medications (i.e., on/off antidepressants, on/off mood stabilizers, on/off antipsychotics, on/off anxiolytics) at the time of the scan during FA. Age and gender were entered in all analyses as covariates. Multivariate AVOVA revealed a main effect of group (Wilks' lambda value of 0.665; F(10,50) = 2.5, p = 0.015, ANOVA) during FA in all 10 (5 per hemisphere, with OFC and vmPFC merged) segments of the ALIC. After covering for age and gender, 10 parallel AVOVAs were performed to determine the extent to which each ALIC segment contributed to the main effect of group. These analyses revealed that adults with BD had significantly lower FA in the segment of the left ALIC that carries vlPFC fibers (F(1,62) = 7.5 p = 0.05, FDR corrected, ANOVA), but not in any other segments of the left or right ALIC (Fig. 10, Table 2). Furthermore, there were no significant between-group differences in mean FA across the entire left ALIC or in mean FA across the entire right ALIC (Table 3).
Figure 10.
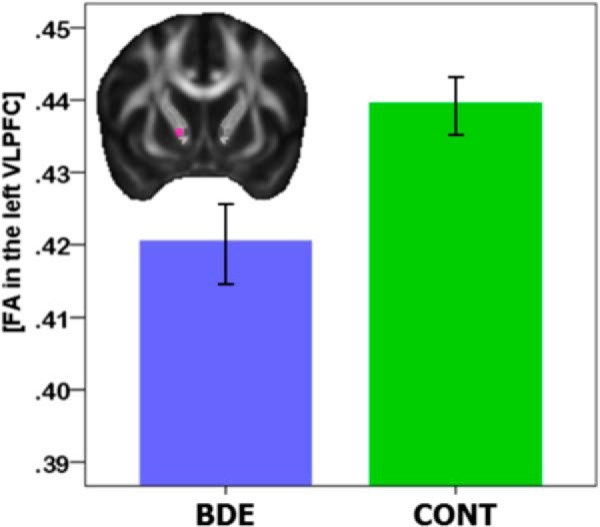
Mean FA values in the vlPFC segment of the left anterior limb in 34 adults with a diagnosis of BD and 30 age- and gender-matched normal control (CONT) adults.
Table 2.
Comparisons of FA between 34 adults with BD and 30 age- and gender-matched normal human controls (HC) in all 10 segments of the ALIC
| ALIC segment | Mean difference (BD-HC) | SD | Sig. | FDR | Cohens' d |
|---|---|---|---|---|---|
| Right dACC | −0.019 | 0.047 | 0.139 | 0.348 | −0.4 |
| Right dlPFC | 0.001 | 0.028 | 0.929 | 0.929 | 0.0 |
| Right dmPFC | 0.001 | 0.030 | 0.871 | 0.929 | 0.0 |
| Right vlPFC | −0.011 | 0.036 | 0.281 | 0.468 | −0.3 |
| Right vmOFC_PFC | 0.001 | 0.034 | 0.894 | 0.929 | 0.0 |
| Left dACC | −0.012 | 0.033 | 0.269 | 0.468 | −0.3 |
| Left dlPFC | −0.010 | 0.022 | 0.139 | 0.348 | −0.5 |
| Left ldmPFC | −0.015 | 0.025 | 0.098 | 0.348 | −0.6 |
| Left vlPFC | −0.019 | 0.023 | 0.005 | 0.050 | −0.8 |
| Left vmOFC_PFC | 0.005 | 0.025 | 0.572 | 0.817 | 0.2 |
Table 3.
Comparisons of FA between 34 adults with BD and 30 age- and gender-matched normal controls in the entire left and right ALIC
| Sum of squares | df | Mean square | Sig. | |
|---|---|---|---|---|
| Left ALIC | 0.001 | 1.59 | 0.001 | 0.090 |
| Right ALIC | 0.000 | 1.59 | 0.000 | 0.506 |
Summary
Fibers from different cortical regions follow predictable trajectories to, and locations within, the ALIC based on NHP tracing experiments. Using the tracing experiments as guidance to identify which streamlines were correct, this organization could be clearly delineated in both NHP and human dMRI analyses. Based on these results, the ALIC was divided into five segments. The ventral component carries fibers of the vmPFC, which lie ventral to those of the OFC. The four dorsal components carry fibers of vlPFC (ventrolateral ALIC), dlPFC (dorsolateral ALIC), dACC (ventromedial ALIC), and mPFC (dorsomedial ALIC). Finally, we demonstrated the potential utility of these findings in identifying the specific connections associated with WM abnormalities in BD.
Discussion
Cortical research focuses primarily on gray matter and its parcellation, functional organization, and connectivity. Recent advancements in imaging methods have increased attention to WM and WM abnormalities in disease. However, our understanding of the brain's WM is limited compared with gray matter. Although we have a general understanding of the connections associated with large bundles, what is essentially missing is the delineation of where, within a given bundle, specific cortical fibers travel. Here, we focus on the organization of the ALIC, combining the precision of anatomical tracing experiments with dMRI, first in monkeys and then humans, to clearly define how cortical fibers enter and their positions within the ALIC. Fibers from each cortical region take a consistent and predictable route to reach and travel through the ALIC. The relative position of fibers from different cortical areas, within the ALIC, demonstrates the topology, and specifically the segmentation, based on PFC origin of fibers. Using these results, we found FA differences between BD patients compared with healthy control subjects that are specific to the ALIC region that carries vlPFC connections.
Methodological considerations
Similar to the organization of OFC ALIC fibers (Lehman et al., 2011), those from the dorsal and lateral PFC leave the cortical region and divide into three main bundles. However, fibers from the dorsal and lateral areas traverse larger WM regions and thus more complex areas of crossing fibers. We, therefore, combined dMRI in the same animals that also had tracer injections to identify the correct dMRI streamlines. Previous studies comparing tracer experiments with dMRI streamlines set a single dMRI signal threshold for all connections. Moreover, the tracing and dMRI are typically collected on separate groups of animals (Thiebaut de Schotten et al., 2012; Jbabdi et al., 2013; Thomas et al., 2014; Azadbakht et al., 2015; Jbabdi et al., 2015; Donahue et al., 2016). We focused on one major bundle, with the tracing and dMRI in the same animal. Therefore, we could set the threshold at a level to best match the streamlines with the actual location of fibers from the tracer studies. The streamlines replicated the trajectories of the fibers and their position within the ALIC remarkably well, creating confidence for the refined segmentation of the human ALIC. Thus, comparing the histology with the dMRI in the NHP provided a road map for determining which streamlines were the correct ones to follow in humans, helping to eliminate species differences as a potential confound. We also found that a single threshold for all streamlines from a given seed is unlikely to produce accurate results for all bundles originating in the same regions (Thomas et al., 2014). Together, the best approach for assessing the accuracy of dMRI data in humans is to evaluate each pathway separately in the context of known anatomic pathways.
The results from the BD study relied on previously collected dMRI data with low spatial and angular resolution and a single, moderate b value. Hence, we limited ourselves to an ROI-based analysis of FA. This is the first step in demonstrating how the segmentation of large WM bundles can allow us to detect connectivity changes in disease. In the future, the dMRI data that are currently being collected by disease studies with HCP protocols will allow more sophisticated analyses. This includes delineating the components of the ALIC in each individual patient with tractography or comparing WM microstructural measures that do not rely on the tensor model but require data to be collected with multiple b values. Furthermore, it would be possible to use the careful delineation of bundles that we performed in high-quality HCP data as prior information to reconstruct the same bundles in routine-quality, clinical data automatically.
Together, the results set the stage for linking abnormalities within the ALIC to specific connections. This is in contrast to the commonly used approaches to group analysis of FA, either by sampling FA on the “skeleton” of WM (Smith et al., 2006) or by averaging FA within a cross section of a large WM pathway (Yendiki et al., 2016). Neither of these approaches discriminates between the multiple connections carried within a large WM pathway. The procedure for functionally segmenting a large WM bundle into its components begins a new era of refining how we think about WM organization and use that information in understanding WM abnormalities.
Topological invariance as an organizational principle of the ALIC
The vmPFC, OFC, dACC, dlPFC, and vlPFC are associated with different aspects of motivation and cognition involved in attributing value to stimuli, associating that value with choices, and selecting an action plan to obtain a preferred outcome, respectively (Rushworth et al., 2011; Haber and Behrens, 2014). Fibers that originate from these cortical regions occupy specific locations within the ALIC as they travel to the thalamus and brainstem. Axons from ventral cortical regions (vmPFC and OFC) enter the capsule ventrally and occupy the most ventral portion of the capsule (Lehman et al., 2011). In contrast, axons from dorsal and lateral cortical regions (vlPFC, dlPFC, dACC, and dmPFC) enter the capsule dorsally and laterally and move ventrally. Importantly, despite the repositioning, fiber bundles do not change their positions relative to other bundles but maintain their DV topography. The vlPFC fibers are located dorsal to the OFC fibers but are concentrated laterally and ventrally within the ALIC, with fibers from the dlPFC located dorsally. Axons from the dACC and dmPFC occupy the medial aspect of the main ALIC, adjacent to, but overlapping, the vlPFC and dlPFC. Importantly, these positions reflect topological invariance rather than a precise location for each pathway. That is, for example, fibers from more dorsal regions travel more dorsally within the capsule, fibers from more medial regions travel more medially, and fibers from the dorsoanterior areas travel ventral to those from more caudal regions. The topological invariance is the critical feature when translating the animal studies to the human brain, which has much greater individual differences. Our results show that the precise location of the bundles in template space is unlikely to be consistent across subjects but that the relative position of the bundles within a subject is. Therefore, the introduction of prior information on the relative positions of bundles and their surrounding anatomy into tractography (Yendiki et al., 2011, 2016) may be more appropriate for reconstructing a topology, compared with an approach that relies on perfect spatial alignment across subjects to map tract labels from a template.
Psychopathology and surgical targets
Several psychiatric disorders are linked to the vmPFC, OFC, dACC, vlPFC, and/or dlPFC, including abnormalities in the ALIC. Individuals with major depressive disorder, BD, OCD, schizophrenia, and substance use disorders all show a reduction in FA values in the ALIC (Zhou et al., 2003; Zhu et al., 2011; Lochner et al., 2012), suggesting changes in PFC connectivity with thalamic and brainstem regions. But without a regional analysis of the ALIC, FA value differences between disease and normal control subjects have not been linked to specific connections. Our findings enable us, for the first time, to link abnormalities in ALIC WM integrity to specific connections in patients with BD. Patients showed lower FA in the left ventrolateral ALIC, the region that most likely carries descending left vlPFC fibers that terminate in the central mediodorsal nucleus of the thalamus, the medial subthalamic nucleus, and the brainstem (Ray and Price, 1993; Haynes and Haber, 2013). Left vlPFC activity is abnormally increased during uncertain reward and outcome anticipation in BD patients relative to healthy individuals (Caseras et al., 2013; Chase et al., 2013). The present finding of connectivity changes in left vlPFC ALIC fibers suggests a structural basis for these results. Here, white matter structural ALIC abnormalities in individuals with BD in the region that carries left vlPFC fibers may be associated with abnormal left vlPFC glutamatergically mediated modulation of thalamus, subthalamic nucleus, and brainstem (Frankle et al., 2006). This may result, in turn, in abnormally elevated dopaminergic transmission in the ventral tegmental area and striatum and elevated brainstem–striatal–left vlPFC activity, especially in reward-related contexts.
The ALIC is a deep brain stimulation and lesion target for treatment-resistant OCD, depression, and addiction (Greenberg et al., 2010; Hurwitz et al., 2012; Sheehan et al., 2013). Previously, we demonstrated which vmPFC and OFC fibers are likely to be involved at different stimulation sites in the ventral ALIC (Lehman et al., 2011). The data reported here show how stimulation or lesions in different locations throughout the ALIC is likely to impact on projections of different cortical areas, including the vlPFC, dlPFC, dACC, and dmPFC. In particular, an electrode contact or lesion targeting the ventralmost part of the ALIC will likely impact primarily fibers from the vmPFC and OFC. More dorsal contacts/lesions will impact lateral OFC/vlPFC/dACC fibers. The most dorsal contacts/lesions will impact primarily the dmPFC/dlPFC fibers. In addition to consideration of the dorsoventral position of electrodes or lesions, the rostrocaudal position is also important. Finally, given the narrow width of the ALIC, it is unlikely that a distinction can be made between the medial and lateral cortical fibers.
Footnotes
The anatomic tracing and animal imaging studies were supported by NIMH Grants MH045573 and MH106435. The clinical studies were supported by NIMH Grant MH103931. The diffusion MRI animal studies were performed in part using resources provided by the Center for Functional Neuroimaging Technologies (P41-EB015896) and involved the use of instrumentation supported by Shared Instrumentation Grants S10RR016811, S10RR023401, and S10RR019307. Data were provided in part by the MGH-USC Human Connectome Project (U01-MH093765), funded by the NIH Blueprint for Neuroscience Research.
The authors declare no competing financial interests.
References
- Andersson JLR, Sotiropoulos SN (2016) An integrated approach to correction for off-resonance effects and subject movement in diffusion MR imaging. Neuroimage 125:1063–1078. 10.1016/j.neuroimage.2015.10.019 [DOI] [PMC free article] [PubMed] [Google Scholar]
- Ardekani BA, Tabesh A, Sevy S, Robinson DG, Bilder RM, Szeszko PR (2010) Diffusion tensor imaging reliably differentiates patients with schizophrenia from healthy volunteers. Hum Brain Mapp 32:1–9. 10.1002/hbm.20995 [DOI] [PMC free article] [PubMed] [Google Scholar]
- Azadbakht H, Parkes LM, Haroon HA, Augath M, Logothetis NK, de Crespigny A, D'Arceuil HE, Parker GJ (2015) Validation of high-resolution tractography against in vivo tracing in the macaque visual cortex. Cereb Cortex 25:4299–4309. 10.1093/cercor/bhu326 [DOI] [PMC free article] [PubMed] [Google Scholar]
- Bammer R, Auer M, Keeling SL, Augustin M, Stables LA, Prokesch RW, Stollberger R, Moseley ME, Fazekas F (2002) Diffusion tensor imaging using single-shot SENSE-EPI. Magn Reson Med 48:128–136. 10.1002/mrm.10184 [DOI] [PubMed] [Google Scholar]
- Behrens TE, Berg HJ, Jbabdi S, Rushworth MF, Woolrich MW (2007) Probabilistic diffusion tractography with multiple fibre orientations: what can we gain? Neuroimage 34:144–155. 10.1016/j.neuroimage.2006.09.018 [DOI] [PMC free article] [PubMed] [Google Scholar]
- Benedetti F, Yeh PH, Bellani M, Radaelli D, Nicoletti MA, Poletti S, Falini A, Dallaspezia S, Colombo C, Scotti G, Smeraldi E, Soares JC, Brambilla P (2011) Disruption of white matter integrity in bipolar depression as a possible structural marker of illness. Biol Psychiatry 69:309–317. 10.1016/j.biopsych.2010.07.028 [DOI] [PubMed] [Google Scholar]
- Callicott JH, Bertolino A, Mattay VS, Langheim FJ, Duyn J, Coppola R, Goldberg TE, Weinberger DR (2000) Physiological dysfunction of the dorsolateral prefrontal cortex in schizophrenia revisited. Cereb Cortex 10:1078–1092. 10.1093/cercor/10.11.1078 [DOI] [PubMed] [Google Scholar]
- Cannistraro PA, Makris N, Howard JD, Wedig MM, Hodge SM, Wilhelm S, Kennedy DN, Rauch SL (2007) A diffusion tensor imaging study of white matter in obsessive-compulsive disorder. Depress Anxiety 24:440–446. 10.1002/da.20246 [DOI] [PubMed] [Google Scholar]
- Caseras X, Lawrence NS, Murphy K, Wise RG, Phillips ML (2013) Ventral striatum activity in response to reward: differences between bipolar I and II disorders. Am J Psychiatry 170:533–541. 10.1176/appi.ajp.2012.12020169 [DOI] [PMC free article] [PubMed] [Google Scholar]
- Chase HW, Nusslock R, Almeida JR, Forbes EE, LaBarbara EJ, Phillips ML (2013) Dissociable patterns of abnormal frontal cortical activation during anticipation of an uncertain reward or loss in bipolar versus major depression. Bipolar Disord 15:839–854. 10.1111/bdi.12132 [DOI] [PMC free article] [PubMed] [Google Scholar]
- Chiavaras MM, Petrides M (2000) Orbitofrontal sulci of the human and macaque monkey brain. J Comp Neurol 422:35–54. [DOI] [PubMed] [Google Scholar]
- Donahue CJ, Sotiropoulos SN, Jbabdi S, Hernandez-Fernandez M, Behrens TE, Dyrby TB, Coalson T, Kennedy H, Knoblauch K, Van Essen DC, Glasser MF (2016) Using diffusion tractography to predict cortical connection strength and distance: a quantitative comparison with tracers in the monkey. J Neurosci 36:6758–6770. 10.1523/JNEUROSCI.0493-16.2016 [DOI] [PMC free article] [PubMed] [Google Scholar]
- Fan Q, Witzel T, Nummenmaa A, Van Dijk KR, Van Horn JD, Drews MK, Somerville LH, Sheridan MA, Santillana RM, Snyder J, Hedden T, Shaw EE, Hollinshead MO, Renvall V, Zanzonico R, Keil B, Cauley S, Polimeni JR, Tisdall D, Buckner RL, et al. (2016) MGH-USC human connectome project datasets with ultra-high b-value diffusion MRI. Neuroimage 124:1108–1114. 10.1016/j.neuroimage.2015.08.075 [DOI] [PMC free article] [PubMed] [Google Scholar]
- Frankle WG, Laruelle M, Haber SN (2006) Prefrontal cortical projections to the midbrain in primates: evidence for a sparse connection. Neuropsychopharmacology 31:1627–1636. 10.1038/sj.npp.1300990 [DOI] [PubMed] [Google Scholar]
- Frey S, Mackey S, Petrides M (2014) Cortico-cortical connections of areas 44 and 45B in the macaque monkey. Brain Lang 131:36–55. 10.1016/j.bandl.2013.05.005 [DOI] [PubMed] [Google Scholar]
- Goldstein RZ, Volkow ND (2011) Dysfunction of the prefrontal cortex in addiction: neuroimaging findings and clinical implications. Nat Rev Neurosci 12:652–669. 10.1038/nrn3119 [DOI] [PMC free article] [PubMed] [Google Scholar]
- Greenberg BD, Rauch SL, Haber SN (2010) Invasive circuitry-based neurotherapeutics: stereotactic ablation and deep brain stimulation for OCD. Neuropsychopharmacology 35:317–336. 10.1038/npp.2009.128 [DOI] [PMC free article] [PubMed] [Google Scholar]
- Haber SN, Behrens TE (2014) The neural network underlying incentive-based learning: implications for interpreting circuit disruptions in psychiatric disorders. Neuron 83:1019–1039. 10.1016/j.neuron.2014.08.031 [DOI] [PMC free article] [PubMed] [Google Scholar]
- Haber SN, Kim KS, Mailly P, Calzavara R (2006) Reward-related cortical inputs define a large striatal region in primates that interface with associative cortical connections, providing a substrate for incentive-based learning. J Neurosci 26:8368–8376. 10.1523/JNEUROSCI.0271-06.2006 [DOI] [PMC free article] [PubMed] [Google Scholar]
- Hamilton M. (1960) A rating scale for depression. J Neurol Neurosurg Psychiatry 23:56–62. 10.1136/jnnp.23.1.56 [DOI] [PMC free article] [PubMed] [Google Scholar]
- Haynes WI, Haber SN (2013) The organization of prefrontal-subthalamic inputs in primates provides an anatomical substrate for both functional specificity and integration: implications for basal ganglia models and deep brain stimulation. J Neurosci 33:4804–4814. 10.1523/JNEUROSCI.4674-12.2013 [DOI] [PMC free article] [PubMed] [Google Scholar]
- Huang H, Fan X, Williamson DE, Rao U (2011) White matter changes in healthy adolescents at familial risk for unipolar depression: a diffusion tensor imaging study. Neuropsychopharmacology 36:684–691. 10.1038/npp.2010.199 [DOI] [PMC free article] [PubMed] [Google Scholar]
- Hurwitz TA, Honey CR, Allen J, Gosselin C, Hewko R, Martzke J, Bogod N, Taylor P (2012) Bilateral anterior capsulotomy for intractable depression. J Neuropsychiatry Clin Neurosci 24:176–182. 10.1176/appi.neuropsych.11080189 [DOI] [PubMed] [Google Scholar]
- Jbabdi S, Lehman JF, Haber SN, Behrens TE (2013) Human and monkey ventral prefrontal fibers use the same organizational principles to reach their targets: tracing versus tractography. J Neurosci 33:3190–3201. 10.1523/JNEUROSCI.2457-12.2013 [DOI] [PMC free article] [PubMed] [Google Scholar]
- Jbabdi S, Sotiropoulos SN, Haber SN, Van Essen DC, Behrens TE (2015) Measuring macroscopic brain connections in vivo. Nat Neurosci 18:1546–1555. 10.1038/nn.4134 [DOI] [PubMed] [Google Scholar]
- Kremer JR, Mastronarde DN, McIntosh JR (1996) Computer visualization of three-dimensional image data using IMOD. J Struct Biol 116:71–76. 10.1006/jsbi.1996.0013 [DOI] [PubMed] [Google Scholar]
- Krieg W. (1973) Architectonics of the human cerebral fiber systems. Evanston, IL: Brain Books. [Google Scholar]
- Lehman JF, Greenberg BD, McIntyre CC, Rasmussen SA, Haber SN (2011) Rules ventral prefrontal cortical axons use to reach their targets: implications for diffusion tensor imaging tractography and deep brain stimulation for psychiatric illness. J Neurosci 31:10392–10402. 10.1523/JNEUROSCI.0595-11.2011 [DOI] [PMC free article] [PubMed] [Google Scholar]
- Lin F, Zhou Y, Du Y, Qin L, Zhao Z, Xu J, Lei H (2012) Abnormal white matter integrity in adolescents with internet addiction disorder: a tract-based spatial statistics study. PLoS One 7:e30253. 10.1371/journal.pone.0030253 [DOI] [PMC free article] [PubMed] [Google Scholar]
- Lochner C, Fouché JP, du Plessis S, Spottiswoode B, Seedat S, Fineberg N, Chamberlain SR, Stein DJ (2012) Evidence for fractional anisotropy and mean diffusivity white matter abnormalities in the internal capsule and cingulum in patients with obsessive-compulsive disorder. J Psychiatry Neurosci 37:193–199. 10.1503/jpn.110059 [DOI] [PMC free article] [PubMed] [Google Scholar]
- Mayberg HS. (1997) Limbic-cortical dysregulation: a proposed model of depression. J Neuropsychiatry Clin Neurosci 9:471–481. 10.1176/jnp.9.3.471 [DOI] [PubMed] [Google Scholar]
- McIntosh AM, Muñoz Maniega S, Lymer GK, McKirdy J, Hall J, Sussmann JE, Bastin ME, Clayden JD, Johnstone EC, Lawrie SM (2008) White matter tractography in bipolar disorder and schizophrenia. Biol Psychiatry 64:1088–1092. 10.1016/j.biopsych.2008.07.026 [DOI] [PubMed] [Google Scholar]
- Nakamae T, Narumoto J, Sakai Y, Nishida S, Yamada K, Nishimura T, Fukui K (2011) Diffusion tensor imaging and tract-based spatial statistics in obsessive-compulsive disorder. J Psychiatr Res 45:687–690. 10.1016/j.jpsychires.2010.09.016 [DOI] [PubMed] [Google Scholar]
- Ongür D, Price JL (2000) The organization of networks within the orbital and medial prefrontal cortex of rats, monkeys and humans. Cereb Cortex 10:206–219. 10.1093/cercor/10.3.206 [DOI] [PubMed] [Google Scholar]
- Petrides M. (2005) Lateral prefrontal cortex: architectonic and functional organization. Philos Trans R Soc Lond B Biol Sci 360:781–795. 10.1098/rstb.2005.1631 [DOI] [PMC free article] [PubMed] [Google Scholar]
- Petrides M, Tomaiuolo F, Yeterian EH, Pandya DN (2012) The prefrontal cortex: comparative architectonic organization in the human and the macaque monkey brains. Cortex 48:46–57. 10.1016/j.cortex.2011.07.002 [DOI] [PubMed] [Google Scholar]
- Phillips ML, Swartz HA (2014) A critical appraisal of neuroimaging studies of bipolar disorder: toward a new conceptualization of underlying neural circuitry and a road map for future research. Am J Psychiatry 171:829–843. 10.1176/appi.ajp.2014.13081008 [DOI] [PMC free article] [PubMed] [Google Scholar]
- Ray JP, Price JL (1993) The organization of projections from the mediodorsal nucleus of the thalamus to orbital and medial prefrontal cortex in macaque monkeys. J Comp Neurol 337:1–31. 10.1002/cne.903370102 [DOI] [PubMed] [Google Scholar]
- Rosenberger G, Nestor PG, Oh JS, Levitt JJ, Kindleman G, Bouix S, Fitzsimmons J, Niznikiewicz M, Westin CF, Kikinis R, McCarley RW, Shenton ME, Kubicki M (2012) Anterior limb of the internal capsule in schizophrenia: a diffusion tensor tractography study. Brain Imaging Behav 6:417–425. 10.1007/s11682-012-9152-9 [DOI] [PMC free article] [PubMed] [Google Scholar]
- Rushworth MF, Noonan MP, Boorman ED, Walton ME, Behrens TE (2011) Frontal cortex and reward-guided learning and decision-making. Neuron 70:1054–1069. 10.1016/j.neuron.2011.05.014 [DOI] [PubMed] [Google Scholar]
- Schmahmann J, Pandya D (2006) Fiber pathways of the brain. New York: Oxford UP. [Google Scholar]
- Setsompop K, Kimmlingen R, Eberlein E, Witzel T, Cohen-Adad J, McNab JA, Keil B, Tisdall MD, Hoecht P, Dietz P, Cauley SF, Tountcheva V, Matschl V, Lenz VH, Heberlein K, Potthast A, Thein H, Van Horn J, Toga A, Schmitt F, et al. (2013) Pushing the limits of in vivo diffusion MRI for the human connectome project. Neuroimage 80:220–233. 10.1016/j.neuroimage.2013.05.078 [DOI] [PMC free article] [PubMed] [Google Scholar]
- Sheehan JP, Patterson G, Schlesinger D, Xu Z (2013) Gamma knife surgery anterior capsulotomy for severe and refractory obsessive-compulsive disorder. J Neurosurg 119:1112–1118. 10.3171/2013.5.JNS13201 [DOI] [PubMed] [Google Scholar]
- Smith SM, Jenkinson M, Johansen-Berg H, Rueckert D, Nichols TE, Mackay CE, Watkins KE, Ciccarelli O, Cader MZ, Matthews PM, Behrens TE (2006) Tract-based spatial statistics: voxelwise analysis of multi-subject diffusion data. Neuroimage 31:1487–1505. 10.1016/j.neuroimage.2006.02.024 [DOI] [PubMed] [Google Scholar]
- Thiebaut de Schotten M, Dell'Acqua F, Valabregue R, Catani M (2012) Monkey to human comparative anatomy of the frontal lobe association tracts. Cortex 48:82–96. 10.1016/j.cortex.2011.10.001 [DOI] [PubMed] [Google Scholar]
- Thomas C, Ye FQ, Irfanoglu MO, Modi P, Saleem KS, Leopold DA, Pierpaoli C (2014) Anatomical accuracy of brain connections derived from diffusion MRI tractography is inherently limited. Proc Natl Acad Sci U S A 111:16574–16579. 10.1073/pnas.1405672111 [DOI] [PMC free article] [PubMed] [Google Scholar]
- Versace A, Almeida JR, Hassel S, Walsh ND, Novelli M, Klein CR, Kupfer DJ, Phillips ML (2008) Elevated left and reduced right orbitomedial prefrontal fractional anisotropy in adults with bipolar disorder revealed by tract-based spatial statistics. Arch Gen Psychiatry 65:1041–1052. 10.1001/archpsyc.65.9.1041 [DOI] [PMC free article] [PubMed] [Google Scholar]
- Versace A, Andreazza AC, Young LT, Fournier JC, Almeida JR, Stiffler RS, Lockovich JC, Aslam HA, Pollock MH, Park H, Nimgaonkar VL, Kupfer DJ, Phillips ML (2014) Elevated serum measures of lipid peroxidation and abnormal prefrontal white matter in euthymic bipolar adults: toward peripheral biomarkers of bipolar disorder. Mol Psychiatry 19:200–208. 10.1038/mp.2012.188 [DOI] [PMC free article] [PubMed] [Google Scholar]
- Yendiki A, Panneck P, Srinivasan P, Stevens A, Zöllei L, Augustinack J, Wang R, Salat D, Ehrlich S, Behrens T, Jbabdi S, Gollub R, Fischl B (2011) Automated probabilistic reconstruction of white-matter pathways in health and disease using an atlas of the underlying anatomy. Front Neuroinform 5:23. [DOI] [PMC free article] [PubMed] [Google Scholar]
- Yendiki A, Reuter M, Wilkens P, Rosas HD, Fischl B (2016) Joint reconstruction of white-matter pathways from longitudinal diffusion MRI data with anatomical priors. Neuroimage 127:277–286. 10.1016/j.neuroimage.2015.12.003 [DOI] [PMC free article] [PubMed] [Google Scholar]
- Young RC, Biggs JT, Ziegler VE, Meyer DA (1978) A rating scale for mania: reliability, validity and sensitivity. Br J Psychiatry 133:429–435. 10.1192/bjp.133.5.429 [DOI] [PubMed] [Google Scholar]
- Zhou SY, Suzuki M, Hagino H, Takahashi T, Kawasaki Y, Nohara S, Yamashita I, Seto H, Kurachi M (2003) Decreased volume and increased asymmetry of the anterior limb of the internal capsule in patients with schizophrenia. Biol Psychiatry 54:427–436. 10.1016/S0006-3223(03)00007-6 [DOI] [PubMed] [Google Scholar]
- Zhu X, Wang X, Xiao J, Zhong M, Liao J, Yao S (2011) Altered white matter integrity in first-episode, treatment-naive young adults with major depressive disorder: a tract-based spatial statistics study. Brain Res 1369:223–229. 10.1016/j.brainres.2010.10.104 [DOI] [PubMed] [Google Scholar]