

Abstract
[11C]LY2795050 is a novel kappa-selective antagonist PET tracer. The in vitro binding affinities (Ki) of LY2795050 at the kappa opioid (KOR) and mu opioid (MOR) receptors are 0.72 and 25.8 nM, respectively. Thus, the in vitro KOR/MOR binding selectivity is about 36:1. Our goal in this study was to determine the in vivo selectivity of this new KOR antagonist tracer in the monkey.
Methods
To estimate ED50 value of LY2795050 at the MOR and KOR sites, two series of blocking experiments were performed in three rhesus monkeys using [11C]LY2795050 and [11C]carfentanil with co-injections of various doses of unlabeled LY2795050. Kinetic modeling was applied to calculate regional binding potential (BPND), and one- and two-site binding curves were fitted to these data to measure [11C]LY2795050 binding selectivity.
Results
LY2795050 ED50 at MOR was 119 μg/kg based on a one-site model for [11C]carfentanil. The one-site binding model was also deemed sufficient to describe the specific binding of [11C]LY2795050 at KOR. The ED50 at KOR estimated from the one-site model was 15.6 μg/kg. Thus the ED50 ratio for MOR:KOR was 7.6.
Conclusion
The in vivo selectivity of [11C]LY2795050 for KOR over MOR is 7.6. [11C]LY2795050 has 4.7-fold lower selectivity at KOR over MOR in vivo as compared to in vitro. Nevertheless, based on our finding in vivo, 88 % of the PET-observed specific binding of [11C]LY2795050 under baseline condition will be due to binding of the tracer at the KOR site in a region with similar prevalence of KOR and MOR. We conclude that [11C]LY2795050 is sufficiently selective for KOR over MOR in vivo to be considered an appropriate probe for studying the kappa opioid receptor with PET.
Keywords: kappa opioid receptor, in vivo, selectivity, PET
INTRODUCTION
The kappa opioid receptor (KOR) is one of three major subtypes of the opioid receptor. The endogenous ligand for KOR is dynorphin, which is related to dysphoria. Administration of dynorphin results in conditioned place aversion in animals and dynorphin activation of KOR results in decreased dopamine release in the brain reward circuitry (1, 2). The involvement of the KOR in addiction is thought to be through its ability to modulate DA function. Activation of the KOR by dynorphin or administration of KOR agonists inhibits psychostimulant-induced DA release. Attenuation of DA release has been shown to inhibit both the psychomotor effects and reinforcing behaviors of psychostimulants. Repeated administration of drugs of abuse leads to the dysregulation of the dynorphin/KOR modulatory system. In addition, KORs are believed to play a role in depression, anxiety, and Alzheimer’s disease (3).
The potential role of KORs in mediating alcohol drinking behavior has been the focus of several studies in animals and humans. Mice that lack KORs drink more alcohol and have greater release of dopamine in response to alcohol (4). Rodents with an increased propensity to consume alcohol have lower dynorphin levels in several brain regions that are involved in the control of alcohol drinking (5–7). In humans, the presence of the OPRK1 allele (which decreases expression of KOR) is associated with increased risk of alcoholism (8).
Two prior PET studies have examined the mu opioid receptor (MOR) and the delta opioid receptor (DOR) and their possible roles in the treatment of alcoholism. The tracer for MOR was [11C]carfentanil and for DOR was [11C]methyl-naltrindole. Weerts et al. (9, 10) imaged recently abstinent alcoholics with each tracer before and after administration of the non-specific opioid antagonist, naltrexone. To date, there have been no imaging studies of KOR because a highly selective KOR tracer has not been heretofore available.
Recently, two new radioligands were developed for imaging KORs. Ravert et al. (11) introduced [11C]GR103545, a KOR agonist tracer, and Talbot et al. (12) evaluated its kinetics in baboons. Poisnel et al. (13) reported the KOR antagonist tracer [11C]MeJDTic and characterized it ex vivo in mice. Both tracers showed activity uptake patterns consistent with the KOR distribution determined from in vitro autoradiographic studies of displaceable specific binding. [11C]GR103545 has been advanced to applications in humans at our laboratory (14). [11C]MeJDTic appears to be a highly selective antagonist (i.e., selectivity for KOR over MOR = Sκ:μ = Ki(μ)/Ki(κ) = 700; S κ:δ = Ki(δ)/Ki(κ) > 10,000) (15). However, it is not clear how this tracer will behave in vivo, as its imaging evaluation has not been reported. As an agonist, [11C]GR103545 binds to receptors in the high affinity state. Therefore, it could be used to assess the potential changes in receptor state in diseases, and might also be more sensitive to competition from endogenous opiates. However, a potent KOR agonist tracer will induce pharmacological effects at relatively low mass doses. Hence its injected mass will need to be strictly controlled.
Our group recently reported a new KOR antagonist radioligand [11C]LY2795050 (16). Radioligand competition assays using cloned human KOR, MOR and DOR indicated [11C]LY2795050 displayed in vitro Ki values of 0.72, 25.8, and 153 nM, respectively, for KOR, MOR and DOR. These in vitro affinities suggest a great selectivity of KOR over DOR (200:1) and moderate selectivity of KOR over MOR (35:1). Therefore, investigation of selectivity for KOR over MOR in vivo is important for proper use of the new selective KOR tracer.
A few studies have compared the in vitro and in vivo selectivity of PET tracers, and there are documented discrepancies between the in vitro and in vivo affinity and selectivity profiles (17, 18). In this paper we report the in vivo selectivity of [11C]LY2795050 derived from PET imaging experiments.
Two series of experiments in rhesus monkeys were performed. First, we measured the ED50 of LY2795050 at MOR using an occupancy model and [11C]carfentanil, a selective MOR tracer (19). Second, we measured the ED50 of LY2795050 at KOR using one- and two-site binding models and [11C]LY2795050 as radiotracer.
MATERIALS AND METHODS
General Experimental Design
PET imaging experiments in rhesus monkeys (Macaca mulatta) were conducted according to a protocol approved by the Yale University Institutional Animal Care and Use Committee (IACUC). Monkeys were initially immobilized with ketamine (10 mg/kg intramuscularly) and subsequently anesthetized with isoflurane (1–2 % in O2). Vital signs (pulse rate, blood pressure, respirations, electrocardiogram) were monitored continuously.
Two series of occupancy experiments were performed in three rhesus monkeys (5.0 ± 2.0 years old, 8.8 ± 3.8 kg) with the radiotracers [11C]carfentanil and [11C]LY2795050. On each scan day, a baseline scan was performed followed by a blocking study carried out with varying doses of unlabeled LY2795050 (See Table 1). Typically, unlabeled LY2795050 was co-administered with the tracer.
TABLE 1.
Study Design
| LY2795050 dose (μg/kg) | ||||||
|---|---|---|---|---|---|---|
| 1.6 | 5 | 10 | ~45 | ~135 | ~400 | |
| [11C]Carfentanil | M2 | M1, M2 | M2 | |||
| [11C]LY2795050 | M2 | M1, M2* | M2 | M1, M2 | M2, M3 | |
M=monkey; number=different monkey;
: 2 scans
Radiochemistry
[11C]LY2795050 was synthesized as previously described (16). Both chemical and radiochemical purity of the [11C]LY2795050 final product were >95 %. Specific activity (mean ± S.D.) at end of synthesis was 24.6 ± 14.3 MBq/nmol (n = 14). Synthesis of [11C]carfentanil was carried out with an AutoLoop (Bioscan, Washington,DC, USA), in a procedure similar to that used for the synthesis of [11C]P943 (20). In brief, a solution of 0.5–1.0 mg of desmethyl carfentanil precursor in 80–90 μL of anhydrous DMSO and 2.5 μL of 1N CsOH in MeOH was loaded unto a stainless steel loop and reacted with [11C]MeOTf for 5 min at room temperature. The radiolabeled product was purified with semi-preparative HPLC (Column: Phenomenex Prodigy ODS (3), 10 μm, 250 × 10 mm; Mobile phase: 35 % acetonitrile and 65 % of 0.1 M ammonium formate with 0.5 % acetic acid, pH=4.2 (v/v); Flow rate: 5 mL/min.). Fraction containing the product was collected, diluted with water (50 mL), and passed through a Waters C18 SepPak cartridge. The SepPak cartridge was rinsed with water (10 mL) and eluted with ethanol (1 mL) to recover the product. The ethanol solution was diluted with sterile saline (9 mL) and passed through a sterile 0.22 μm membrane filter for terminal sterilization to afford a sterile product solution ready for injection. Radiochemical purity of the product was > 95 % at the end of synthesis (EOS). Specific activity was 160.5 ± 128 MBq/nmol at EOS (n = 6).
Scans
PET imaging was performed with a FOCUS 220 scanner (Siemens/CTI, Knoxville, TN), which has a resolution of 1.4 mm at the center of the field of view. After a 9-min transmission scan, acquisition of emission data started when bolus administration of tracer started. All [11C]LY2795050 and [11C]carfentanil scans were performed for 120 min. Data were re-binned into a dynamic set and all images were reconstructed with attenuation and scatter correction using a filtered back-projection (FBP) algorithm and a Shepp-Logan axial filter with a cutoff frequency of 0.15 cycles per pixel. Injected activity doses of [11C]LY2795050 and [11C]carfentanil were 12.4 ± 8.4 MBq/kg and 4.6 ± 3.0 MBq/kg, respectively, and injected mass doses were 0.34 ± 0.23 μg/kg and 0.03 ± 0.01 μg/kg, respectively. The mass limits (occupancy < 5%) for each tracer were based on the affinities of the tracers for their respective targets.
MR images were acquired for each rhesus monkey on a Siemens 3.0 T Trio scanner, using an extremity coil. T1-weighted images were acquired in the coronal plane with a spin-echo sequence (TE = 3.34, TR = 2530, flip angle = 7°, section thickness = 0.50 mm, field of view = 140 mm, image matrix = 256 × 256 × 176 pixels, voxel size = 0.547 × 0.547 × 0.500 mm). The skull was removed from the images before coregistration with PET images using FMRIB’s Brain Extraction Tool (http://www.fmrib.ox.ac.kr/fsl/bet2/index.htm).
PET Registration
Each monkey’s early summed PET images (typically 0–10 min) was co-registered to the monkey’s MR images via a 6-parameter rigid registration with the Multi-Transform Method (21). An affine linear plus nonlinear registration was performed (Bioimage Suite 2.5, http://www.bioimagesuite.org) for each MR image to a high-resolution rhesus monkey template on which regions-of-interest (ROI) were defined. Fifteen ROIs were drawn for both tracers: amygdala, brain stem, caudate, cingulate cortex, frontal cortex, globus pallidus, hippocampus, insula, nucleus accumbens, occipital cortex, pons, putamen, substantia nigra, temporal cortex, and thalamus.
Arterial Input Function of [11C]LY2795050
Arterial samples were obtained for [11C]LY2795050 because there were no previous data regarding a valid reference region for this tracer. Twenty blood samples (0.5 mL) were drawn at 0.75, 1.5, 2.25, 3, 4, 5, 6, 8, 9, 12, 15, 20, 25, 30, 40, 50, 60, 75, 90, 105, and 120 min after the injection of [11C]LY2795050. Samples drawn at 4, 12, 30, 60 (3.5 mL), and 90 min (1–5 mL) were also analyzed for radioactive metabolites according to published methods (16). Arterial samples were not taken for [11C]carfentanil because there is an accepted reference region (22).
Estimate of ED50 for LY2795050 at MOR
The simplified reference tissue model (SRTM) (23) was used to estimate binding potential (BPNDMOR) of [11C]carfentanil at MOR using occipital cortex as the reference region (22). A modified Lassen plot, using BPND values instead of regional total distribution volume (VT) with no intercept, was applied to calculate percent occupancy comparing each blocking scan to its matching baseline scan (24). The effective dose of LY2795050 to achieve 50 % occupancy at MOR (ED50MOR) was estimated using nonlinear fitting of a sigmoidal dose-occupancy curve [y = 100x/(ED50MOR + x)] to the [11C]carfentanil data (GraphPad Prism; GraphPad Software Inc., San Diego CA) where y is percent occupancy and x is the dose of LY2795050 (μg/kg).
[11C]LY2795050 BPND
The regional VT of [11C]LY2795050 was calculated using the multilinear analysis (MA1) (25) method (t*: 40min) with a metabolite-corrected plasma time-activity curve. VT values in the cerebellum at baseline and during multiple blocking scans were compared to evaluate and validate the use of cerebellum as a reference region. Based on the comparison of VT values, SRTM was then used to estimate regional binding potential (BPND) of [11C]LY2795050 (with cerebellum as the reference region).
Binding Models to Estimate ED50 of LY2795050 at KOR
Two-site Model
According to a two-site model, the observed binding potential (BPNDMeasured) of [11C]LY2795050 in the presence of unlabeled LY2795050 can be modeled as the sum of specific binding at KOR (BPNDKOR) and specific binding at MOR (BPNDMOR) (Eq 1). In essence, the observed BPND is a weighted sum of two receptor availabilities at the two binding sites that can be expressed in terms of occupancies,
| (1) |
where BPNDMeasured is the measured binding potential in each region and Occi the occupancy of binding site i by LY2795050, assuming that occupancy is uniform across brain regions.
Each occupancy value can be expressed in terms of dose and the ED50 at the respective binding sites,
| (2) |
Equation (2) can be applied to multiple regions, simultaneously. It contains two unknown BP terms for each region, r, and two unknown terms, that are assumed to be shared across all regions.
One-site Model
As a simpler model, the one-site model attributes all blockade to drug action at KOR (Eq 3).
| (3) |
| (4) |
Model Assumption
The maximum occupancy by LY2795050 was constrained to 100 % at both the KOR and MOR sites in equations (2) and (4) which means that maximum Occi is 1 in equations (1) and (3). The parameter ED50KOR was shared across regions and monkeys.
In the two-site model, the ED50MOR was fixed to the estimated value from the fit of a one-site model to the [11C]carfentanil data. Thus, a fit of equation (2) to all 8 regions simultaneously required us to estimate (number of regions × 2) + 1 parameters from 8 BP vs. dose curves. In the one-site model, (number of regions + 1) parameters were estimated.
The binding models were fitted to data from moderate and high binding regions (caudate, cingulate cortex, frontal cortex, globus pallidus, insula, nucleus accumbens, putamen, and substantia nigra) from 3 monkeys, simultaneously. Goodness of fit to the one- vs two-site model was determined by an F-test (α=0.05, d.f.=(8, 86)). To assess the sensitivity of our estimates of ED50KOR to the choice of ED50MOR, we examined the percentage change in estimated ED50KOR as the fixed value of ED50MOR was varied by ± 10 % in the two-site model.
We are assuming that the measured occupancy is all due to cold compound and not any increase in endogenous dynorphin because the compound LY2795050 is an antagonist, not an agonist.
RESULTS
Derivation of ED50 Value for LY2795050 at MOR
Occupancies at MOR by multiple doses of LY2795050 are shown in Fig. 1. Occupancies were obtained from modified Lassen plots using 12 brain regions (brainstem, caudate, cerebellum, cingulate cortex, frontal cortex, globus pallidus, hippocampus, insula, pons, putamen, temporal cortex, and thalamus) excluding nucleus accumbens because –although a high binding region– it lies distant from the line of regression (Supp. Fig. S1). ED50MOR was estimated as 119 ± 21 μg/kg. All tissue time-activity curves were fitted excellently using SRTM under both the baseline and blocking conditions.
Figure 1.
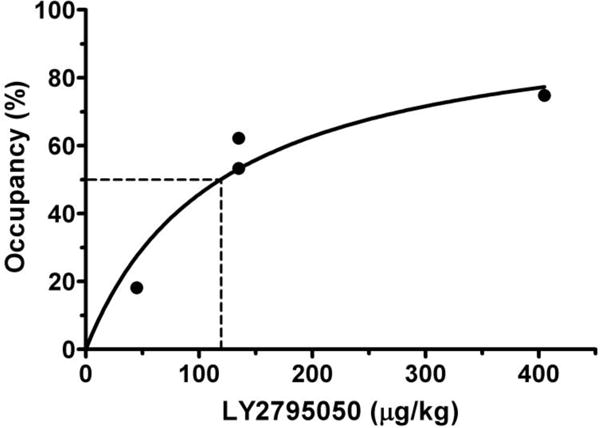
Occupancy data for LY2975050 at mu opioid receptor (MOR) were fitted to an occupancy (Occ = 100*Dose/(ED50MOR + Dose)).
Assessment of a Reference Region for [11C]LY2795050 and Derivation of Regional BPND
We used MA1 for estimating VT because the estimates showed high correlation with VT estimates using the 2-tissue compartment model (2T) (slope=0.94, r2=0.95). Some example fits to the time-activity data using MA1 and correlation plot between 2T VT and MA1 VT are provided in Fig. 2.
Figure 2.
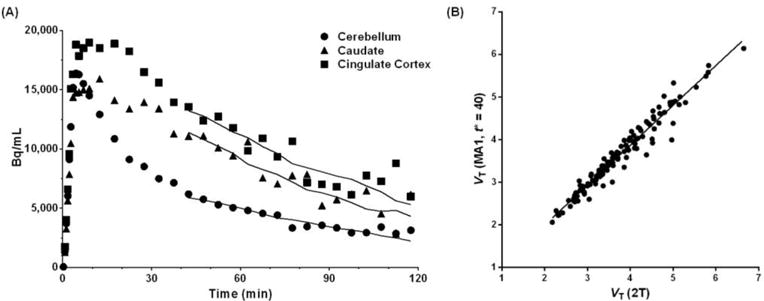
(A) Time-activity curves of [11C]LY2795050 in a monkey. Lines represent the fits by the MA1 model (t* = 40 min). (B) Correlation between VT values estimated by 2T and MA1 (t* = 40 min), y = 0.94x+0.12, r2 = 0.95.
Shown in Fig. 3 are VT values of [11C]LY2795050 in the cerebellum at baseline and from multiple blocking scans calculated using MA1. There was no difference between values at baseline and blocking scans with varying doses of LY2795050. Thus, cerebellum was used as a reference region in calculating BPND. In order to present positive values, the distribution volume ratio (DVR = BPND+1) for each region is shown in Fig. 4 for multiple LY2795050 doses. In the baseline condition, regional binding was highest (DVR > 1.5) in the globus pallidus, cingulate cortex, nucleus accumbens, substantia nigra, caudate, putamen and insula. This finding is consistent with the reported distribution of KOR in primates (26). Binding in all regions decreased with increasing doses of LY2795050 (Fig. 4 and 5). Unreliable estimates of BPND (%SE > 40 %) were excluded in binding site analysis in Figs. 4 and 6.
Figure 3.
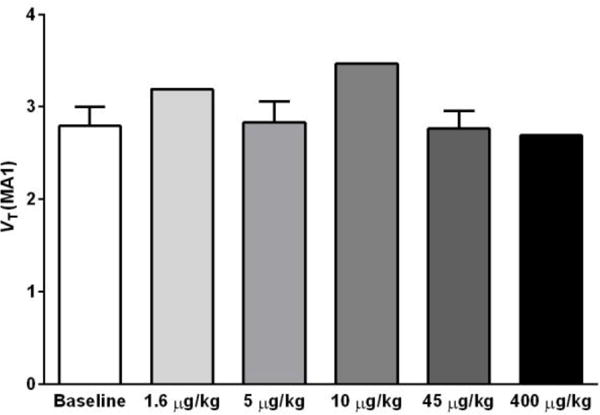
Cerebellum VT of [11C]LY2975050 estimated from baseline and blocking scans with 5 different doses of LY2975050 using the MA1 model and a metabolite-corrected arterial plasma curve as the input function. No difference in VT across these doses indicates that cerebellum is a valid reference region for [11C]LY2975050 in rhesus monkeys.
Figure 4.
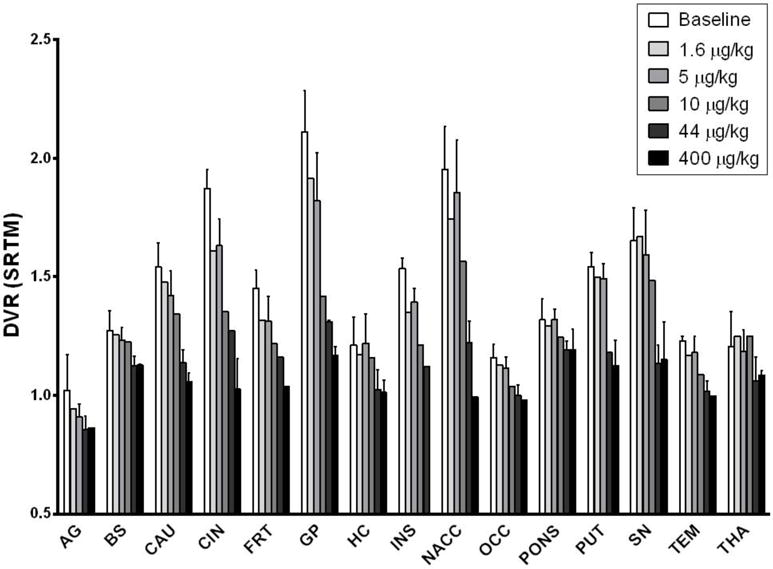
Six different doses of LY2975050 cause dose-dependent decrease in DVR (BPND+1) in all regions of the brain examined (AG: amygdala, BS: brainstem, CAU: caudate, CIN: cingulate cortex, FRT: frontal cortex, GP: globus pallidus, HC: hippocampus, INS: insula, NACC: nucleus accumbens, OCC: occipital cortex, PUT: putamen, SN: substantia nigra, TEM: temporal cortex, THA: thalamus).
Figure 5.
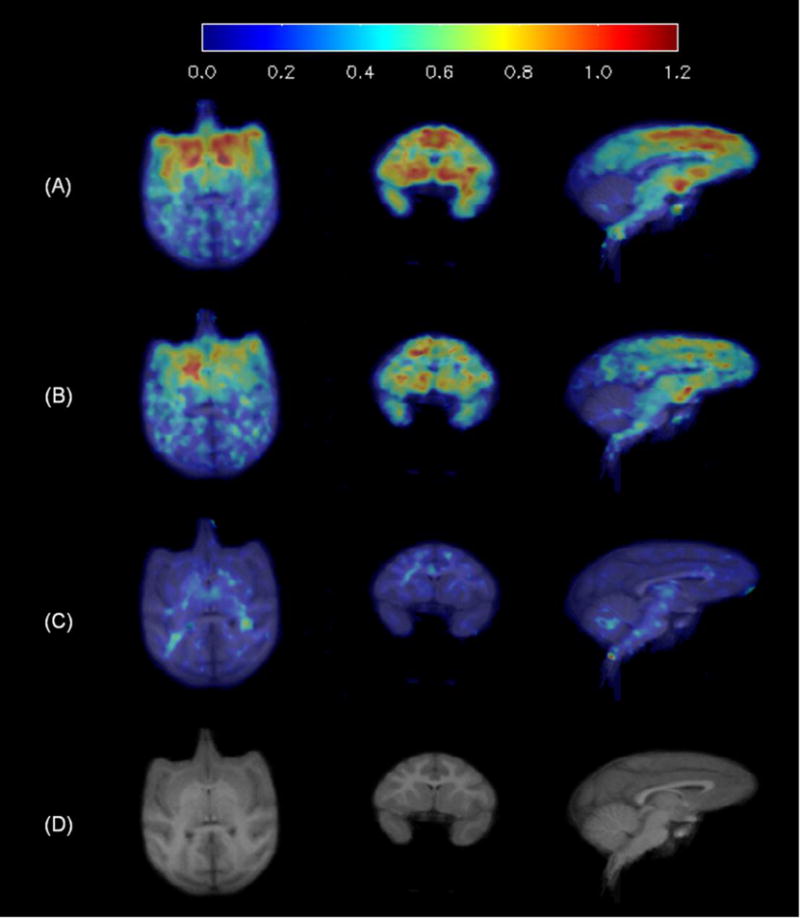
Average binding potential (BPND) images: (A) baseline scan (n=5), (B) blocking scan with 5 μg/kg of LY2795050 (n=3), (C) blocking scan with 400 μg/kg of LY2795050 (n=2), and (D) Matching MR images.
Figure 6.
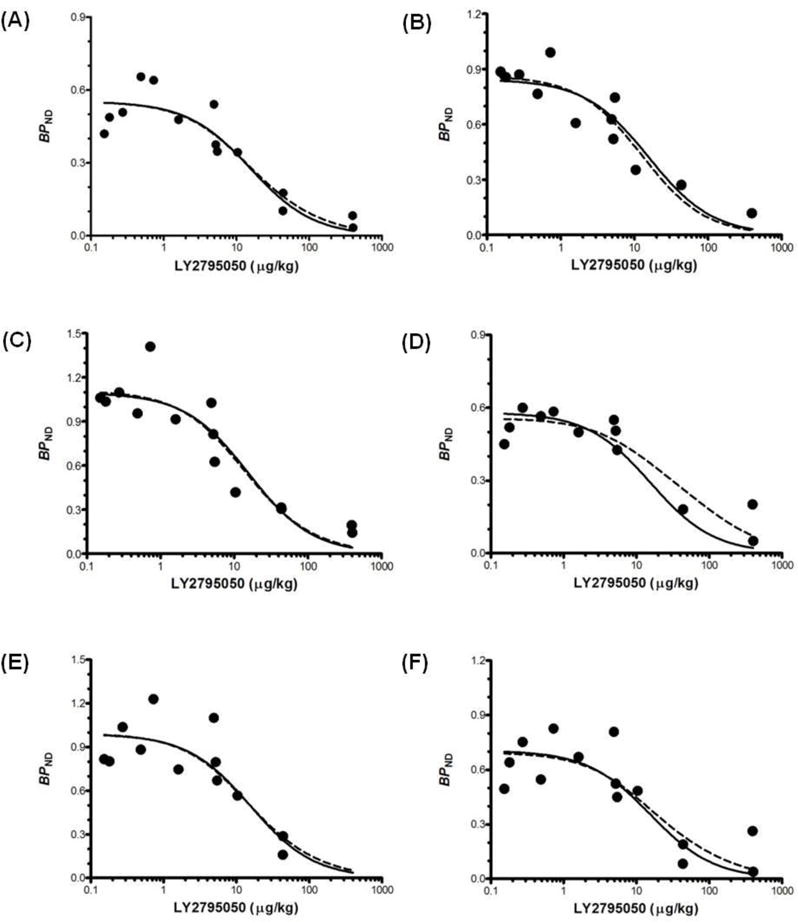
Fits of one- (solid line) and two-site binding models (dashed line). Model fits to eight brain regions simultaneously (6 highest-binding regions shown; (A): caudate, (B): cingulate cortex, (C): globus pallidus, (D): putamen, (E): nucleus accumbens, (F): substantia nigra). Fits of one- and two-site models are statistically indistinguishable. Curves are comprised of BPND points for [11C]LY2975050 from multiple monkeys at multiple doses of LY2975050. Data points at mass doses below 1 μg/kg were from ‘baseline’ scans. The mass doses for these studies were calculated as radioactivity dose divided by specific activity.
Binding Models for Derivation of LY2795050 ED50 at KOR
Fitted curves of the two- and one-site binding models are shown in Fig. 6 for high binding regions (caudate, cingulate cortex, globus pallidus, putamen, nucleus accumbens, and substantia nigra). Based on the F-test, there was no significant difference between the fits (P=0.94). Therefore, the one-site binding model was deemed sufficient to describe specific binding of [11C]LY2795050. The shared ED50KOR estimated from the one-site model was 15.6 ± 2.2 μg/kg. In the two-site model, when ED50MOR was fixed at 119 μg/kg based on the [11C]carfentanil results, the shared ED50KOR was estimated at 12.9 ± 4.5 μg/kg. For a 10 % change in ED50MOR, the change in estimated ED50KOR was less than 1 %. Estimation of ED50KOR was therefore not sensitive to the choice of ED50MOR. Region-by-region estimates of BPND and associated shared estimates of ED50 are shown in a supplemental table S1.
In vivo Selectivity
The selectivity of LY279505 for KOR over MOR (ratio of the ED50 values) was 7.6.
DISCUSSION
As reported previously, the in vitro binding affinities (Ki) of [11C]LY2795050 were 0.72 and 25.8 nM, respectively, for KOR and MOR (16) at room temperature (22 °C). In our present work, in non-human primates, in vivo, ED50MOR was found to be 119 μg/kg based on occupancy studies with [11C]carfentanil PET and blocking doses of LY2795050. Further, ED50KOR was estimated to be 15.6 μg/kg based on fits of a one-site binding model with data obtained from blocking studies with the tracer, [11C]LY2795050, and varying doses of unlabeled LY2975050. Our present results suggest that the in vivo selectivity of the new KOR antagonist radioligand, [11C]LY2795050, is 7.6:1 for KOR over MOR. Thus, the tracer has 4.7-fold lower selectivity for KOR over MOR in vivo as compared to in vitro. This degree of discrepancy in tracer selectivity between in vitro and in vivo values is comparable to those for other tracers reported in the recent literature. Ekelund et al. (17) showed that the in vitro affinity ratio of [11C]NNC 112 for the D1 vs 5-HT2A receptors was 100:1 whereas the in-vivo selectivity was only 10:1.
In vivo and in vitro Kd values are often quite different. Slifstein et al. (18) found a substantially lower affinity in vivo (Kd = 0.20 nM) of [18F]fallypride for D2 receptors than the in vitro estimates obtained at room temperature (Kd = 0.04 nM). On the other hand, at body temperature the in vitro Kd value was found to be 2.03 nM. That is, Kd(in vitro, room temperature) < Kd(in vivo) <Kd(in vitro, body temperature). Thus, one possible source of the in vivo-in vitro discrepancy might be related to the temperature at which assays were performed.
One useful way to understand the in vivo selectivity is to recognize that the ratio of the specific binding (SB) of the tracer, [11C]LY2795050, at KOR vs MOR will be dependent on three factors: the ratio of the affinities (aka “selectivity”), the ratio of the receptor densities in each region (aka “prevalence”), and the occupancies of the respective sites by any cold drug or endogenous neurotransmitter that might be on-board. The specific binding ratio is the relative contribution of binding at KOR vs MOR that contributes to the total specific tracer binding,
| (5) |
where and are the receptor density and affinity of the tracer, respectively, for site i. Occi is the occupancy of site i by a cold drug (e.g., naltrexone), tracer, or endogenous neurotransmitter.
At baseline (no competition), in vivo selectivity is mainly determined by the ED50 ratio. Occupancy by drug at both sites is zero, so the occupancy ratio term in Equation (5) is approximately 1 (ignoring endogenous neurotransmitter). If ED50KOR is 16 μg/kg, then < 5 % occupancy by tracer would occur at ~ 1 μg/kg. In this study, injected mass doses of [11C]LY2795050 were 0.34 ± 0.23 μg/kg. Therefore, occupancy by tracer was negligible. If the prevalence of KOR and MOR are approximately equal in a given brain region (e.g., cingulate cortex (27)), then the specific binding ratio of [11C]LY2795050 will be ED50MOR/ ED50KOR = 119/15.6 ≈ 7.6/1. Said another way, 88 % of the specific binding signal from PET imaging will be attributable to binding at the KOR in a region with similar prevalence of KOR and MOR. Even in a region with a low prevalence of KOR (e.g., putamen, frontal cortex (27)), 72 % of the specific binding detected will be due to binding at the KOR (see Table 2).
TABLE 2.
Percent of KOR Binding in the Total Specific Binding in Regions
| Prevalence | κ binding %* | Region† | |
|---|---|---|---|
|
|
72 | amygdala, putamen, frontal cortex | |
|
|
88 | cingulate cortex | |
|
|
92 | substantia nigra |
= receptor density for site i
SBi= specific binding for site i
κ binding % (%)
All region’s density ratio values are based on data from (27).
When a drug, such as naltrexone, is present in the brain, in vivo selectivity is determined by occupancies and ED50 ratio. That is, the occupancies of the drug at each receptor site in each region become important. It has been determined that clinical doses of naltrexone (50 mg), a non-selective opiate antagonist, lead to very high occupancy of MOR sites in the brain - an average of 94.9 % according to Weerts and colleagues (10). If we consider a brain region with comparable prevalence of MOR and KOR and also use an average value of 91.5 % occupancy of naltrexone at KOR (28), we can calculate:
| (6) |
As the dose of naltrexone is increased from 0 to 50 mg, in vivo selectivity would rise gradually as the occupancy at KOR grows less rapidly than the occupancy at MOR. In other words, the specific binding ratio for KOR over MOR under naltrexone will actually be higher than at baseline because naltrexone has greater affinity for MOR compared to KOR (29).
We determined in vivo selectivity, in part, by comparing model fits using one- and two-site binding models. A similar approach was taken by Searle et al. (30) in the analysis of [11C]PHNO data. They blocked [11C]PHNO binding with GSK598809, a selective D3 receptor antagonist, to gauge the selectivity for the D3 receptor as compared with the high affinity D2 (D2high) receptor site. To check the assumption regarding negligible binding of GSK598809 at D2high sites, the authors compared model fits using a two-site binding model that accounted for possible occupancy of D2high and D3 with a one-site model that only accounted for D3 binding.
Similarly, we confirmed that a two-site binding model was not necessary to describe specific binding of [11C]LY2795050. The fits of our two-site model to [11C]LY2795050 data were not significantly better than those of a one-site model. Further, estimates of ED50KOR using the two-site binding model were not very different from those using a one-site binding model (mean ± s.e: 12.9 ± 4.5 μg/kg for the two-site model, 15.6 μg/kg ± 2.2 for the one-site model). In other words, we confirmed that the binding of [11C]LY2795050 at MOR is minimal. Note that in Fig. 6, all regions other than the putamen are well fitted using a one-site binding model. The overall estimate of ED50KOR is not heavily dependent on the data in the putamen. If we eliminate the putamen, ED50KOR becomes 15 μg/kg.
In this study we can only obtain the ED50 values. ED50 is the dose of a compound (or drug) that gives 50% occupancy of the target receptor. Kd (or Ki) is a concentration of compound (or drug) in the tissue. The two terms are not interchangeable. However, the ratios between in vitro Kd’s (or Ki’s) for KOR and MOR and between in vivo ED50’s for KOR and MOR can be compared to assess the selectivity difference between the in vitro and in vivo situations.
In comparing one- and two-site models, we chose to use BPND instead of VT, because BPND is more sensitive than VT to specific binding. If non-specific VT is large, it is difficult to detect a change in specific binding via a change in VT, because regional VT is a sum of both non-specific and specific volume of distribution. In our data, non-specific VT values (low binding regions: cerebellum or thalamus) have values that are approximately 50 % of VT in the highest binding region (globus pallidus). Therefore, we assessed the validity of cerebellum as the reference region for [11C]LY2795050, and noted that cerebellum VT did not decrease following any doses of LY2795050 (Fig. 3) whereas DVR (=BPND +1) showed dose-dependency in all other regions examined (Fig. 4).
Nucleus accumbens regions were excluded in Lassen plot because that region has much higher BPND value than others. Nucleus accumbens region is one of high MOR density region (31). We want to consider it separately with other region. Therefore, we chose to exclude nucleus accumbens so that it would not drive the slope of the plot.
In our baseline data, the average koff value of [11C]LY2795050 in high binding regions (globus pallidus, nucleus accumbens, and cingulate cortex) is 0.064 ± 0.02 (1/min). As a comparison, Pappata et al. (32) reported a koff of 0.1363 (1/min) for 11C-raclopride, which has proved to be ideal for displacements studies. We have not assessed the sensitivity of the new tracer’s binding to endogenous opiates, but this will be an important aspect to explore in future studies.
CONCLUSION
In this study, we measured ED50MOR (15.6 μg/kg) and ED50KOR (119 μg/kg) in order to calculate the in vivo selectivity of the novel antagonist tracer [11C]LY2795050 for KOR over MOR. In vivo selectivity of [11C]LY2795050 was approximately 7.6:1. This selectivity is 4.7-fold lower than the reported in vitro value. The same pattern has been found for other PET tracers in recent work. We conclude that [11C]LY2795050 is sufficiently selective for KOR over MOR in vivo because, even in regions with equal KOR and MOR density, ~88 % of the specific binding of [11C]LY2795050 that we measure with PET in a baseline scan will be due to binding of the tracer at the KOR.
Acknowledgments
The authors wish to thank Krista Fowles, Siobhan Ford, Daniel Holden for animal experiments and Yale PET Center chemistry team for synthesis of [11C]LY2795050. This project was supported by Yale PET Center. This publication was also made possible by CTSA Grant Number UL1 RR024139 from the National Center for Research Resources (NCRR) and the National Center for Advancing Translational Science (NCATS), components of the National Institutes of Health (NIH), and NIH roadmap for Medical Research. Its contents are solely the responsibility of the authors and do not necessarily represent the official view of NIH.
References
- 1.Shippenberg TS, Zapata A, Chefer VI. Dynorphin and the pathophysiology of drug addiction. Pharmacol Ther. 2007;116:306–321. doi: 10.1016/j.pharmthera.2007.06.011. [DOI] [PMC free article] [PubMed] [Google Scholar]
- 2.Mucha RF, Herz A. Motivational properties of kappa and mu opioid receptor agonists studied with place and taste preference conditioning. Psychopharmacology (Berl) 1985;86:274–280. doi: 10.1007/BF00432213. [DOI] [PubMed] [Google Scholar]
- 3.Yakovleva T, Marinova Z, Kuzmin A, et al. Dysregulation of dynorphins in Alzheimer disease. Neurobiol Aging. 2007;28:1700–1708. doi: 10.1016/j.neurobiolaging.2006.07.002. [DOI] [PubMed] [Google Scholar]
- 4.Kovacs KM, Szakall I, O'Brien D, et al. Decreased oral self-administration of alcohol in kappa-opioid receptor knock-out mice. Alcohol Clin Exp Res. 2005;29:730–738. doi: 10.1097/01.alc.0000164361.62346.d6. [DOI] [PubMed] [Google Scholar]
- 5.Marinelli PW, Kiianmaa K, Gianoulakis C. Opioid propeptide mRNA content and receptor density in the brains of AA and ANA rats. Life Sci. 2000;66:1915–1927. doi: 10.1016/s0024-3205(00)00517-8. [DOI] [PubMed] [Google Scholar]
- 6.Fadda P, Tronci S, Colombo G, Fratta W. Differences in the opioid system in selected brain regions of alcohol-preferring and alcohol-nonpreferring rats. Alcohol Clin Exp Res. 1999;23:1296–1305. [PubMed] [Google Scholar]
- 7.Winkler A, Spanagel R. Differences in the kappa opioid receptor mRNA content in distinct brain regions of two inbred mice strains. Neuroreport. 1998;9:1459–1464. doi: 10.1097/00001756-199805110-00039. [DOI] [PubMed] [Google Scholar]
- 8.Edenberg HJ, Wang J, Tian H, et al. A regulatory variation in OPRK1, the gene encoding the kappa-opioid receptor, is associated with alcohol dependence. Hum Mol Genet. 2008;17:1783–1789. doi: 10.1093/hmg/ddn068. [DOI] [PMC free article] [PubMed] [Google Scholar]
- 9.Weerts EM, Wand GS, Kuwabara H, et al. Positron emission tomography imaging of mu- and delta-opioid receptor binding in alcohol-dependent and healthy control subjects. Alcohol Clin Exp Res. 2011;35:2162–2173. doi: 10.1111/j.1530-0277.2011.01565.x. [DOI] [PMC free article] [PubMed] [Google Scholar]
- 10.Weerts EM, Kim YK, Wand GS, et al. Differences in delta- and mu-opioid receptor blockade measured by positron emission tomography in naltrexone-treated recently abstinent alcohol-dependent subjects. Neuropsychopharmacology. 2008;33:653–665. doi: 10.1038/sj.npp.1301440. [DOI] [PubMed] [Google Scholar]
- 11.Ravert HT, Mathews WB, Musachio JL, Scheffel U, Finley P, Dannals RF. [11C]-methyl 4-[(3,4-dichlorophenyl)acetyl]-3-[(1-pyrrolidinyl)-methyl]-1- piperazinecarboxylate ([11C]GR89696): synthesis and in vivo binding to kappa opiate receptors. Nucl Med Biol. 1999;26:737–741. doi: 10.1016/s0969-8051(99)00043-8. [DOI] [PubMed] [Google Scholar]
- 12.Talbot PS, Narendran R, Butelman ER, et al. 11C-GR103545, a radiotracer for imaging kappa-opioid receptors in vivo with PET: synthesis and evaluation in baboons. J Nucl Med. 2005;46:484–494. [PubMed] [Google Scholar]
- 13.Poisnel G, Oueslati F, Dhilly M, et al. [11C]-MeJDTic: a novel radioligand for kappa-opioid receptor positron emission tomography imaging. Nucl Med Biol. 2008;35:561–569. doi: 10.1016/j.nucmedbio.2008.02.010. [DOI] [PubMed] [Google Scholar]
- 14.Tomasi G, Zheng M-Q, Weinzimmer D, et al. Kinetic modeling of the kappa agonist tracer [11C]GR103545 in humans. J Nucl Med. 2010;51:1293. [Google Scholar]
- 15.Thomas JB, Atkinson RN, Vinson NA, et al. Identification of (3R)-7-hydroxy-N-((1S)-1-[[(3R,4R)-4-(3-hydroxyphenyl)- 3,4-dimethyl-1-piperidinyl]methyl]-2-methylpropyl)-1,2,3,4-tetrahydro- 3-isoquinolinecarboxamide as a novel potent and selective opioid kappa receptor antagonist. J Med Chem. 2003;46:3127–3137. doi: 10.1021/jm030094y. [DOI] [PubMed] [Google Scholar]
- 16.Zheng MQ, Nabulsi N, Kim SJ, et al. Synthesis and Evaluation of 11C-LY2795050 as a kappa-Opioid Receptor Antagonist Radiotracer for PET Imaging. J Nucl Med. 2013;54:455–463. doi: 10.2967/jnumed.112.109512. [DOI] [PMC free article] [PubMed] [Google Scholar]
- 17.Ekelund J, Slifstein M, Narendran R, et al. In vivo DA D(1) receptor selectivity of NNC 112 and SCH 23390. Mol Imaging Biol. 2007;9:117–125. doi: 10.1007/s11307-007-0077-4. [DOI] [PubMed] [Google Scholar]
- 18.Slifstein M, Hwang DR, Huang Y, et al. In vivo affinity of [18F]fallypride for striatal and extrastriatal dopamine D2 receptors in nonhuman primates. Psychopharmacology (Berl) 2004;175:274–286. doi: 10.1007/s00213-004-1830-x. [DOI] [PubMed] [Google Scholar]
- 19.Henriksen G, Willoch F, Talbot PS, Wester HJ. Recent development and potential use of mu- and kappa-opioid receptor ligands in positron emission tomography studies. Drug Development Research. 2006;67:890–904. [Google Scholar]
- 20.Nabulsi N, Huang Y, Weinzimmer D, et al. High-resolution imaging of brain 5-HT 1B receptors in the rhesus monkey using [11C]P943. Nucl Med Biol. 2010;37:205–214. doi: 10.1016/j.nucmedbio.2009.10.007. [DOI] [PMC free article] [PubMed] [Google Scholar]
- 21.Sandiego CM, Weinzimmer D, Carson RE. Optimization of PET-MR registrations for nonhuman primates using mutual information measures: a Multi-Transform Method (MTM) Neuroimage. 2013;64:571–581. doi: 10.1016/j.neuroimage.2012.08.051. [DOI] [PMC free article] [PubMed] [Google Scholar]
- 22.Endres CJ, Bencherif B, Hilton J, Madar I, Frost JJ. Quantification of brain mu-opioid receptors with [11C]carfentanil: reference-tissue methods. Nucl Med Biol. 2003;30:177–186. doi: 10.1016/s0969-8051(02)00411-0. [DOI] [PubMed] [Google Scholar]
- 23.Lammertsma AA, Hume SP. Simplified reference tissue model for PET receptor studies. Neuroimage. 1996;4:153–158. doi: 10.1006/nimg.1996.0066. [DOI] [PubMed] [Google Scholar]
- 24.Cunningham VJ, Rabiner EA, Slifstein M, Laruelle M, Gunn RN. Measuring drug occupancy in the absence of a reference region: the Lassen plot re-visited. J Cereb Blood Flow Metab. 2010;30:46–50. doi: 10.1038/jcbfm.2009.190. [DOI] [PMC free article] [PubMed] [Google Scholar]
- 25.Ichise M, Toyama H, Innis RB, Carson RE. Strategies to improve neuroreceptor parameter estimation by linear regression analysis. J Cereb Blood Flow Metab. 2002;22:1271–1281. doi: 10.1097/01.WCB.0000038000.34930.4E. [DOI] [PubMed] [Google Scholar]
- 26.Sim-Selley LJ, Daunais JB, Porrino LJ, Childers SR. Mu and kappa1 opioid-stimulated [35S]guanylyl-5'-O-(gamma-thio)-triphosphate binding in cynomolgus monkey brain. Neuroscience. 1999;94:651–662. doi: 10.1016/s0306-4522(99)00344-9. [DOI] [PubMed] [Google Scholar]
- 27.Delay-Goyet P, Zajac JM, Javoy-Agid F, Agid Y, Roques BP. Regional distribution of mu, delta and kappa opioid receptors in human brains from controls and parkinsonian subjects. Brain Res. 1987;414:8–14. doi: 10.1016/0006-8993(87)91321-7. [DOI] [PubMed] [Google Scholar]
- 28.Morris E, Kim SJ, Franco N, et al. Occupancy of naltrexone at kappa opioid receptors may predict efficacy in reducing drinking in alcoholics. Journal of Cerebral Blood Flow and Metabolism. 2012;32:S91–S92. [Google Scholar]
- 29.Ko MC, Butelman ER, Traynor JR, Woods JH. Differentiation of kappa opioid agonist-induced antinociception by naltrexone apparent pA2 analysis in rhesus monkeys. J Pharmacol Exp Ther. 1998;285:518–526. [PMC free article] [PubMed] [Google Scholar]
- 30.Searle G, Beaver JD, Comley RA, et al. Imaging dopamine D3 receptors in the human brain with positron emission tomography, [11C]PHNO, and a selective D3 receptor antagonist. Biol Psychiatry. 2010;68:392–399. doi: 10.1016/j.biopsych.2010.04.038. [DOI] [PubMed] [Google Scholar]
- 31.Mansour A, Khachaturian H, Lewis ME, Akil H, Watson SJ. Anatomy of CNS opioid receptors. Trends Neurosci. 1988;11:308–314. doi: 10.1016/0166-2236(88)90093-8. [DOI] [PubMed] [Google Scholar]
- 32.Pappata S, Dehaene S, Poline JB, et al. In vivo detection of striatal dopamine release during reward: a PET study with [(11)C]raclopride and a single dynamic scan approach. Neuroimage. 2002;16:1015–1027. doi: 10.1006/nimg.2002.1121. [DOI] [PubMed] [Google Scholar]