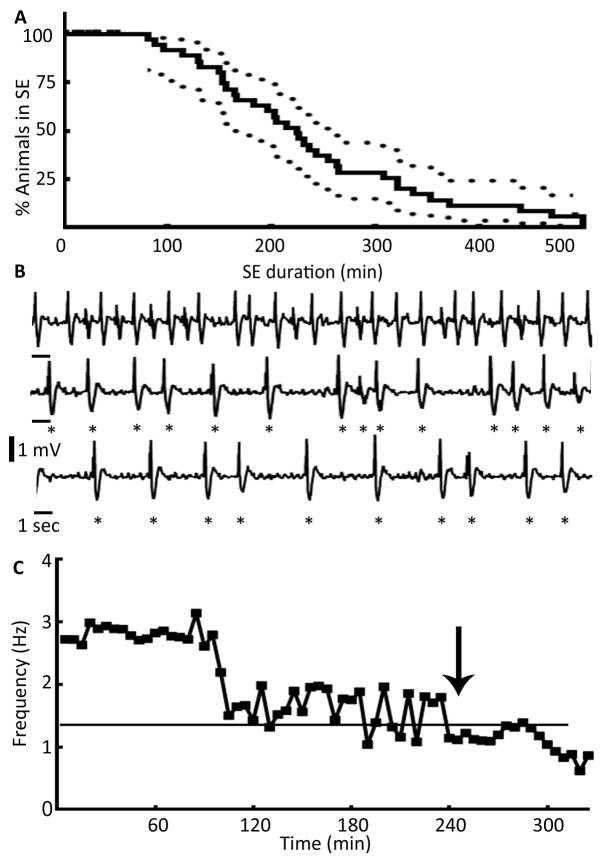
Figure 6. EEG characteristics marking the end of SE.
(A) A Kaplan-Meyer survival plot illustrating the duration of SE. Percentage of animals in SE along with 95% confidence intervals were plotted against time, N= 34. (B) An EEG illustrating the end of SE marked by loss of rhythmicity and decline in the frequency of spike-wave discharges below 1 Hz. Highly rhythmic activity higher than 1 Hz (top trace) slowly transitioned to arrhythmic activity (middle trace), which finally dropped to a frequency below 1 Hz (bottom trace). Individual spikes are marked by stars to highlight transition of rhythmic to arrhythmic activity and a drop in the frequency below 1 Hz. (C) The graph shows frequency of spike-wave discharges during the autonomous and waning phases of SE and the drop in the frequency below 1 Hz that marked the end of SE, and time 0 marks the end of hippocampal stimulation.

