

We discover the experimental case of a quantum valence criticality leading to the breakdown of the Fermi liquid state.
Abstract
A valence critical end point existing near the absolute zero provides a unique case for the study of a quantum version of the strong density fluctuation at the Widom line in the supercritical fluids. Although singular charge and orbital dynamics are suggested theoretically to alter the electronic structure significantly, breaking down the standard quasi-particle picture, this has never been confirmed experimentally to date. We provide the first empirical evidence that the proximity to quantum valence criticality leads to a clear breakdown of Fermi liquid behavior. Our detailed study of the mixed valence compound α-YbAlB4 reveals that a small chemical substitution induces a sharp valence crossover, accompanied by a pronounced non–Fermi liquid behavior characterized by a divergent effective mass and unusual T/B scaling in the magnetization.
INTRODUCTION
The supercritical fluid state near the liquid-gas critical point has been a major subject in condensed matter physics for its technological relevance and for its scientific significance (1, 2). One of the important goals is to bring down the critical temperature and pressure, which are normally much higher than ambient conditions. By contrast, in the electronic versions of these critical points, there are some cases where the temperature scale may be reduced significantly down to near-zero temperatures so that one may observe quantum critical phenomena in the corresponding “supercritical” states. Strange metal behaviors have been seen in correlated electron systems as a result of proximity to a quantum critical end point of a first-order transition such as a metamagnetic transition and a Mott transition (3–5). Another candidate for the density instability that may theoretically drive novel quantum criticality (QC) is valence transition (6–9). Near its associated quantum critical end point, singular fluctuations of valence (which includes charge, spin, and orbital degrees of freedom) and its coupling with thermodynamic quantities are expected to lead to a strong violation of Fermi liquid (FL) behavior. Similar to the Widom line in the supercritical fluid (10, 11), fluctuations remain strong near the valence crossover line. Although a valence crossover at low temperatures has been reported in a variety of materials (12–19), the associated QC has not been confirmed to date.
For the study of QC, many prototypical materials have been found among heavy-fermion 4f intermetallic compounds, because fine-tuning of characteristic energy scales is possible using high-purity crystals (20, 21). In this class of materials, QC has been regarded to arise from a competition between local moment magnetism and conduction electron screening of the local moments (the Kondo effect), as originally discussed by Doniach (22). Thus, the studies have focused on the systems with an almost integral valence that stabilizes the local moments.
Breaking this pattern, β-YbAlB4 is the first material that exhibits pronounced QC despite its strong mixed valency (23–25). An ultrapure single crystal of the material exhibits singular behavior without tuning, namely, under zero field and ambient pressure, such as a divergent increase of the susceptibility ~T−1/2 and anomalous T3/2 dependence of the resistivity, both of which are extremely sensitive to external field B. T/B scaling of the magnetization observed over four decades of T/B pinpoints the critical field to 0 ± 0.1 mT and reveals an unconventional form of the QC. Moreover, a recent pressure study found that this QC is separated from an antiferromagnetic (AF) phase that appears under pressure and extends up to Pc ~ 0.4 GPa, indicating the existence of a strange metal phase (26).
β-YbAlB4 has a locally isostructural polymorph α-YbAlB4 (27). At high temperatures, the two phases share nearly the same physical properties (24, 28). For example, both have mixed valence less than 2.8+ (25) and coherence temperatures of ~200 to 250 K (23, 28). Moreover, despite the mixed valency, both show an Yb ion local moment behavior expected for a Kondo lattice (24, 28). In the ground state, however, they have significant differences; in contrast to the QC behavior in β-YbAlB4, α-YbAlB4 forms a heavy FL at low temperatures with a specific heat coefficient of γ ~ 130 mJ/mol K2. On the other hand, a recent study revealed that several percentages of Fe substitution at the Al site induce Yb antiferromagnetism (29). Here, we show on the basis of our comprehensive study that the antiferromagnetism appears through a first-order phase transition across a very small amount of Fe substitution of xc= 1.4% in α-YbAl1−xFexB4. We found a sharp valence crossover at the critical concentration xc accompanied by unconventional QC, which cannot be explained by the standard theory based on spin-density wave (SDW) fluctuations (30, 31) but, instead, can be accounted for by the valence QC.
RESULTS
We first present a phase diagram established on the basis of our magnetothermal and transport measurements with a contour plot of the resistivity exponent α defined by ρ = ρ0 + A′Tα in Fig. 1A. Upon doping, antiferromagnetism due to Yb 4f moments appears rather suddenly at x = 1.5% with the Néel temperature TN of 1.2 K, whereas it is suppressed below 25 mK at xc = 1.4%. The magnetic susceptibility shows history dependence between the zero-field–cooled (ZFC) and field-cooled (FC) sequences below TN due to the canting of the magnetic moments with the spontaneous moment along the c axis (Fig. 2A) (29). This AF ordering also exhibits a clear anomaly in the temperature dependence of the specific heat (Fig. 2B). Note that Fe itself does not carry any magnetic moment, as evident from the small diamagnetism found in the Lu analog, α-LuAl1−xFexB4 (Fig. 2A and fig. S3). Pronounced non-FL (NFL) behavior with α ~ 1.6 was observed around xc = 1.4% (Fig. 1A). Other properties of the NFL will be discussed later in detail.
Fig. 1. Phase diagram of the emergent electronic phases of α-YbAlB4 with Fe doping.
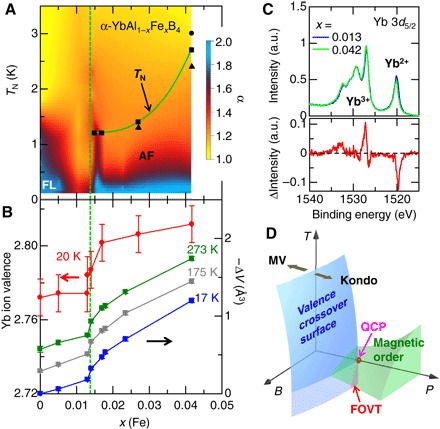
(A) Phase diagram of temperature (vertical axis) versus Fe concentration x (horizontal axis) for α-YbAl1−xFexB4 with the contour plot map of the power law exponent α = ∂ln(ρa(T) − ρa(0))/∂lnT of the a axis resistivity. TN denotes the AF Néel point determined by magnetization (closed circles), specific heat (closed squares), and resistivity (closed triangles). The broken vertical line indicates the critical concentration xc = 1.4% for the valence crossover and the first-order AF transition. (B) Doping dependence of the Yb valence estimated from hard x-ray photoemission spectroscopy (HAXPES) at 20 K (left axis) and doping dependence of the unit cell volume measured by powder x-ray diffraction at 273, 175, and 17 K (right axis). (C) HAXPES spectra of Yb 3d5/2 core level in YbAl1−xFexB4 with x = 1.3 and 4.2% (top) and the difference of these spectra from x = 1.3 to 4.2% (bottom). (D) Schematic phase diagram for the valence QC mechanism, which is shown as a function of temperature T, magnetic field B, and the chemical pressure P for an Yb-based system (8). Valence crossover (blue) and the AF order (green) are both shown. Valence crossover (magenta) and first-order valence transition (FOVT) (red) surface are virtually drawn below 0 K. Valence crossover surface (blue) evolves into a phase boundary due to a virtual FOVT in the negative temperature. The critical end line at the border between FOVT and the crossover surface touches 0 K, forming a quantum critical point (QCP). a.u. arbitrary units.
Fig. 2. Doping dependence of the thermodynamic properties of α-YbAl1−xFexB4.
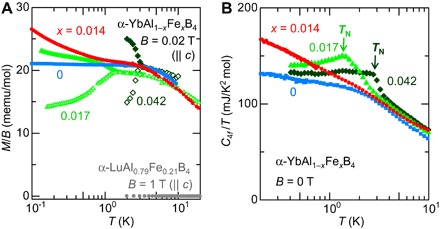
(A) T dependence of the c axis component of the DC susceptibility M/B for α-YbAl1−xFexB4 with various x and the nonmagnetic analog α-LuAl1−xFexB4. Both zero-field-cooling (ZFC) (open symbols) and field-cooling (FC) (closed symbols) sequences were used. (B) Temperature dependence of the 4f electronic contribution to the specific heat divided by T, C4f/T, which is obtained after subtracting the nonmagnetic contribution estimated using the specific heat of α-LuAlB4 (see the Supplementary Materials for details).
Strikingly, a sharp valence crossover was observed at xc by hard x-ray photoemission spectroscopy (HAXPES) at 20 K, where the valence exhibits a sudden increase by 0.03 (corresponding to a 3% increase of 4f hole density) (Fig. 1B). Typical Yb 3d5/2 core level spectra for x = 1.3% and x = 4.2% are shown in Fig. 1C (top), which exhibits a clear separation between the peaks associated with Yb2+ and Yb3+ states. Here, the valence is estimated using the ratio of the areas for these two peaks (see the Supplementary Materials for details). As shown in Fig. 1C (bottom), the difference spectrum obtained by subtracting the x = 1.3% spectrum from the 4.2% spectrum shows that the Yb3+ (Yb2+) component grows (diminishes) by increasing x. Correspondingly, the effective moment μeff estimated from the low T susceptibility below 15 K shows a small increase across xc (fig. S4). Note that the observed 3% change in 4f hole concentration is sizable and amounts to more than ~20% of those found at the first-order valence transition (FOVT) in the prototypical systems such as Ce and YbInCu4 [10 to 15% of 4f electrons/holes (32–34)].
This steep and continuous valence change may arise either from a sharp crossover or from a phase separation due to a weak first-order transition at xc. In the latter case, volume fractions of the phase-separated regions with distinct unit cell parameters may be expected to develop across xc, which is unlikely as we discuss here. First of all, our powder x-ray diffraction study at 17 K finds no broadening of x-ray diffraction spectra but, instead, a continuous volume contraction corresponding to the valence change (figs. S5A and S6). Low-temperature transmission electron microscopy detects no symmetry change in the lattice structure across xc (figs. S7 and S8). In addition, the unit cell volume is found to be proportional to the valence over the entire range including the critical region if we subtract the lattice part due to chemical doping (fig. S5B). All these observations indicate that there is no phase separation. This should also be the case at temperatures far below 17 K because no signature of a magnetic order induced by phase separation has been detected down to the lowest temperature of our measurements, that is, 25 mK. The associated unit cell volume change was found even at elevated temperatures of 175 and 273 K across xc (Fig. 1B). This shows that the energy scale of the valence crossover is much higher than the scale for the antiferromagnetism, indicating the dominant role of the valence fluctuations rather than spin fluctuations on the QC observed at xc.
If the valence fluctuations drive the QC, then the associated schematic phase diagram should look like the one given in Fig. 1D (8, 14, 35). Namely, the FOVT is suppressed down to zero or even negative temperature in the phase diagram. At finite temperatures, the system is controlled from a “mixed-valent regime” (MV) to a “Kondo regime” through a valence crossover surface by tuning either chemical pressure P or cell volume (−ΔV > 0). This is due to the fact that the radius is smaller for the magnetic Yb3+ ion than for the nonmagnetic Yb2+. When the system moves into the Kondo regime, a magnetic order may appear as a first-order transition as a function of P. At high temperatures, the magnetic degree of freedom effectively decreases the entropic free energy, thus stabilizing the Kondo regime rather than the MV, which defines the slope of the valence crossover surface.
To further examine the origin of the QC, we discuss the NFL behaviors found at xc in detail. Figure 2 represents the magnetic susceptibility M/B = χ and the 4f electronic contribution to the specific heat divided by T (C4f/T), for samples with different x, respectively. Here, C4f is obtained after subtracting the nonmagnetic contribution and nuclear Schottky contribution (see the Supplementary Materials for details). As seen in the figures, both χ and C4f/T are most divergent at xc = 1.4%. The T dependence of C4f/T shows a logarithmic increase on cooling. Note that there is a possible crossover from the logarithmic to a power law behavior with a fractional exponent β ~ 0.5, namely, C4f/T ~ T−β below around 100 mK as expected from the Maxwell relation and the T/B scaling found for the magnetization as shown below. However, the subtraction of the large nuclear contribution makes it hard to determine whether such a crossover exists (see the Supplementary Materials for details). Notably, in either case, our results indicate the divergence of quasi-particle mass at xc.
Significantly, the field evolution of M/B in weak fields below 50 mT follows the T/B scaling, the same as that found in β-YbAlB4 (24). As shown in Fig. 3A, the systematic field dependence of M/B can be collapsed onto a single scaling function φ(T/B) at T < 2 K; that is
| (1) |
| (2) |
with α = 3/2. This indicates that χ(T) diverges at B → 0 with a T−1/2 dependence and furthermore that the critical field Bc associated with the QC is close to zero. Note that if Bc is finite, then the scaling should be with respect to T/(B − Bc) rather than T/B. A systematic change from a zero-field NFL to a field-induced FL behavior at xc was also confirmed by the T dependence of the resistivity. The contour plot of the power law exponent α indicates an anomalous power law dependence at zero-field (T linear at 5 K > T > 1 K and T1.6 well below 1 K), which crossovers to the FL with α ~ 2 in a magnetic field (Fig. 3B, see also fig. S10, A and C).
Fig. 3. Zero-field QC and its field suppression at xc = 1.4% in α-YbAl1−xFexB4.
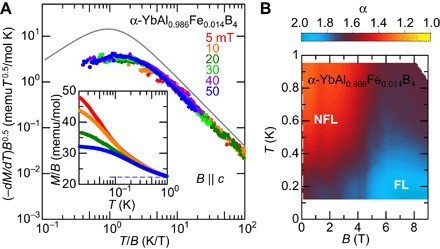
(A) Scaling observed for the magnetization M in the T < 2 K and B < 50 mT. The data can be fitted to the scaling function φ(t) = Λt(A + t2)−n with t = T/B, a form chosen to satisfy the appropriate limiting behaviors in the FL regime (24). The solid line is the fitted data for β-YbAlB4 (24). The inset is the T dependence of the DC susceptibility M/B for xc in α-YbAl1−xFexB4 under various fields (solid line). Data at x = 4.2% under B = 3.5 T are also shown (broken line). (B) Contour plot of the power law exponent α = ∂ln(ρ(T) − ρ(0))/∂lnT of the a axis resistivity ρa(T) in the B-T phase diagram of α-YbAl1−xFexB4 at xc.
A sudden emergence of TN > 1.2 K with only a very small change in Fe concentration from xc = 1.4% to x = 1.5% indicates the first-order character of the AF transition, which suggests the subsidiary role of the magnetism and associated spin fluctuations for the QC found at xc. To further demonstrate this, in the following, we compare the zero-field QC at xc with a field-induced AF QC for the samples at x = 4.2%. In general, application of the magnetic field stabilizes the Kondo regime with higher valence. As shown schematically in Fig. 1D, the valence crossover surface will move to the smaller x, that is, the smaller P under magnetic field. Therefore, for the sample well inside the AF phase at zero-field, the field-induced AF QCP will be separated from the valence instability. This allows us to study the QC associated solely with AF using the sample at x = 4.2%.
Figure 4A provides the phase diagram for x = 4.2%, determined by magnetothermal and transport measurements, combined with a contour plot of α, showing that TN vanishes at the transition field BN ~ 3.5 T. A fan-shaped NFL region with α ~ 1.6 is clearly seen at BN, which systematically crossovers to FL (α = 2) at lower and higher fields (see also fig. S10B). In sharp contrast to the zero-field QC found at xc, the magnetic susceptibility does not show a divergent behavior toward the field-induced QCP at BN. As shown in Fig. 4B, the bifurcation between FC and ZFC data disappears above BN = 3.5 T. Correspondingly, the magnetization divided by the field M/B at 80 mK peaks at BN (Fig. 4D), and dM/dB forms a broad peak at 2.9 T < BN (Fig. 4C). This is in sharp contrast to the much sharper and larger peak in dM/dB expected at 80 mK by scaling Eq. 1 at BN (broken line in Fig. 4C). The observation discriminates the unconventional form of the zero-field QC at xc from the one at the field-induced AF instability. The T1.6 dependence of the resistivity and the nondivergent temperature dependences of the susceptibility (broken line in the inset of Fig. 3A) are all consistent with the behaviors predicted for an AF SDW instability (30, 31). At the same time, this comparison naturally leads us to conclude that the zero-field QC accompanied by the sharp valence crossover at xc is induced not by the AF instability but by the proximity to a quantum valence instability.
Fig. 4. Field-induced QC of the antiferromagnetism in α-YbAl1−xFexB4 (x = 4.2%).
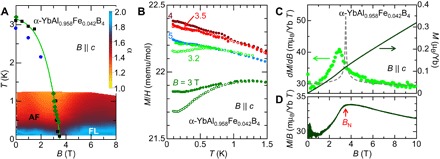
(A) Field-temperature phase diagram of the antiferromagnetism. Contour plot of the power law exponent α = ∂ln(ρ(T) − ρ(0))/∂lnT of the a axis resistivity ρa(T) in the B-T phase diagram of α-YbAl1−xFexB4 (x = 4.2%). The Néel points determined by the specific heat C (circles), magnetization M (diamonds), and the resistivity ρ (squares) measurements are shown. (B) T dependence of the DC susceptibility M/B under various fields close to the transition field BN. Both ZFC (open symbols) and FC (closed symbols) sequences were used. (C) Magnetization curve measured at T = 80 mK (right axis) and its field derivative ∂M/∂B (left axis). The broken line is calculated from scaling Eq. 1 using the parameters determined for the fitting to the data of α-YbAl1−xFexB4 at xc = 1.4%. Note that, here, the critical field Bc is shifted from zero field to BN ~ 3.5 T. (D) Magnetization divided by the magnetic field M/B at T = 80 mK as a function of B. The red arrow indicates BN = 3.5 T, where M/B starts to be suppressed with decreasing B. Consistently, the DC susceptibility exhibits bifurcation between FC and ZFC below BN, as shown in (B).
DISCUSSION
Theoretically, quantum valence criticality has been studied by various authors (6–9). In particular, the mode-coupling theory predicts the exact behaviors experimentally observed under zero field at xc, that is, T−1/2 divergence of the magnetic susceptibility (and also T/B scaling) and the crossover from T linear to T3/2 dependence of the resistivity as T → 0 (8, 36). These NFL properties arise from the divergence of the electronic effective mass and the local character of the valence fluctuations (8). In addition, the concomitant magnetic instability at a valence crossover is theoretically expected to result in a first-order magnetic transition, consistent with our experimental observations (35). On the other hand, significant similarity to the QC in pure β-YbAlB4 indicates an alternative possibility, where a topological phase transition of the Fermi surface occurs in a topologically nontrivial vortex metal, showing divergence in χ with T−1/2 dependence and T/B scaling (37). A particularly interesting possibility is that a topological vortex metal could provide a natural way for valence fluctuations to become quantum critical as the f level reaches at the Fermi energy. Note that both scenarios require a fine-tuning of the system to the QCP at B = 0 to satisfy the T/B scaling. Another interesting possibility would be the appearance of a second-order transition forming a QCP when the FOVT hits the absolute zero from the negative temperature side. Finally, our observation of quantum valence criticality provides a specific example of how quantum fluctuations may affect a supercritical fluid state by suppressing the critical temperature to near-zero temperatures.
MATERIALS AND METHODS
Single crystals of α-YbAl1−xFexB4 (x ≤ 4.2%) were grown by the aluminum self-flux method (27, 29). The Fe concentration was estimated by inductively coupled plasma spectroscopy with resolution of 0.01%. Powder x-ray diffraction measurements were carried out from room temperature down to 16 K using a commercial x-ray diffraction system (RINT2100, Rigaku) in the angle range between 10° ≤ 2θ ≤ 90°. α-YbAl1−xFexB4 and a silicon standard (standard reference material 640c, National Institute of Standards and Technology) were measured simultaneously to eliminate the measurement error due to the optical configuration of the x-ray system. We analyzed diffraction patterns to determine the crystal structure and lattice constant using the Rietveld analysis program PDXL (Rigaku) and found no impurity phase or structural transition from the pure system. Electron diffraction patterns for x = 0 and x = 4.2 % at 300 and 13 K were obtained using a transmission electron microscope (JEM-2010F, JEOL Ltd.) operating at a voltage of 200 kV.
We measured the electrical resistivity, DC magnetization, and specific heat of α-YbAl1−xFexB4. The electrical resistivity was measured by the standard four-probe method using a variable temperature insert above 2 K and by using a dilution refrigerator above 50 mK. The magnetization M above 2 K was measured using a commercial SQUID magnetometer, Quantum Design Magnetic Property Measurement System in the field ranging from 0.02 to 1 T. At low temperatures, the magnetization below 0.05 T was measured by a magnetometer made using DC-SQUID probes (Tristan Technologies) in conjunction with a 3He-4He dilution refrigerator down to 25 mK. Earth’s magnetic field was eliminated by using a Nb superconducting shield covered with a μ-metal tube. Above 3 T, the magnetization was measured using the Faraday method in a dilution refrigerator down to 80 mK (38). The specific heat was measured by a thermal relaxation technique. The Quantum Design Physical Property Measurement System was used for the measurements above 0.4 K. For measurements at lower temperatures down to 30 mK, a home-made specific heat cell installed in a 3He-4He dilution refrigerator was used.
HAXPES experiments were performed at the RIKEN Coherent X-ray Optics Beamline (BL29XU) in the SPring-8 synchrotron facility (39, 40). Photoelectrons excited by a 7.94-keV x-ray were analyzed using a Scienta R4000-10kV hemispherical electron spectrometer. The total energy resolution was set to ΔE = 250 meV. Clean crystal surfaces were obtained by fracturing in situ under the base pressure of ~ 10−8 Pa at room temperature. All spectra were acquired at the sample temperature of 20 K. The Fermi level EF was determined by measuring the Fermi edge of an evaporated Au film electrically contacted to the sample.
Supplementary Material
Acknowledgments
We thank E. C. T. O’Farrell, N. Horie, S. Watanabe, and K. Ueda for support and useful discussions. Funding: This work was partially supported by Grants-in-Aid for Scientific Research (16H02209) and Program for Advancing Strategic International Networks to Accelerate the Circulation of Talented Researchers (no. R2604) from the Japanese Society for the Promotion of Science; by Grants-in-Aids for Scientific Research on Innovative Areas (15H05882, 15H05883, and 26103002) of the Ministry of Education, Culture, Sports, Science, and Technology of Japan; and by the Core Research for Evolutionary Science and Technology (JPMJCR15Q5), Japan Science and Technology Agency. The use of the facilities of the Materials Design and Characterization Laboratory at the Institute for Solid State Physics, The University of Tokyo, is acknowledged. HAXPES experiments were performed at BL29XU in SPring-8 with the approval of RIKEN (proposal nos. 20090041 and 20100057). Author contributions: K.K. and Y.M. contributed equally to this project including sample preparation, thermodynamic and transport measurements, and data analysis/interpretation. M.O. conducted HAXPES measurements and contributed to data analysis and interpretation. Y.T., M.M., R.E., M.T., A.C., S. Shin, K.T., Y.N., M.Y., and T.I. contributed to HAXPES measurements. S. Suzuki., K.S., and D.N.-H. contributed to structural analyses. Y.S., T.S., and Y.K. carried out low-temperature magnetization measurements. S.N. conceived the project and planed the research and contributed to crystal growth, characterization, and data interpretation. S.N., Y.M., and K.K. wrote the paper. All authors discussed the results and commented on the manuscript. Competing interests: The authors declare that they have no competing interests. Data and materials availability: All data needed to evaluate the conclusions in the paper are present in the paper and/or the Supplementary Materials. Additional data related to this paper may be requested from the authors.
SUPPLEMENTARY MATERIALS
Supplementary material for this article is available at http://advances.sciencemag.org/cgi/content/full/4/2/eaao3547/DC1
Supplementary text
fig. S1. Yb 3d and Al 1s core level spectrum of α-YbAlB4.
fig. S2. Yb 3d core level fitting for HAXPES data.
fig. S3. Temperature dependence of the magnetic susceptibility obtained under a field of 0.1 T along the c axis for x = 0, 1.0, 1.4, and 1.7% and along the ab plane for x = 0 and 4.2%.
fig. S4. Temperature dependence of the inverse magnetic susceptibility obtained under a field of 0.1 T along the c axis for x = 0, 1.0, 1.4, 1.7, and 4.2%.
fig. S5. Fe density dependence of the lattice constant and its relation to the Yb valence change.
fig. S6. Normalized powder x-ray diffraction data at around 400 peak for α-YbAl1−xFexB4 (x = 0.5, 1.3, 1.4, 1.7, and 2.2%), where the intensity and the scattering angle 2θ are normalized by those values at the main peak.
fig. S7. Electron diffraction patterns of x = 0 for [001] direction at 300 and 14 K (top) and for [010] direction at 300 and 13 K (bottom).
fig. S8. Electron diffraction patterns of x = 4.2% for [001] direction at 300 and 14 K (top) and for [3-10] direction at 300 and 13 K (bottom).
fig. S9. The temperature dependence of the specific heat C divided by temperature T obtained at x = 0 and 1.4%.
fig. S10. Anomalous power law temperature dependence of the a-axis resistivity at the zero-field quantum valence criticality and the field-induced antiferromagnetic instability.
REFERENCES AND NOTES
- 1.Y. Arai, T. Sako, Y. Takebayashi, Supercritical Fluids (Springer, 2002). [Google Scholar]
- 2.Knez Ž., Markočič E., Leitgeb M., Primožič M., Knez Hrnčič M., Škerget M., Industrial applications of supercritical fluids: A review. Energy 77, 235–243 (2014). [Google Scholar]
- 3.Grigera S. A., Perry R. S., Schofield A. J., Chiao M., Julian S. R., Lonzarich G. G., Ikeda S. I., Maeno Y., Millis A. J., Mackenzie A. P., Magnetic field-tuned quantum criticality in the metallic ruthenate Sr3Ru2O7. Science 294, 329–332 (2001). [DOI] [PubMed] [Google Scholar]
- 4.Weickert F., Brando M., Steglich F., Gegenwart P., Garst M., Universal signatures of the metamagnetic quantum critical endpoint: Application to CeRu2Si2. Phys. Rev. B 81, 134438 (2010). [Google Scholar]
- 5.Furukawa T., Miyagawa K., Taniguchi H., Kato R., Kanoda K., Quantum criticality of Mott transition in organic materials. Nat. Phys. 11, 221–224 (2015). [Google Scholar]
- 6.Dzero M., Norman M. R., Paul I., Pépin C., Schmalian J., Quantum critical end point for the Kondo volume collapse model. Phys. Rev. Lett. 97, 185701 (2006). [DOI] [PubMed] [Google Scholar]
- 7.Hackl A., Vojta M., Kondo volume collapse, Kondo breakdown, and Fermi surface transitions in heavy-fermion metals. Phys. Rev. B 77, 134439 (2008). [Google Scholar]
- 8.Watanabe S., Miyake K., Quantum valence criticality as an origin of unconventional critical phenomena. Phys. Rev. Lett. 105, 186403 (2010). [DOI] [PubMed] [Google Scholar]
- 9.Pixley J. H., Kirchner S., Ingersent K., Si Q., Kondo destruction and valence fluctuations in an Anderson model. Phys. Rev. Lett. 109, 086403 (2012). [DOI] [PubMed] [Google Scholar]
- 10.Widom B., Equation of state in the neighborhood of the critical point. J. Chem. Phys. 43, 3898–3905 (1965). [Google Scholar]
- 11.Simeoni G. G., Bryk T., Gorelli F. A., Krisch M., Ruocco G., Santoro M., Scopigno T., The Widom line as the crossover between liquid-like and gas-like behaviour in supercritical fluids. Nat. Phys. 6, 503–507 (2010). [Google Scholar]
- 12.Yuan H. Q., Grosche F. M., Deppe M., Geibel C., Sparn G., Steglich F., Observation of two distinct superconducting phases in CeCu2Si2. Science 302, 2104–2107 (2003). [DOI] [PubMed] [Google Scholar]
- 13.Holmes A. T., Jaccard D., Miyake K., Signatures of valence fluctuations in CeCu2Si2 under high pressure. Phys. Rev. B 69, 024508 (2004). [Google Scholar]
- 14.Wada S., Yamamoto A., Ishida K., Sarrao J. L., Competition between valence and spin fluctuations in the vicinity of the quantum critical point of the heavy fermion compound YbAuCu4. J. Phys. Condens. Matter 20, 175201 (2008). [Google Scholar]
- 15.Yamaoka H., Jarrige I., Tsujii N., Lin J.-F., Hiraoka N., Ishii H., Tsuei K.-D., Temperature and pressure-induced valence transitions in YbNi2Ge2 and YbPd2Si2. Phys. Rev. B 82, 035111 (2010). [Google Scholar]
- 16.Rueff J.-P., Raymond S., Taguchi M., Sikora M., Itié J.-P., Baudelet F., Braithwaite D., Knebel G., Jaccard D., Pressure-induced valence crossover in superconducting CeCu2Si2. Phys. Rev. Lett. 106, 186405 (2011). [DOI] [PubMed] [Google Scholar]
- 17.Fernandez-Pañella A., Balédent V., Braithwaite D., Paolasini L., Verbeni R., Lapertot G., Rueff J.-P., Valence instability of YbCu2Si2 through its magnetic quantum critical point. Phys. Rev. B 86, 125104 (2012). [Google Scholar]
- 18.Matsubayashi K., Hirayama T., Yamashita T., Ohara S., Kawamura N., Mizumaki M., Ishimatsu N., Watanabe S., Kitagawa K., Uwatoko Y., Pressure-induced valence crossover and novel metamagnetic behavior near the antiferromagnetic quantum phase transition of YbNi3Ga9. Phys. Rev. Lett. 114, 086401 (2015). [DOI] [PubMed] [Google Scholar]
- 19.Jiang W. B., Yang L., Guo C. Y., Hu Z., Lee J. M., Smidman M., Wang Y. F., Shang T., Cheng Z. W., Gao F., Ishii H., Tsuei K. D., Liao Y. F., Lu X., Tjeng L. H., Chen J. M., Yuan H. Q., Crossover from a heavy fermion to intermediate valence state in noncentrosymmetric Yb2Ni12(P,As)7. Sci. Rep. 5, 17608 (2015). [DOI] [PMC free article] [PubMed] [Google Scholar]
- 20.Löhneysen H. v., Rosch A., Vojta M., Wölfle P., Fermi-liquid instabilities at magnetic quantum phase transitions. Rev. Mod. Phys. 79, 1015 (2007). [Google Scholar]
- 21.Gegenwart P., Si Q., Steglich F., Quantum criticality in heavy-fermion metals. Nat. Phys. 4, 186–197 (2008). [Google Scholar]
- 22.Doniach S., The Kondo lattice and weak antiferromagnetism. Physica B+C 91, 231–234 (1977). [Google Scholar]
- 23.Nakatsuji S., Kuga K., Machida Y., Tayama T., Sakakibara T., Karaki Y., Ishimoto H., Yonezawa S., Maeno Y., Pearson E., Lonzarich G. G., Balicas L., Lee H., Fisk Z., Superconductivity and quantum criticality in the heavy-fermion system β-YbAlB4. Nat. Phys. 4, 603–607 (2008). [Google Scholar]
- 24.Matsumoto Y., Nakatsuji S., Kuga K., Karaki Y., Horie N., Shimura Y., Sakakibara T., Nevidomskyy A. H., Coleman P., Quantum criticality without tuning in the mixed valence compound β-YbAlB4. Science 331, 316–319 (2011). [DOI] [PubMed] [Google Scholar]
- 25.Okawa M., Matsunami M., Ishizaka K., Eguchi R., Taguchi M., Chainani A., Takata Y., Yabashi M., Tamasaku K., Nishino Y., Ishikawa T., Kuga K., Horie N., Nakatsuji S., Shin S., Strong valence fluctuation in the quantum critical heavy fermion superconductor β-YbAlB4: A hard x-ray photoemission study. Phys. Rev. Lett. 104, 247201 (2010). [DOI] [PubMed] [Google Scholar]
- 26.Tomita T., Kuga K., Uwatoko Y., Coleman P., Nakatsuji S., Strange metal without magnetic criticality. Science 349, 506–509 (2015). [DOI] [PubMed] [Google Scholar]
- 27.Macaluso R. T., Nakatsuji S., Kuga K., Thomas E. L., Machida Y., Maeno Y., Fisk Z., Chan J. Y., Crystal structure and physical properties of polymorphs of LnAlB4 (Ln = Yb, Lu). Chem. Mater. 19, 1918–1922 (2007). [Google Scholar]
- 28.Matsumoto Y., Kuga K., Tomita T., Karaki Y., Nakatsuji S., Anisotropic heavy-Fermi-liquid formation in valence-fluctuating α-YbAlB4. Phys. Rev. B 84, 125126 (2011). [Google Scholar]
- 29.Kuga K., Morrison G., Treadwell L., Chan J. Y., Nakatsuji S., Magnetic order induced by Fe substitution of Al site in the heavy fermion systems α-YbAlB4 and β-YbAlB4. Phys. Rev. B 86, 224413 (2012). [Google Scholar]
- 30.T. Moriya, Spin Fluctuations in Itinerant Electron Magnetism (Springer, 1985). [Google Scholar]
- 31.Millis A. J., Effect of a nonzero temperature on quantum critical points in itinerant fermion systems. Phys. Rev. B 48, 7183–7196 (1993). [DOI] [PubMed] [Google Scholar]
- 32.Röhler J., Wohlleben D., Kappler J. P., Krill G., The valence of cerium under high pressure. Phys. Lett. A 103, 220–224 (1984). [Google Scholar]
- 33.Sato H., Shimada K., Arita M., Hiraoka K., Kojima K., Takeda Y., Yoshikawa K., Sawada M., Nakatake M., Namatame H., Taniguchi M., Takata Y., Ikenaga E., Shin S., Kobayashi K., Tamasaku K., Nishino Y., Miwa D., Yabashi M., Ishikawa T., Valence transition of YbInCu4 observed in hard x-ray photoemission spectra. Phys. Rev. Lett. 93, 246404 (2004). [DOI] [PubMed] [Google Scholar]
- 34.Matsuda Y. H., Inami T., Ohwada K., Murata Y., Nojiri H., Murakami Y., Ohta H., Zhang W., Yoshimura K., High-magnetic-field x-ray absorption spectroscopy of field-induced valence transition in YbInCu4. J. Phys. Soc. Jpn. 76, 034702 (2007). [Google Scholar]
- 35.Watanabe S., Miyake K., Origin of drastic change of Fermi surface and transport anomalies in CeRhIn5 under pressure. J. Phys. Soc. Jpn. 79, 033707 (2010). [Google Scholar]
- 36.Watanabe S., Miyake K., T/B scaling in β-YbAlB4. J. Phys. Soc. Jpn. 83, 103708 (2014). [Google Scholar]
- 37.Ramires A., Coleman P., Nevidomskyy A. H., Tsvelik A. M., β-YbAlB4: A critical nodal metal. Phys. Rev. Lett. 109, 176404 (2012). [DOI] [PubMed] [Google Scholar]
- 38.Sakakibara T., Mitamura H., Tayama T., Amitsuka H., Faraday force magnetometer for high-sensitivity magnetization measurements at very low temperatures and high fields. Jpn. J. Appl. Phys. 33, 5067 (1994). [Google Scholar]
- 39.Ishikawa T., Tamasaku K., Yabashi M., High-resolution x-ray monochromators. Nucl. Instrum. Methods Phys. Res. Sect. A 547, 42–49 (2005). [Google Scholar]
- 40.Takata Y., Yabashi M., Tamasaku K., Nishino Y., Miwa D., Ishikawa T., Ikenaga E., Horiba K., Shin S., Arita M., Shimada K., Namatame H., Taniguchi M., Nohira H., Hattori T., Södergren S., Wannberg B., Kobayashi K., Development of hard x-ray photoelectron spectroscopy at BL29XU in SPring-8. Nucl. Instrum. Methods Phys. Res. Sect. A 547, 50–55 (2005). [Google Scholar]
- 41.S. Hüfner, Photoelectron Spectroscopy (Springer, ed. 3, 2003). [Google Scholar]
- 42.R. D. Cowan, The Theory of Atomic Structure and Spectra (University of California Press, 1981). [Google Scholar]
- 43.Doniach S., Šunjić M., Many-electron singularity in x-ray photoemission and x-ray line spectra from metals. J. Phys. C 3, 285 (1970). [Google Scholar]
- 44.Shirley D. A., High-resolution x-ray photoemission spectrum of the valence bands of gold. Phys. Rev. B 5, 4709 (1972). [Google Scholar]
- 45.Proctor A., Sherwood P. M. A., Data analysis techniques in x-ray photoelectron spectroscopy. Anal. Chem. 54, 13–19 (1982). [Google Scholar]
- 46.Klein M., Nuber A., Reinert F., Kroha J., Stockert O., Löhneysen H. v., Signature of quantum criticality in photoemission spectroscopy. Phys. Rev. Lett. 101, 266404 (2008). [DOI] [PubMed] [Google Scholar]
- 47.Klein M., Kroha J., Löhneysen H. v., Stockert O., Reinert F., Echo of the quantum phase transition of CeCu6−xAux in XPS: Breakdown of Kondo screening. Phys. Rev. B 79, 075111 (2009). [Google Scholar]
- 48.Dub O. M., Kuz’ma Y. B., David M. I., Tb-Fe-B and Lu-Fe-B ternary systems. Poroshk. Metall. 26, 563–566 (1987). [Google Scholar]
- 49.Jia Y. Q., Crystal radii and effective ionic radii of the rare earth ions. J. Solid State Chem. 95, 184–187 (1991). [Google Scholar]
Associated Data
This section collects any data citations, data availability statements, or supplementary materials included in this article.
Supplementary Materials
Supplementary material for this article is available at http://advances.sciencemag.org/cgi/content/full/4/2/eaao3547/DC1
Supplementary text
fig. S1. Yb 3d and Al 1s core level spectrum of α-YbAlB4.
fig. S2. Yb 3d core level fitting for HAXPES data.
fig. S3. Temperature dependence of the magnetic susceptibility obtained under a field of 0.1 T along the c axis for x = 0, 1.0, 1.4, and 1.7% and along the ab plane for x = 0 and 4.2%.
fig. S4. Temperature dependence of the inverse magnetic susceptibility obtained under a field of 0.1 T along the c axis for x = 0, 1.0, 1.4, 1.7, and 4.2%.
fig. S5. Fe density dependence of the lattice constant and its relation to the Yb valence change.
fig. S6. Normalized powder x-ray diffraction data at around 400 peak for α-YbAl1−xFexB4 (x = 0.5, 1.3, 1.4, 1.7, and 2.2%), where the intensity and the scattering angle 2θ are normalized by those values at the main peak.
fig. S7. Electron diffraction patterns of x = 0 for [001] direction at 300 and 14 K (top) and for [010] direction at 300 and 13 K (bottom).
fig. S8. Electron diffraction patterns of x = 4.2% for [001] direction at 300 and 14 K (top) and for [3-10] direction at 300 and 13 K (bottom).
fig. S9. The temperature dependence of the specific heat C divided by temperature T obtained at x = 0 and 1.4%.
fig. S10. Anomalous power law temperature dependence of the a-axis resistivity at the zero-field quantum valence criticality and the field-induced antiferromagnetic instability.