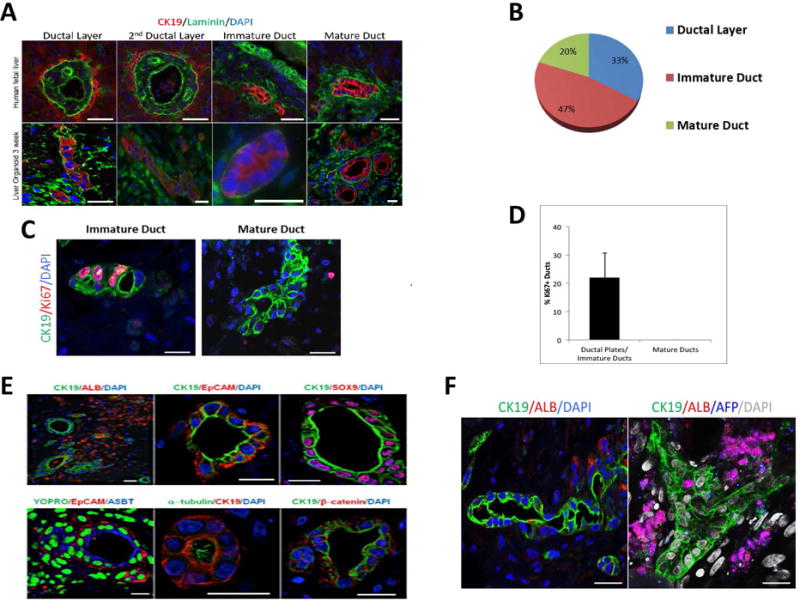
Figure 3. Bile duct formation and cholangiocyte differentiation of hFLPCs in liver organoids.

A) Different stages of ductal morphogenesis in human fetal liver tissue (top) and liver organoids after 3 weeks differentiation (bottom), stained with CK19 (red), laminin (green) (blue color denote DAPI-stained nuclei) staining. B) The relative proportions of the different stages of bile duct formations, as shown in A, were quantified and are presented as percent of total ductal structures. C) Proliferating cells are observed in immature (left panel), but not in more mature (middle panel), ductal structures and quantified (right panel). D) Graph representing percentage of Ki67 positive ducts in liver organoids. E) Characterization of ductal structures formed in liver organoids after 3 weeks of differentiation using antibodies against CK19, albumin, EpCAM, acetylated α-tubulin, apical sodium dependent bile transporter (ASBT), β-catenin and sex-determining region Y-box 9 (SOX9). F) A bile duct structure of more than 100μm surrounded by Albumin+ cells and branched biliary duct surrounded by AFP+/ALB+ hepatoblasts. Scale bar is 20 μm.
