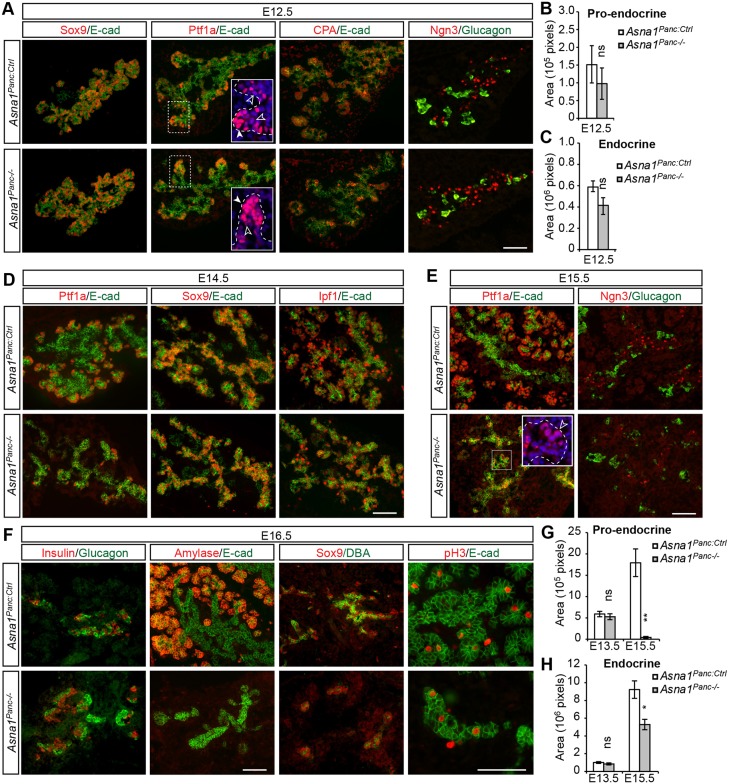
Fig. 2.
Impaired endocrine and acinar differentiation in Asna1Panc−/− DPE. (A) Immunohistochemistry of dorsal pancreatic sections from E12.5 Asna1Panc:Ctrl and Asna1Panc−/− embryos (n=3) using antibodies against Sox9, Ptf1a, CPA and Ngn3 (all red), and E-cadherin (E-cad) and glucagon (both green). Insets show Ptf1aHigh acinar progenitors (white arrowheads) and Ptf1aLow putative MPCs (black arrowheads). (B,C) Quantification of total pro-endocrine (Ngn3+) area (B) and total endocrine (glucagon+) area (C) in the DPE from Asna1Panc:Ctrl and Asna1Panc−/− embryos at E12.5 (n=3). (D-F) Immunohistochemistry of dorsal pancreatic sections from E14.5 (D), E15.5 (E) and E16.5 (F) Asna1Panc:Ctrl and Asna1Panc−/− embryos (n=3) using antibodies against Ptf1a, Sox9, Ipf1, Ngn3, insulin, amylase and phospho-histone H3 (pH3) (all red), and E-cadherin (E-cad) and glucagon or DBA lectin (DBA) (all green). Inset in E shows Ptf1aLow cells (black arrowhead). (G,H) Quantification of total pro-endocrine (Ngn3+) area (G) and total endocrine (glucagon++insulin+) area (H) in the DPE from Asna1Panc:Ctrl and Asna1Panc−/− embryos at E13.5 and E15.5 (n=5, respectively). Data are mean±s.e.m., *P<0.05, **P<0.01, ns, not significant (Student's t-test). Scale bars: 100 µm in A,D-F

