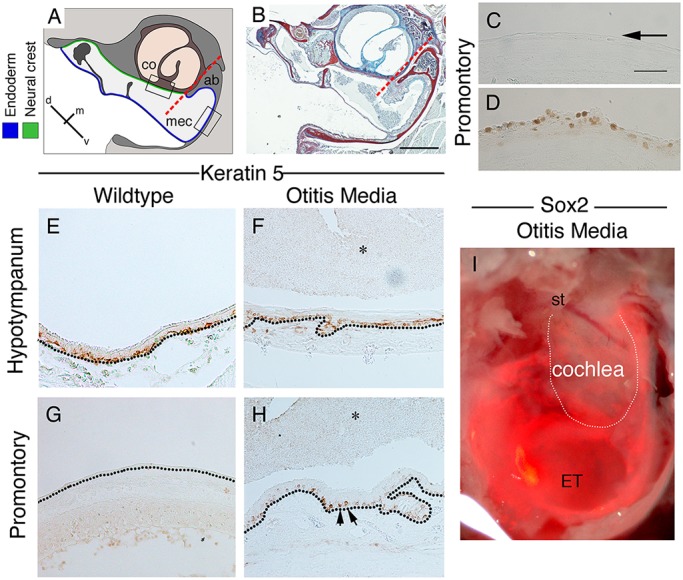
Fig. 6.

Changes to keratin 5, PCNA and Sox2 expression with otitis media. (A) Schematic of mouse middle ear in frontal section, highlighting the border between the endoderm and neural crest. (B) Trichrome stain of a Tbx1/+ middle ear with otitis media at 11.5 weeks. The ear is full of effusion and infiltrated cells, and the endodermally lined hypotympanum shows signs of hyperplasia. Dashed red lines in A,B indicate the border between neural crest and endoderm. (C-H) Frontal sections of mouse middle ear in Tbx1/+mice (D,F,H) and control littermates (C,E,G) at P28. (C,D) PCNA (brown) on promontory. Arrow in C highlights negative control epithelium. (E-H) Keratin 5 immunohistochemistry. In wild-type mice (E,G), keratin 5 is expressed by basal stem cells in the pseudostratified epithelium (E). (G) Only a few keratin 5-positive cells are observed in the simple epithelium overlying the cochlea. (F,H) In Tbx1/+ mice with otitis media, keratin 5 expression in the ventral middle ear looks similar to the wild type (F). (H) In contrast, overlying the cochlea, many keratin 5-positive cells were observed (arrows). (E-H) Dotted black lines indicate the basal lamina underlying the epithelium. (I) Whole-mount image of a Sox2creERT/tdTom auditory bulla with OM. Mouse injected 2 days prior to P21 to activate cre. Fluorescent image overlying bright-field image. Positive cells overlie the cochlea. st, stapes; ET, Eustachian tube. White line indicates the cochlea. Scale bars: 200 µm in B; in C, 100 µm for C-H.
