

Abstract
Objective:
Increased mammographic breast density is a well-established risk factor for breast cancer development, regardless of age or ethnic background. The current gold standard for categorizing breast density consists of a radiologist estimation of percent density according to the American College of Radiology (ACR) Breast Imaging Reporting and Data System (BI-RADS) criteria. This study compares paired qualitative interpretations of breast density on digital mammograms with quantitative measurement of density using Hologic’s Food and Drug Administration–approved R2 Quantra volumetric breast density assessment tool. Our goal was to find the best cutoff value of Quantra-calculated breast density for stratifying patients accurately into high-risk and low-risk breast density categories.
Methods:
Screening digital mammograms from 385 subjects, aged 18 to 64 years, were evaluated. These mammograms were interpreted by a radiologist using the ACR’s BI-RADS density method, and had quantitative density measured using the R2 Quantra breast density assessment tool. The appropriate cutoff for breast density–based risk stratification using Quantra software was calculated using manually determined BI-RADS scores as a gold standard, in which scores of D3/D4 denoted high-risk densities and D1/D2 denoted low-risk densities.
Results:
The best cutoff value for risk stratification using Quantra-calculated breast density was found to be 14.0%, yielding a sensitivity of 65%, specificity of 77%, and positive and negative predictive values of 75% and 69%, respectively. Under bootstrap analysis, the best cutoff value had a mean ± SD of 13.70% ± 0.89%.
Conclusions:
Our study is the first to publish on a North American population that assesses the accuracy of the R2 Quantra system at breast density stratification. Quantitative breast density measures will improve accuracy and reliability of density determination, assisting future researchers to accurately calculate breast cancer risks associated with density increase.
Keywords: Breast cancer, breast density, mammogram, breast tissue, BI-RADS, Quantra, computerized breast density, fibroglandular
Introduction
Breast cancer is the second leading cause of death in women. The association between breast density and risk of carcinoma has been established since 1976.1–3 High mammographic breast density is one of the strongest known predictors, with a 4 to 5 times increase in risk of breast cancer development,4 regardless of age or ethnic background. It is greater than most other known risk factors, including family history.5 It has also been shown that the sensitivity of radiologic diagnosis is inversely correlated with the degree of density, such that high breast density decreases sensitivity by as much as 25%.6,7 However, the association between breast density and risk for breast cancer cannot be explained by a reduction in screening sensitivity alone.8 Density of breast tissue is correlated directly with the number of ducts and lobes, which is where most cancers arise. This additional tissue has been postulated to have a cause/effect relationship with the increased risk, presuming an increased mutagenic potential.
The radiographic appearance of the breast on mammography varies among women and reflects variations in breast tissue composition and characteristics of these tissues on X-ray. Fat is radiologically lucent and appears dark on a mammogram. Connective and epithelial tissues are radiologically dense and appear light. These variations in appearance are commonly described as the percentage of the breast image that is radiologically dense or as percent mammographic density. On mammograms, dense breasts look white, and so does cancer, so the tissue can hide tumors. Fatty breasts show up mostly black, so tumors stand out.
The current gold standard for quantifying the degree of breast density is by radiology interpretation using the American College of Radiology (ACR) BI-RADS (Breast Imaging Reporting and Data System) categories. Studies have shown substantial variability in interpretation and reading accuracy among radiologists.9,10 The BI-RADS classification system categorizes breast tissue into 4 density types scored from D1 to D4. The population is distributed in an approximate bell-shaped curve with 10% of women having entirely fatty breasts (D1 ⩽ 25% density), 40% having scattered fibroglandular densities (D2 = 25%-50% density), 40% having heterogeneously dense breasts (D3 = 50%-75% density), and 10% having extremely dense breasts (D4 ⩾ 75% density) (Figure 1). The radiologist subjectively determines the BI-RADS density type using visual and computer-aided detection (CAD). Screening sensitivity for cancer is similar in the D1 and D2 categories at 82% to 88% and in the D3 and D4 categories at 62% to 69%6,7 (Figure 1).
Figure 1.

Representative examples of mammograms classified with the BI-RADS classification system. From left to right, successively, are “Fatty” or BI-RADS D1, <25% density; “Scattered fibroglandular” or BI-RADS D2, 25% to 50% density; “Heterogeneously dense” or BI-RADS D3, 50% to 75% density; and “Extremely dense” or BI-RADS D4, >75% density. BI-RADS indicates Breast Imaging Reporting and Data System.
There has been increased awareness of breast density as a risk factor for breast cancer.7 Early on, it was recognized that digital mammography had greater diagnostic accuracy than film mammography in women with dense breasts.11 Recent American Congress of Obstetricians and Gynecologists (ACOG) guidelines (April 2014)12 state that women with BI-RADS D3 and D4 have a modestly increased risk of breast cancer and experience a reduced sensitivity of mammograms to detect breast cancer. (Table 1).
Table 1.
BI-RADS breast density categories, demographics, sensitivity of cancer detection, and breast cancer risk.11,12.
| BI-RADS category | Description | Percentage of population | Sensitivity, % | Relative risk of breast cancer |
|---|---|---|---|---|
| 1 | Almost entirely fat <25% density | 10 | 88 | — |
| 2 | Scattered fibroglandular densities 25%-50% density | 43 | 82 | — |
| 3 | Heterogeneously dense 51%-75% density | 39 | 69 | 1.2 (compared with average breast density) |
| 4 | Extremely dense >75% density | 8 | 62 | 1.4 (compared with average breast density) |
Although categories have been established, the assessment of breast density is subjective and based on the level of training and experience of the radiologist. Numerous states have passed legislation requiring providers to inform women of the modest, increased risk and discuss supplemental tests to screening mammography for these women.13 Yet, according to the US Preventive Services Task Force (USPTF), 12.6% to 18.7% of mammograms are reclassified into a different overall category at their next screening exam when read by the same or different radiologist. This affects the certainty of any recommendation for supplemental screening. When supplemental screens are conducted in women with dense breasts, additional cancers, most of them invasive, will be identified, but may be associated with higher recall rates, additional biopsies, and patient anxiety. It is, however, unknown whether these cancers have better outcomes or how many represent cancers that would not be otherwise clinically apparent. The current published evidence does not support reduction in breast cancer mortality with supplemental tests.14 Stringent comparative studies of supplemental screening for women with dense breasts including clinical outcomes beyond breast cancer diagnosis are needed for all modalities. The USPTF strongly supports additional research to identify more effective screening methods that will both enhance meaningful improvements in cancer outcomes for women with dense breasts and minimize false-positive screening results.15
Given the potential discordance of different radiologists’ interpretations of the same mammogram into a BI-RADS category, an effort has been made to establish an objective, rather than subjective, measure of breast density. The computerized breast density software will allow breast density to be reported as a quantitative number, rather than a qualitative subjective read by the radiologist. Potential advantages include having not only a reliable and highly reproducible calculation but also increased speed of determining a breast density and increased efficiency of reporting it. The Food and Drug Administration (FDA) first gave marketing approval to Hologic, Inc. for the Quantra, in 2008, and R2 components, in 2009, of their computerized R2 Quantra volumetric breast density assessment tool. To validate the R2 Quantra system, it must be directly correlated to the current gold standard or BI-RADS categories. However, data to support criteria for adjustment of numerical computerized density assessment to the currently used BI-RADS categories do not exist. Six published studies to date have attempted to establish a percentage cutoff using Quantra to stratify accurately the densities into high- and low-risk categories but have reported inconsistent results. Two studies independently conducted in Turin, Italy, reported similar cutoffs of 22% and 21%.16,17 A third study from New Delhi, India,16 reported a Quantra cutoff of 19.5%, whereas a fourth study from Sydney, Australia,17 reported Quantra cutoffs of 20.0% overall and 20.5% in a validation subset. In contrast, a fifth study from Amsterdam, the Netherlands,18 reported a Quantra cutoff of 13.8%, whereas a sixth study from Oslo, Norway,19 reported a Quantra cutoff of 10.0% versus the median BI-RADS classification from 5 radiologists, along with cutoffs ranging from 8% to 15% versus BI-RADS classifications from the radiologists individually. In addition, one of the Turin studies contrasted their 22% cutoff with a much lower cutoff of 13% apparently shown in a 2009 oral presentation by investigators in a United States–based study.20,21 The aim of our study is to investigate an appropriate cutoff for risk stratification using the Hologic R2 Quantra software.
Methods
Subjects were recruited to undergo digital mammography using a Hologic Selenia Digital Mammography Unit with R2 ImageChecker CAD and completed a standard detailed questionnaire. Study data were collected and managed using REDCap (Research Electronic Data Capture) electronic data capture tools hosted at Meharry Medical College.22 REDCap is a secure, Web-based application designed to support data capture for research studies, providing (1) an intuitive interface for validated data entry, (2) audit trails for tracking data manipulation and export procedures, (3) automated export procedures for seamless data downloads to common statistical packages, and (4) procedures for importing data from external sources. The R2 ImageChecker CAD identifies regions of interest on mammography images and brings them to the attention of the radiologist to decrease false-negative readings. The questionnaire included demographics, lifestyle, environmental exposures, health status, family medical history, etc. A physical breast examination was performed. Mammograms were interpreted by a board-certified radiologist with more than 30 years of experience using the American Society of Radiology’s BI-RADS density method. This mammogram reporting system database is referred in the article as “mrsdata.” Quantitative density was measured using the recently FDA-approved Hologic’s Quantra volumetric computerized breast density software system version 2.0. Quantra is a fully automated and FDA-cleared software application that performs analysis of 4 standard mammography views to present a percentage of volumetric breast density of a subject. Breast density determination via the Quantra algorithm is based on a validated methodology which takes into account various imaging parameters used to acquire an image, such as kVp (kilovolt peak), mA s (milliampere-second), and relevant properties of the target and filter materials. Essentially, for each breast, the software segments the breast region from the background and estimates the thickness of the fibroglandular tissue above each image pixel inside the breast region. Using an estimate of breast thickness, it further calculates the total volume of fibroglandular tissue and the total volume of the breast. From these 2 values, percentage volumetric density is derived as the ratio of the volume of fibroglandular tissue to the total breast volume. This procedure is performed separately for each breast. The database containing these estimated breast densities is referred to in the article as the “Quantra Data.”
The 2 databases were combined using patient ID, the only field common to both. Subject data were merged into one record when duplicate records were found and eliminated when multiple blank entries for variables were identified. The combined records (N = 682) then were filtered for the presence of both a BI-RADS density classification from “mrsdata” and left and right breast densities from “Quantra Data.” This filtering process yielded a total of 385 observations that had both and thus were evaluable for subsequent classification analysis. The BI-RADS density classifications are categorical and assigned by the radiologist as follows: “Almost entirely fat (AEF),” “Scattered fibroglandular densities (SFD),” “Heterogeneously dense (HD),” and “Extremely dense,” which correspond, respectively, to BI-RADS density scores of D1, D2, D3, and D4. The Quantra data are quantitative and rounded to the nearest whole percent for each breast. For subsequent classification analysis, we followed Ciatto et al20 and dichotomized the BI-RADS category scores between D2 and D3, so that the lower 2 BI-RADS categories (D1 and D2) representing less density became a new category D1-2 (less dense), whereas the remaining category in our data set (all scored as heterogeneously dense) retained its name of D3 (more dense). The variable Average Density in “Quantra Data” contains the average of left and right breast densities quantitatively measured by Quantra software and thus is expressed in half-percent units; it is denoted as QD.
Statistical analysis
Subject characteristics (age, body mass index [BMI], number of live births, and menopause status) were summarized both overall and by BI-RADS density scores using means, standard deviations, medians, quartiles, ranges, and proportions as appropriate. Differences in subject characteristics between BI-RADS density groups were assessed for significance via either Kruskal-Wallis or χ2 tests. The same subject characteristics were also assessed for association with QD via Spearman correlation analysis. The relationship between QD and BI-RADS–based density groups was assessed visually using box plots and quantitatively using polyserial rank correlation. Comparisons and relationships were tested statistically at an α = .05 significance level. For classification analysis, logistic regression was used to investigate the relationship between QD and dichotomized BI-RADS categories, whereas receiver operating characteristics (ROC) analysis was used to find a dichotomization “cutoff” value of QD that maximizes its accuracy at classifying mammograms into the D3 versus D1-2 categories. Specifically, for each possible cutoff value of QD, the classification’s “sensitivity” (true-positive rate) and “specificity” (true-negative rate) were calculated along with a third quantity called the Youden index, which is equal to sensitivity + specificity − 1. The cutoff value of QD that maximizes the Youden index also maximizes the sum of sensitivity and specificity, thereby maximizing classification accuracy; this value was called the “best” QD-cutoff value. The results of the ROC analysis were displayed visually using an ROC curve that plots sensitivity against “1 − specificity” (the false-positive rate), and QD’s overall performance at distinguishing D3 from D1-2 was summarized using the area under the ROC curve or ROC AUC. Finally, to assess the stability of the best QD-cutoff value to changes in the data, we used bootstrap analysis with a total of 10 000 resamplings with replacement from the original data. For each resampling, the best QD-cutoff value was redetermined, and results were displayed graphically as a bar chart and summarized as the mean and standard deviation.
Results
Mammography data were evaluable for 385 subjects, including 77 subjects (20.0%) scored as BI-RADS D1 (AEF), 113 subjects (29.4%) scored as BI-RADS D2 (SFD), and 195 subjects (50.6%) scored as BI-RADS D3 (HD); none were scored as D4. Table 2 provides descriptive statistics on 4 demographic characteristics (age, BMI, number of live births, and menopausal status), both overall and divided by BI-RADS category. Body mass index was significantly associated with BI-RADS density category (P < .0001), such that the means, medians, and quartiles of BMI were systematically increased in D1 compared with D2 and systematically decreased in D3 compared with D2. Age, number of live births, and menopause status were not significantly associated with BI-RADS category.
Table 2.
Subject characteristics.
| All subjects (N = 385) | D1a (N = 77) | D2a (N = 113) | D3a (N = 195) | P valueb | |
|---|---|---|---|---|---|
| Age, y | .28 | ||||
| No. of subjects reporting | 385 | 77 | 113 | 195 | |
| Mean (SD) | 51.2 (7.6) | 52.1 (6.8) | 51.8 (7.6) | 50.5 (7.9) | |
| Median | 51 | 52 | 51 | 51 | |
| Quartiles | 46–56 | 47–57 | 46–56 | 45–55 | |
| Range | 24–77 | 41–68 | 32–77 | 24–77 | |
| BMI, kg/m2 | <.0001 | ||||
| No. of subjects reporting | 350 | 67 | 102 | 181 | |
| Mean (SD) | 32.2 (8.1) | 36.7 (9.8) | 33.8 (7.8) | 29.7 (6.5) | |
| Median | 30.8 | 34.9 | 32.9 | 28.3 | |
| Quartiles | 26.6–36.5 | 30.2–41.1 | 28.9–38.8 | 25.1–32.9 | |
| Range | 16.4–63.1 | 18.3–63.1 | 16.4–58.2 | 18.0–54.9 | |
| Number of live births | .47 | ||||
| No. of subjects reporting | 350 | 75 | 106 | 169 | |
| 0 live births, No. (%)c | 53 (15) | 12 (16) | 11 (10) | 30 (18) | |
| 1 live birth, No. (%) | 65 (19) | 12 (16) | 21 (20) | 32 (19) | |
| 2 live births, No. (%) | 104 (30) | 19 (25) | 36 (34) | 49 (29) | |
| 3 live births, No. (%) | 64 (18) | 15 (20) | 21 (20) | 28 (17) | |
| 4 live births, No. (%) | 40 (11) | 10 (13) | 12 (11) | 18 (11) | |
| 5 live births, No. (%) | 13 (4) | 2 (3) | 2 (2) | 9 (5) | |
| 6 or more, No. (%) | 11 (3) | 5 (7) | 3 (3) | 3 (2) | |
| Mean (SD) live births | 2.2 (1.6) | 2.4 (1.7) | 2.2 (1.5) | 2.1 (1.5) | |
| Menopause status | .13† | ||||
| No. of subjects reporting | 385 | 77 | 113 | 195 | |
| Premenopause, No. (%)C | 202 (52) | 35 (45) | 55 (49) | 112 (57) | |
| Postmenopause, No. (%) | 183 (48) | 42 (55) | 58 (51) | 83 (43) | |
BI-RADS density categories: D1 = Almost entirely fat; D2 = Scattered fibroglandular densities; D3 = Heterogeneously dense; D4 = Extremely dense. No subject fell into the D4 category.
P values for comparing BI-RADS density categories are computed using the Kruskal-Wallis test, except when †the χ2 test was used. All statistical tests had 2 degrees of freedom.
Number of subjects (percent of the number of subjects reporting).
The polyserial rank correlation between QD and the 3 ordered BI-RADS categories was found to be 0.487 (P < .0001). The Spearman correlations between QD and the variables listed in Table 2 are tabulated in Table 3. All 4 correlations were negative, modest in magnitude (between −0.10 and −0.20), and statistically significant at α = .05.
Table 3.
Correlation of subjects’ age, BMI, no. of live births, and menopause status with their QD..
| Variables | N | Spearman correlation | P value |
|---|---|---|---|
| Age and QD | 385 | −0.182 | .0003 |
| BMI and QD | 350 | −0.130 | .015 |
| No. of live births and QD | 350 | −0.145 | .0067 |
| Menopause status and QD | 385 | −0.105 | .039 |
Abbreviation: BMI, body mass index.
Based on the 3 categories created by the radiologist, the box plots (in log scale) of corresponding QD are shown in Figure 2 (first 3 from the left). The box plots of QD based on the combined D1-2 (less dense) versus D3 categories are also shown in Figure 2 (fourth and fifth from the left).
Figure 2.
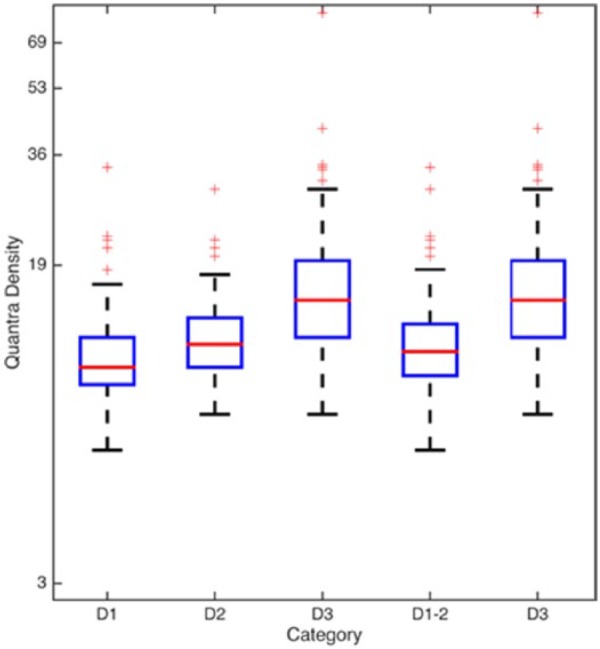
Quantra densities corresponding to BI-RADS–based density categories. Box plots of Quantra densities (values of Average Density, QD) versus different BI-RADS density score groupings. The first 3 boxes on the left (above D1, D2, and D3) show the relative distributions of QD versus the original BI-RADS density scores assigned by the radiologist. The fourth and fifth boxes from the left (above D1-2 and D3) also show the relative distributions of the QD but this time against the dichotomized BI-RADS density scores. BI-RADS indicates Breast Imaging Reporting and Data System.
A logistic regression model was constructed between the categorical variable D and QD, where
The fitted model had estimates ± standard errors of −3.438 ± 0.460 for the intercept and 0.248 ± 0.033 for the regression coefficient on QD (both P values <.0001). The fitted model’s equation was therefore
where Pr(D = 1) represents the probability that D = 1.
In Figure 3, the Youden index is the vertical distance between the ROC curve and the chance line y = x. This vertical distance was found to be maximized at the ROC curve’s (x, y) coordinates (0.2263, 0.6564), which corresponds to sensitivity = 0.6564 and specificity = 0.7737. The “best” QD-cutoff value that achieves this maximized Youden index is 14.0%. In Table 4, measures corresponding to the best cutoff value were tabulated.
Figure 3.

ROC curve of Quantra density versus breast density risk group. ROC curve (in red) for using Quantra density values (QD) to classify mammograms into the high-risk D3 group versus the low-risk D1-2. The vertical axis represents sensitivity. The horizontal axis represents “1 − Specificity” or the false-positive rate. AUC means ROC AUC or area under the ROC curve. The “y = x” line (in blue) represents the hypothetical ROC curve expected when Quantra density performs no better than chance at classifying mammograms into the correct risk category. The point on the ROC curve with coordinates (0.2263, 0.6564) is the point that maximizes the Youden index; this point corresponds to a QD-cutoff value of 14.0%. The vertical dashed line from the ROC curve to the y = x line denotes the Youden index drawn at its maximum length of (0.6564 − 0.2263) = 0.4301. ROC indicates receiver operating characteristic.
Table 4.
Measures corresponding to the best cutoff average Quantra density value.
| Measure | Value | Std. error |
|---|---|---|
| Sensitivity | 0.6564 | 0.0340 |
| Specificity | 0.7737 | 0.0304 |
| Positive predicted value | 0.7485 | 0.0332 |
| Negative predicted value | 0.6869 | 0.0317 |
Results of using bootstrap analysis to assess the stability of the best QD-cutoff value to changes in the data are shown in the histogram of Figure 4. Although the range of bootstrap-selected cutoffs extends from 11.5% to 18.0%, the histogram shows that 95.14% of the bootstrap-selected cutoffs lie between 12.5% and 14.5%, inclusive. The entire bootstrap distribution of best QD-cutoff values has a mean ± SD of 13.697% ± 0.886%.
Figure 4.
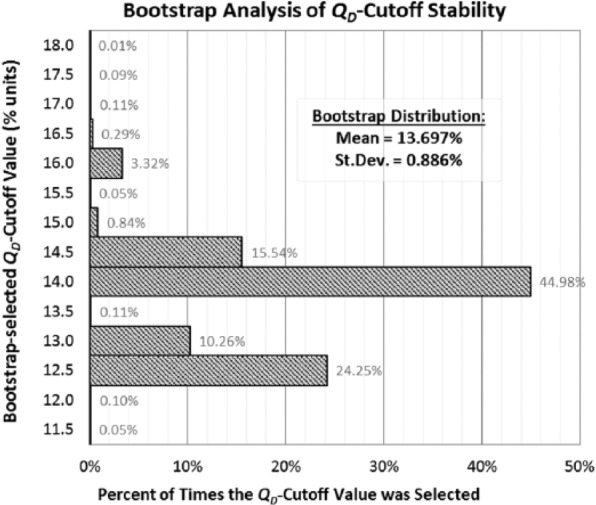
Bootstrap analysis of the stability of the Quantra density cutoffs from ROC analysis. The bootstrap analysis was conducted with 10 000 resamplings with replacement from the original data set. In each resampling, the QD-cutoff value that maximized the Youden index was redetermined. The entire distribution of bootstrap-selected QD cutoffs is displayed in the histogram. The bootstrap distribution’s mean ± SD is 13.697% ± 0.886%, and 95.14% of the bootstrap-selected QD cutoffs lie between 12.5% and 14.5%, inclusive. ROC indicates receiver operating characteristic.
Discussion
Given the shift in standard of care to evaluate and report density as an aspect of the screening mammogram, the advantages to a quantitative evaluation rather than a visual interpretation of breast density are evident. Such advantages include increased speed of determining breast density, increased efficiency of reporting it, and having a reliable, highly reproducible calculation to report. This in fact can increase the US population’s access to the same level of care, as most of the mammograms are not read by radiologists specifically trained to interpret breast density. The R2 Quantra Hologic software is a volumetric computerized breast density tool developed for this purpose. This study aims to establish a cutoff percentage to discriminate the D3/D4 from the D2/D1 categories. Unlike prior studies, a single board-certified radiologist specifically trained and with more than 30 years of experience in classifying breast density, assigned the radiologic images to their respective categories. The same digital images were analyzed using the Quantra software to assign a density percentage. The density percentage is established in this data set to maximize both sensitivity and specificity.
Age, BMI, number of live births, and menopause status of patients were significantly negatively correlated with their QD densities. The exploratory analysis of visual assessment and QD did not yield a nonoverlapping cutoff value for the density (5 box plots from the left in Figure 2). The ROC analysis identified that the “best” cutoff value of QD to minimize the false-positive and false-negative rates was found to be 14.0%. Because QD increases in half-percent increments, this means that if a patient’s QD was 13.5% or less, she belonged to the D1-2 category, but if her QD was 14.0% or more, then she belonged to the D3 category. This finding of a 14% cutoff is similar to the 13.8% cutoff reported by the Amsterdam study18 and the 10% cutoff reported by the Oslo study,19 and also similar to the unpublished 13% cutoff attributed by Ciatto et al20 to the United States–based study of Rafferty et al.21 In contrast, the independent studies done by Ciatto et al20 and Regini et al23 in an Italian population reported 22% and 21%, respectively, as the optimal Quantra density cutoff value. Also in contrast were the high Quantra density cutoffs of 19.5% and 20%, respectively, reported by the studies from India and Australia.16,17 It is unclear why the different studies have such disparate cutoffs. One possibility may relate to race and ethnicity. In our study, 56% of the population were from an urban lower socioeconomic group, with health care coverage through state or federal programs. The racial distribution of population served is 43% African American, 29% other race, and 27% white. The other studies do not report their demographics, although at least one18 was conducted in a city well known for its ethnic diversity.
In our study, the area below the ROC curve (Figure 3) was found to be 0.7708 with standard error ±0.0239 (P < .0001) which means that if a randomly chosen individual from the high-density group were paired with a randomly chosen individual from the low-density group, then there is about a 77% ± 2% chance that the high-density individual will have the higher QD. The sensitivity (0.6564) corresponding to the best cutoff value represents, among patients classified as high density by the radiologist, the fraction of patients that were also classified by QUANTRA as high density. The specificity (0.7737) corresponding to the best cutoff value represents, among patients classified as low density by the radiologist, the fraction of patients that were also classified by QUANTRA as low density. Five of the 6 other published studies,16–18,20,23 plus the abstract of the unpublished study of Rafferty et al21 reported sensitivity and specificity. Their sensitivities and specificities were uniformly higher than ours, with sensitivities ranging from 78% to 91% and specificities ranging from 77% to 92%. We believe that this was due to the absence of D4 subjects in our study population.
The positive predicted value (PPV) corresponding to the best cutoff value was 0.7485, denoting the fraction of patients predicted by their QD value to be D3 who actually were classified beforehand as D3 by the radiologist. The negative predicted value (NPV) corresponding to the best cutoff value was 0.6869, the fraction of patients predicted by their QD value to be D1/D2 who actually were classified beforehand as D1/D2 by the radiologist. Note that the PPV and NPV will vary depending on the prevalence of higher density in the patient population. Only one other study published PPV and NPV; they found PPV = 87% and NPV = 83%.23
When fitted to the data from our study population, the logistic regression model yielded 0.248 ± 0.033 as the coefficient value ± standard error for the QD. This coefficient value, 0.248, is the natural log of the odds ratio associated with a 1-unit increase in QD. That is, for every one percentage-point increase in QD, we estimate that the odds of a subject in our population belonging to the D3 category will increase by 28% (e0.248 = 1.28).
Strengths of this study include a large study population and the radiologist’s level of training in interpreting breast density. The single radiologist read also poses a potential limitation of this study in that it decreases possible application to other clinics/radiology practices. However, it is reassuring that the findings were consistent with the published studies from Amsterdam and Oslo,18,19 as well as with the unpublished United States–based study of Rafferty et al.21 It remains a conundrum why these 3 studies and our study are at variance with the studies from Turin, New Delhi, and Sydney.16,17,20,23
Conclusions
Our study is the first published study in a North American population that assesses the accuracy of the R2 Quantra volumetric breast density assessment tool to stratify patients into high-risk and low-risk BI-RADS breast density categories. Quantra is an FDA-approved tool to quantitatively measure breast density. Given its ease of acquisition, this may become the future of breast density quantification in the digital age. Although the increased awareness of breast density as a breast cancer risk factor has, in fact, already established a change in the standard of care, additional studies in a large, diverse population are necessary to investigate the utility of a change in surveillance practices.
Acknowledgments
The authors would like to thank Donna Eastham, BA, CRS, for her editing skills and for her help in compiling and submitting this manuscript. Study data were collected and managed using REDCap electronic data capture tools hosted at Meharry Medical College. REDCap (Research Electronic Data Capture) is a secure, Web-based application designed to support data capture for research studies, providing (1) an intuitive interface for validated data entry, (2) audit trails for tracking data manipulation and export procedures, (3) automated export procedures for seamless data downloads to common statistical packages, and (4) procedures for importing data from external sources. More information about the consortium and system security can be found at http://www.projectredcap.org/. REDCap is supported by NIH grant UL1 TR000445 from NCATS/NIH.
Footnotes
Funding:The author(s) disclosed receipt of the following financial support for the research, authorship, and/or publication of this article: Funding through Center for Women Health Research at Meharry Medical College from the following sources: Partial support provided by the Meharry Clinical and Translational Research Center (MeTRC) grant number 2U54MD007593 from NIMHD. Tennessee Department of State Community Enhancement grant funded the cost of providing 500 digital mammograms. Komen Greater Nashville provided grant funding for patient education and advocacy, which supported recruitment. Hologic grant supported the acquisition of Quantra software.
Declaration of conflicting interests:G.R-D. is a Pfizer consultant. All other authors declared no conflicts of interest.
Author Contributions: GRD, BW, AD, VMR, RBL, CD, ERS and HE made a substantial contribution to the concept and design, acquisition of data, and interpretation of data.
Disclosures and Ethics: Meharry Medical College IRB approved this manuscript’s study on December 12, 2007 and ending October 4, 2011 under control number 071031GRD348 and titled, “Database to evaluate the effect of ethnicity on digital mammography images (TN).”
References
- 1. Wolfe JN. Risk for breast cancer development determined by mammographic parenchymal pattern. Cancer. 1976;37:2486–2492. [DOI] [PubMed] [Google Scholar]
- 2. Boyd N, Lockwood G, Martin L, et al. Mammographic densities and breast cancer risk. Breast Dis. 1998;10:113–126. [DOI] [PubMed] [Google Scholar]
- 3. Boyd NF, Martin LJ, Bronskill M, Yaffe MJ, Duric N, Minkin S. Breast tissue composition and susceptibility to breast cancer. JNCI. 2010;102:1224–1237. [DOI] [PMC free article] [PubMed] [Google Scholar]
- 4. McCormack VA. Breast density and parenchymal patterns as markers of breast cancer risk: a meta-analysis. Cancer Epidemiol Biomark Prev. 2006;15:1159–1169. [DOI] [PubMed] [Google Scholar]
- 5. Santen RJ, Boyd NF, Chlebowski RT, et al. Critical assessment of new risk factors for breast cancer: considerations for development of an improved risk prediction model. Endoc Relat Cancer. 2007;14:169–187. [DOI] [PubMed] [Google Scholar]
- 6. Kolb TM, Lichy J, Newhouse JH. Comparison of the performance of screening mammography, physical examination, and breast US and evaluation of factors that influence them: an analysis of 27,825 patient evaluations. Radiology. 2002;225:165–175. [DOI] [PubMed] [Google Scholar]
- 7. Carney PA, Miglioretti DL, Yankaskas BC, et al. Individual and combined effects of age, breast density, and hormone replacement therapy use on the accuracy of screening mammography. Ann Inter Med. 2003;138:168–175. [DOI] [PubMed] [Google Scholar]
- 8. Vachon CM, Gils CHV, Sellers TA, et al. Mammographic density, breast cancer risk and risk prediction. Breast Cancer Res. 2007;9:217. [DOI] [PMC free article] [PubMed] [Google Scholar]
- 9. Ciatto S, Houssami N, Apruzzese A, et al. Categorizing breast mammographic density: intra- and interobserver reproducibility of BI-RADS density categories. Breast. 2005;14:269–275. [DOI] [PubMed] [Google Scholar]
- 10. Kerlikowske K, Grady D, Barclay J, et al. Variability and accuracy in mammographic interpretation using the American College of Radiology breast imaging reporting and data system. JNCI. 1998;90:1801–1809. [DOI] [PubMed] [Google Scholar]
- 11. Pisano ED, Gatsonis C, Hendrick E, et al. Diagnostic performance of digital versus film mammography for breast-cancer screening. NEngl J Med. 2005;353:1773–1783. [DOI] [PubMed] [Google Scholar]
- 12. Committee on Gynecologic Practice. ACOG Committee Opinion No. 593: management of women with dense breasts diagnosed by mammography. Obstet Gynecol. 2014;123:910–911. [DOI] [PubMed] [Google Scholar]
- 13. Ray KM, Price ER, Joe BN. Breast density legislation: mandatory disclosure to patients, alternative screening, billing, reimbursement. Am J Roentgenol. 2015;204:257–260. [DOI] [PubMed] [Google Scholar]
- 14. Committee Opinion No. 625: management of women with dense breast diagnosed by mammography. Obstet Gynecol. 2015;125:750–751. [DOI] [PubMed] [Google Scholar]
- 15. Melnikow J, Fenton JJ, Whitlock EP, et al. Supplemental screening for breast cancer in women with dense breasts: a systematic review for the US preventive services task force. Ann Intern Med. 2016;164:268–278. [DOI] [PMC free article] [PubMed] [Google Scholar]
- 16. Pahwa S, Hari S, Thulkar S, Angraal S. Evaluation of breast parenchymal density with QUANTRA software. Indian J Radiol Imaging. 2015;25:391–396. [DOI] [PMC free article] [PubMed] [Google Scholar]
- 17. Ekpo EU, McEntee MF, Rickard M, et al. Quantra™ should be considered a tool for two-grade scale mammographic breast density classification. Br J Radiol. 2016;89:20151057. [DOI] [PMC free article] [PubMed] [Google Scholar]
- 18. van der Waal D, den Heeten GJ, Pijnappel RM, et al. Comparing visually assessed BI-RADS breast density and automated volumetric breast density software: a cross-sectional study in a breast cancer screening setting. PLoS ONE. 2015;10:e0136667. [DOI] [PMC free article] [PubMed] [Google Scholar]
- 19. Østerås BH, Martinsen AC, Brandal SH, et al. Classification of fatty and dense breast parenchyma: comparison of automatic volumetric density measurement and radiologists’ classification and their inter-observer variation. Acta Radiol. 2016;57:1178–1185. [DOI] [PubMed] [Google Scholar]
- 20. Ciatto S, Bernardi D, Calabrese M, et al. A first evaluation of breast radiological density assessment by QUANTRA software as compared to visual classification. Breast. 2012;21:503–506. [DOI] [PubMed] [Google Scholar]
- 21. Rafferty E, Smith A, Niklason L. Comparison of three methods of estimating breast density: BI-RADS density scores using full field digital mammography, BI-RADS density scores using breast tomosynthesis, and volumetric breast density. Paper presented at: Radiological Society of North America 2009 Scientific Assembly and Annual Meeting; November 29-December 4, 2009; Chicago IL http://archive.rsna.org/2009/8016645.html. Accessed June 6, 2014. [Google Scholar]
- 22. Harris PA, Taylor R, Thielke R, Payne J, Gonzalez N, Conde JG. Research electronic data capture (REDCap)—a metadata-driven methodology and workflow process for providing translational research informatics support. J Biomed Informatics. 2009;42:377–381. [DOI] [PMC free article] [PubMed] [Google Scholar]
- 23. Regini E, Mariscotti G, Durando M, et al. Radiological assessment of breast density by visual classification (BI-RADS) compared to automated volumetric digital software (Quantra): implications for clinical practice. Radiol Med. 2014;119:741–749. [DOI] [PubMed] [Google Scholar]