Abstract
Imaging corneal biomechanical changes or abnormalities is important for better clinical diagnosis and treatment of corneal diseases. We propose a novel ultrasound-based method, called the ocular pulse elastography (OPE), to image corneal deformation during the naturally-occurring ocular pulse. Experiments on animal and human donor eyes, as well as synthetic radiofrequency (RF) data, were used to evaluate the efficacy of the OPE method. Using very high frequency ultrasound (center frequency = 55 MHz), correlation-based speckle tracking yielded an accuracy of less than 10% error for axial tissue displacements of 0.5 µm or above. Satisfactory speckle tracking was achieved for out-of-plane displacements up to 32 µm. Using synthetic RF data with or without a pre-defined uniform strain, the OPE method detected strains down to 0.0001 axially and 0.00025 laterally with an error less than 10%. Experiments in human donor eyes showed excellent repeatability with an intraclass correlation of 0.98. The measurement outcome from OPE was also shown to be highly correlated with that of standard inflation. These results suggest the feasibility of OPE as a potential clinical tool for evaluating corneal biomechanics in vivo.
Index Terms: Eye, biomechanical modeling, ultrasound, validation
I. Introduction
The cornea is the transparent tissue at the front of the eye through which light is refracted and subsequently focused on the retina. The cornea’s shape, among other factors, is crucial for visual acuity [1]. The biomechanical properties of the cornea are important for maintaining its shape, as the cornea is primarily composed of a load-bearing extracellular matrix (i.e., collagen) and constantly subjected to mechanical forces such as a fluctuating intraocular pressure (IOP). In the disease process of keratoconus, the cornea gradually loses its spherical shape and becomes conical [2], [3]. Regional mechanical instability is believed to initiate this process [4]; however, the disease etiology remains unclear because of lack of a suitable clinical device to monitor changes in corneal biomechanical behavior in vivo.
Scheimpflug imaging of corneal deformation in response to a rapid air-puff disturbance has been proposed [5], [6], along with other imaging-based techniques including optical coherence tomography (OCT) [7], [8], Brillouin microscopy [9], and high-frequency ultrasound [10]. Acoustic radiation force has also been used as an alternative to air-puff to apply a rapid and localized force on the cornea [11], [12], [13].Many of these methods require an external, non-physiological force to induce corneal deformation. More importantly, the intrinsic, time-varying IOP, which could confound the measured corneal response to external force, was not considered.
The IOP pulsates at every heartbeat as blood enters and drains from the choroid. This pulsation, called the ocular pulse, has an amplitude of approximately 3–4 mmHg in healthy eyes [14], [15]. Exploiting this intrinsic cyclic loading, we aim to develop an elastography approach, called “ocular pulse elastography (OPE),” to image the biomechanical responses of the cornea to the dynamic component of the IOP. This method has no need for external mechanical forces and thus improves the simplicity for clinical translation. Combined with in vivo measurement of the IOP profile using the clinically-available dynamic contour tonometer (DCT) (PASCAL, Ziemer Group, Alton, IL, USA) [16], this approach allows analyses of corneal biomechanical responses to patient-specific IOP.
High-frequency ultrasound (≥ 50 MHz) is ideal for implementing the OPE method because (1) the cornea is thin (around 500–600 µm), superficial, and of low acoustic attenuation, which permits the use of very high frequency ultrasound with sufficient tissue penetration [17]. In fact, ultrasound biomicroscopy (UBM) has been routinely used for imaging the cornea and the anterior segment of the eye in the ophthalmic clinic; (2) the beam size of ultrasound is much larger than OCT, improving the tolerance for out-of-plane motion during in vivo tracking despite poorer spatial resolution; and (3) the temporal resolution of ultrasound is very high allowing fast whole cross-section scans. The performance of high frequency ultrasound elastography has been well studied in the past. The goal of this study is to evaluate the accuracy of high frequency ultrasound speckle tracking in measuring small displacements and strains at the levels induced by ocular pulse. We also performed initial studies in animal and human donor eyes and evaluated measurement repeatability.
II. Methods
A. Ultrasound Speckle Tracking Algorithm
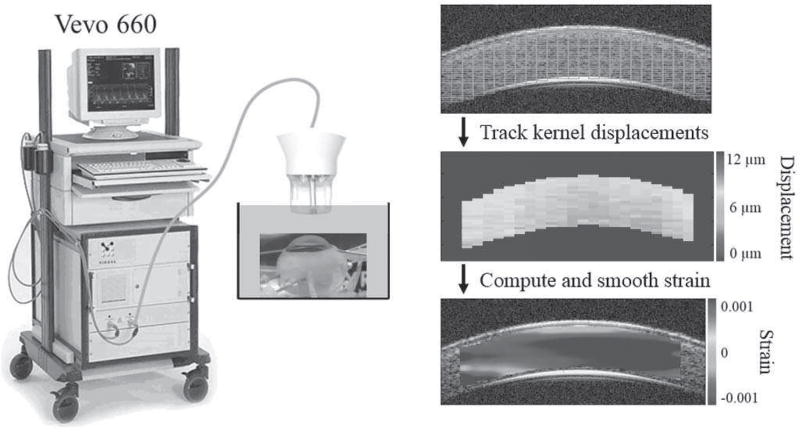
Ultrasound data was acquired by a Vevo660 imaging system (VisualSonics Inc., Toronto; Fig. 1). The probe consists of a single, focused transducer that has a center frequency of 55MHz and is mechanically scanned at 30 frames per second. The radiofrequency (RF) data was sampled at 500 MHz (DP105; Acqiris, Monroe, NY) resulting in an axial pixel spacing of 1.5 µm. Each frame includes 384 A-lines spaced at a 14-µm interval.
Fig. 1.
Illustration of the experimental setup and the ultrasound speckle tracking process. The tissue within the region of interest is divided into kernels (green rectangles) which are individually tracked to calculate displacements and strains. In the actual algorithm, the kernels are overlapped to improve the spatial resolution of the strain map.
The general setup of the ultrasound speckle tracking algorithm has been reported previously [18]. A region of interest is defined in the reference image. Within this region, overlapping (50%) kernels are defined, each of which is 51 × 41 pixels (axial × lateral), or approximately 75 µm × 570 µm in size (Fig. 1). Comparing the reference and deformed images, a cross-correlation based algorithm is used to find the new location of each kernel within a predefined search window in the neighborhood of the kernel, where the highest correlation coefficient is used as the new location of the kernel. Spline interpolation of the correlation coefficients is used to find the maximum correlation coefficient at sub-pixel resolution. A least squares strain estimation technique is used to calculate the axial and lateral strains based on displacement gradients computed from the displacement field in the neighborhood of the kernel of interest [19]. To reduce noise from unsatisfactory tracking, only kernels with a correlation coefficient greater than 0.7 were used in the strain calculation. Strain maps are generated to provide a visualization of the spatial distribution of strain interpolated at each pixel. The average strain within the entire region of interest was also calculated.
B. Displacement Measurement Accuracy and Effect of Out-of-Plane Motion
We have previously shown the accuracy of high-frequency ultrasound speckle tracking in detecting displacements as small as 10 µm [18]. The ocular pulse has a small amplitude and therefore tissue deformation is expected to be below this level. To test displacements less than 10 µm, a differential micrometer (DM12, ThorLabs, Newton, NJ, USA) with a 0.5 µm step resolution was used to test the tracking accuracy for displacements ranging from 0.5 to 12 µm. The micrometer was mounted on a translation stage (PT1A, ThorLabs, Newton, NJ, USA) to allow for linear displacement of the ultrasound probe in both the axial and lateral directions. A porcine globe was held fixed in space and manual movement of the probe via the micrometer was used to create bulk displacements of the imaged cross-section. Porcine sclera was imaged since it has an ultrasound signal strength similar to the human cornea and is much more stable than cornea in an ex vivo setting due to its low swelling propensity [20]. The designated displacement steps of the ultrasound probe were 0.5, 1, 1.5, 2, 2.5, 4, 7, 9, and 11 µm in the axial direction and 1, 2, 5, 8, 10, and 12 µm in the lateral direction. An ultrasound image was acquired at each displacement step. The average displacement of all kernels within the region of interest was compared to the induced micrometer displacement to determine measurement accuracy. The variance within region of interest was also evaluated.
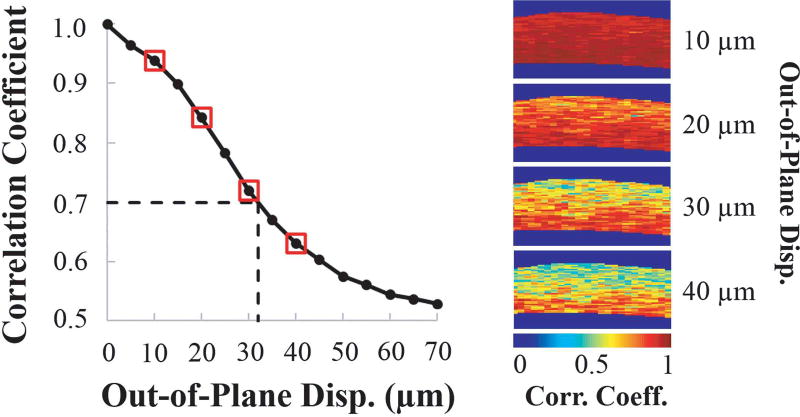
Using the same setup described above, we experimentally tested the performance against out-of-plane motion in order to understand the robustness of this technique to involuntary fixational eye motion in vivo. The differential micrometer was used to move the ultrasound transducer in the direction perpendicular to the image cross-section, resulting in out-of-plane tissue displacements. Ultrasound scans were acquired at 5 µm steps as the probe was translated from 0 to 95 µm. Using the data acquired at 0 µm as the reference plane, the speckle tracking algorithm then computed the correlation coefficients for the data acquired at each translation step. An average correlation coefficient greater than 0.7 was considered successful tracking.
C. Strain Estimation Accuracy for Simulated RF Data
The ability of our algorithm to accurately detect ocular pulse level strains was evaluated using Field II, an ultrasound simulation platform [21], [22]. Using the same platform, we have previously reported the accuracy of our speckle tracking method in measuring strain magnitudes of 0.001 and above [18]. To evaluate the algorithm’s ability to detect smaller levels of strain, we again used Field II to produce synthetic RF data from a cornea-like scattering cloud at a reference state and various deformed states with strain magnitudes of 0.001, 0.0005, 0.00025, 0.0001, and 0.00006. We analyzed compressive axial strain and tensile lateral strain since those are the expected modes of corneal deformation during the ocular pulse. The dimensions of the simulated tissue crosssection were 600 µm × 4 mm (thickness × width). Gaussian noise was added to the simulated RF data to achieve a signal-to-noise ratio (SNR) of 18 dB, which is on average the SNR observed from ultrasound images of the human corneal stroma with the Vevo 660 ultrasound system. Three runs of random noise at the same SNR were used to evaluate the consistency of the performance.
D. Comparison of OPE and Standard Inflation in Porcine Globes
Inflation testing is a well-established method for ex vivo mechanical characterization of the cornea [23]. Typically, IOP is gradually increased from a low level (e.g., 5 mmHg) to a high level (e.g., 35 mmHg) and the corneal deformation is measured at many intermediate pressure levels to characterize the cornea’s response to the full physiological range of IOP. The purpose of this experiment was to establish the feasibility of the OPE method, which measures corneal response to a small pressure change, to provide a mechanical characterization of the cornea correlative to standard inflation testing.
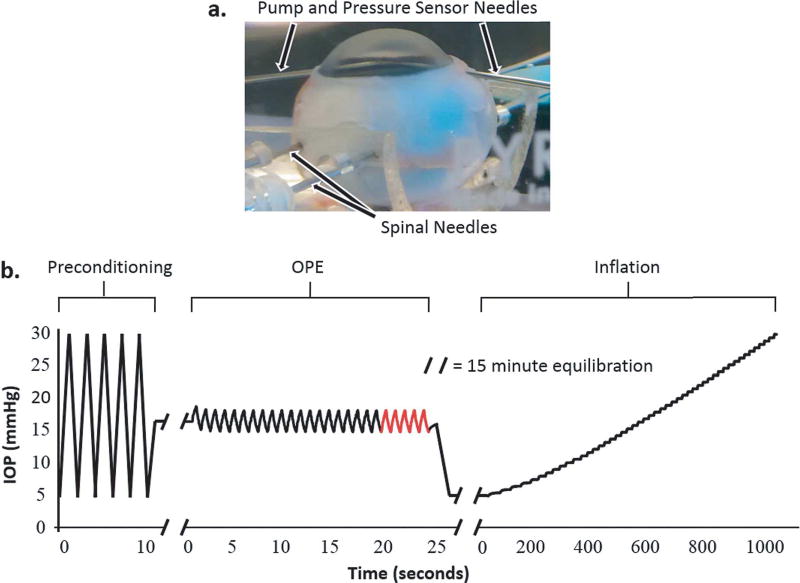
We performed both OPE and inflation testing in 17 porcine eyes. Whole globes were obtained from SiouxPreme Packing Co. (Sioux City, IA, USA), a USDA-approved abattoir under HACCP guidelines. The globes were immersed in saline and kept cold (4°C) during shipping and tested within 48 hours postmortem. The globes were secured in a custom-built holder using two 20G spinal needles inserted at the equator of the eye during testing (Fig. 2a). The globes were immersed in 0.9% saline to facilitate the transmission of ultrasound waves from the transducer to the cornea. IOP was controlled using a programmable syringe pump (PHD Ultra; Harvard Apparatus, Holliston, MA, USA) to infuse and withdraw phosphate-buffered saline (PBS) via a 20G needle inserted into the anterior chamber of the eye from the limbus. A second 20G needle was similarly inserted into the anterior chamber and connected to a pressure sensor (P75 low range blood pressure transducer; Harvard Apparatus, Holliston, MA, USA) to continuously monitor IOP. The ultrasound probe was positioned such that B-mode images were acquired at the central cornea along the nasal-temporal meridian (determined by the larger corneal diameter in this direction in the porcine eye). Control of the syringe pump and data acquisition parameters was implemented using a customized LabVIEW interface (National Instruments, Austin, TX, USA).
Fig. 2.
a. A globe secured with spinal needles inserted at the equator of the globe and with two 20G needles inserted into the anterior chamber for IOP control and monitoring, b. IOP loading protocol for OPE and inflation experiments in porcine globes. The last five ocular pulse cycles (highlighted in red) were used for OPE data analysis.
The globes were first preconditioned using five IOP cycles from 5 to 30 mmHg and then allowed to equilibrate at 16.5 mmHg for 15 minutes (Fig. 2b). For the OPE test, an ocular pulse with an amplitude of 3 mmHg was simulated by oscillating the IOP between 15 and 18 mmHg at a rate of 1 Hz. Twenty-five ocular pulse cycles were performed, and ultrasound images were acquired continuously for the last five cycles (Fig. 2b; last five cycles in red), resulting in 10–12 images per cycle. The inflation test was performed after the OPE test with an equilibration period at 5 mmHg for 15 minutes (Fig 2b). After equilibration, the globe was then inflated from 5 to 30 mmHg with 0.5 mmHg IOP steps. The IOP was held steady at each pressure level for 15 seconds before an ultrasound image was acquired. Strains were calculated from the central 2 mm region of interest in all eyes.
The measurements from the OPE and inflation tests were compared to determine whether the two techniques provided an equivalent biomechanical analysis of the cornea. We first evaluated the Pearson correlation between the maximum strains from each test in the same eye. The maximum OPE strain was determined by averaging the peak strains for the three cycles with the largest peak strains, and the maximum inflation strain was taken to be the strain at the highest IOP level (i.e., 30 mmHg).
We also derived a biomechanical parameter from each test that is independent of IOP and sought a comparison of this parameter. The inflation response of the cornea exhibits a characteristic nonlinear relationship between IOP and the resultant compressive strain, with a larger slope at lower levels of IOP and a decreasing slope as IOP increases [23]. Based on our data, the porcine cornea’s inflation response can be captured by the equation below:
| (1) |
where IOP0 is the reference pressure at which zero strain is assumed, and OPSI stands for “ocular pulse stiffness index,” which is a fitting parameter with a unit of 1/mmHg. As illustrated by Fig. 3a, the OPSI reflects the overall stiffness of the cornea: a larger OPSI value corresponds to a stiffer corneal response (i.e., smaller strain) to increases in IOP, and this value captures the entire inflation response rather than at any specific IOP level. Since the initial IOP for all inflation tests was 5 mmHg, IOP0 was set to 5 mmHg in this study. The strain data obtained experimentally from inflation testing was fit to Eq (1) to estimate the OPSI for each globe (Fig. 3b). To determine the quality of the fit, Eq (1) was converted to the following linear equation:
| (2) |
where x = 1/IOP – 1/IOP0. The R2 values from a linear regression between Strain and x were used to determine the goodness of fit, i.e., how well the analytical model (Eq 1) fits the corneal inflation behavior (Fig. 3c).
Fig. 3.
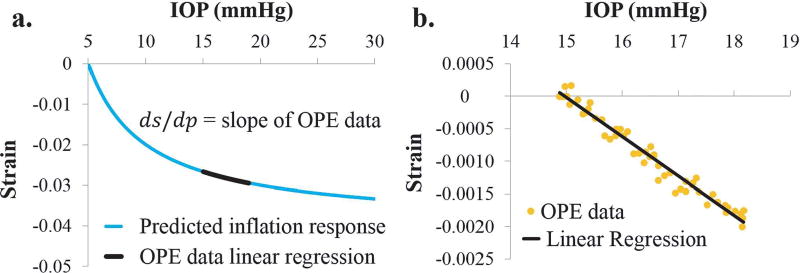
a. Inflation curves illustrating the nonlinear relationship between corneal strain and IOP. A higher ocular pulse stiffness index (OPSI) value translates to a stiffer corneal response to elevated IOP, b. Experimental inflation strain data fit to the analytical model from Eq. (1), c. Linear regression between Strain and x from Eq. (2) used to determine the quality of fit.
We also devised a method to derive an OPSI value from the OPE strain data. The strategy was to use the IOP-strain slope within the range of the ocular pulse, i.e., 15–18 mmHg in this study, to predict the entire inflation IOP-strain curve from 5 to 30 mmHg (Fig. 4a). Based on Eq (1), the slope at any point of the inflation IOP-strain curve can be found by taking the derivative with respect to IOP:
| (3) |
Plotting the strain data from all five ocular pulse cycles together versus IOP, a linear regression was used to estimate the slope at the diastolic IOP (i.e., 15 mmHg) (Fig. 4b). This slope and the diastolic IOP were input into Eq (3) to calculate an OPSI value that corresponds to the entire inflation strain curve. Using this approach, the OPSI values were calculated from the OPE data, and compared with those from the inflation tests using Pearson correlations.
Fig. 4.
a. The slope of the IOP-strain curve at the diastolic IOP can be estimated from OPE data, b. Linear regression of OPE data from multiple cycles is used to estimate the slope ds/dp for calculating the OPSI using Eq. (3).
E. Repeatability in Human Donor Globes
We performed repeated measurements in 10 human donor eyes to evaluate the repeatability of OPE. All donors were Caucasian with five males and five females and an age from 20 to 80 years old (mean ± SD: 46.7 ± 18.4 yo). All donor eyes were obtained from the Lions Eye Bank of West Central Ohio (Dayton, OH). The globes were recovered within 10 hours postmortem and stored in a moist container at 4°C until experimental testing, which was completed within 24 hours postmortem. Each donor eye went through three repeated OPE measurements, with a 5-min equilibration period between measurements. The OPE experimental protocol was the same as described earlier for porcine eyes. Specifically, each globe was preconditioned with five IOP cycles from 5 to 30 mmHg and equilibrated at 16.5 mmHg for 30 minutes. Following equilibration, twenty-five ocular pulse cycles were generated, and 10–12 images per cycle were saved for the final five cycles. This twenty-five cycle ocular pulse loading protocol was repeated twice for a total of three runs, with a 5 minute time interval between successive runs. The ultrasound speckle tracking algorithm was used to compute the strains for the five pulsatile cycles in each run. An OPSI value was calculated for each run using the three cycles with the largest peak strains. The intraclass correlation (ICC), the most commonly used statistic for assessing repeatability, was calculated [24]. Cronbach’s alpha, which is a similar measure used to evaluate the consistency of values within a group, was also computed [25], [26]. Both the ICC and Cronbach’s alpha statistics range from 0 to 1, with higher values indicating better measurement reliability. Two alternative methods were used to estimate the “measurement SNR” by calculating: 1) the ratio of the between-sample variance over the within-sample variance (the variance of the measurement error) where the “signal” is defined as the difference in OPSI between samples; and 2) the ratio between the mean OPSI and the pooled standard deviation where the “signal” is defined as the OPSI for a sample. A measurement SNR of at least 5 is needed to be able to distinguish signal from noise based on the Rose criterion [27].
III. Results
A. Displacement Accuracy and Effect of Out-of-Plane Motion
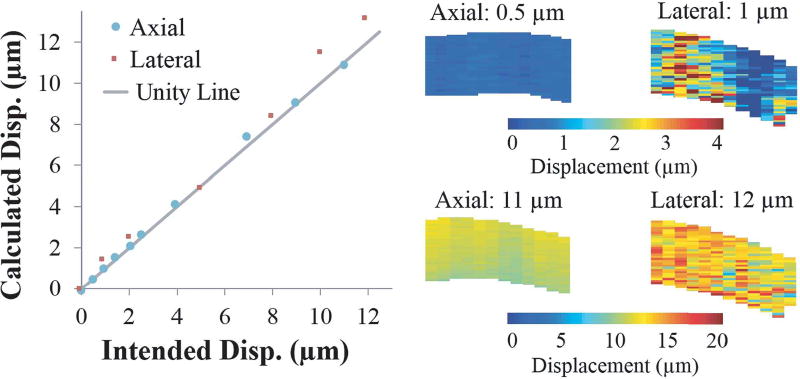
Comparing measured displacements to known tissue displacements induced manually by a micrometer, Fig. 5 shows good agreement between measured and prescribed displacements from 0.5 to 12 microns, as evidenced by the close proximity of each data point to the unity line (true values). The average percent error in axial displacement measurements was 5.0 ± 3.0% with a maximum error of 8.4% at a displacement of 2.5 µm and a minimum error of 0.4% at 11 µm. In the lateral direction, the measurements were overall less accurate and had more variability within the tissue cross-section, with an average error of 16.8 ± 16.6%. The maximum error in the lateral direction was 48.2% at 1 µm, and the minimum error was 3.2% at 5 µm. In the axial direction, a rigid-body displacement as small as 0.5 µm was detectable (at 7.4% error). Displacements plots (Fig. 5) showed a uniform appearance in the axial direction, while the lateral direction had substantial variability at low displacements.
Fig. 5.
Calculated displacements from speckle tracking agreed well with prescribed displacements from the differential micrometer movement. The spatial distribution of displacement was largely uniform in the axial direction while the lateral displacements exhibited a noisier distribution, especially at small displacements.
Fig. 6 shows the relationship between out-of-plane tissue displacement and the average cross-correlation coefficient between the image planes. As expected, as the out-of-plane movement increased, the correlation coefficient decreased, due to a weaker match between the speckle patterns. For displacements up to approximately 32 µm (about 50% of the ultrasound beam width) between consecutive images, the out-of-plane motion was well tolerated, as indicated by a cross-correlation coefficient that remained above 0.7. The decorrelation caused by out-of-plane motion was evident in the correlation coefficient maps, with a larger area of the cross-section showing lower correlation at larger out-of-plane displacements (Fig. 6).
Fig. 6.
The average speckle tracking cross-correlation coefficient decreases as out-of-plane displacement increases. At around 32 µm (indicated by dashed lines), the correlation coefficient starts to drop below 0.7. Maps of the correlation coefficients are shown for the displacement values indicated by red boxes. Lower correlation coefficients are observed for larger out-of-plane displacements.
B. Strain Estimation Accuracy for Simulated RF Data
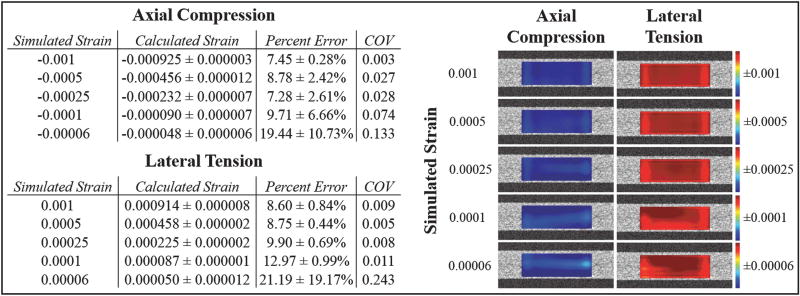
The speckle tracking algorithm’s accuracy in measuring small strains was evaluated using simulated ultrasound data created in the Field II platform. Images of the simulated RF data with and without added noise are shown in Fig. 7. Table 1 presents a comparison between the computed strains and the true strain values that were defined in the simulation program.
Fig. 7.
Ultrasound images created from simulated RF data with no added noise and with 18 dB added noise to simulate the SNR typically found in images of the cornea using the Vevo 660 ultrasound system.
TABLE I.
Comparison of calculated strain (mean ± standard deviation) from speckle tracking to known simulated strain values. The percent error and the COV represent the variability in strain calculations over the three runs (COV = standard deviation / mean for the three runs with different random noise at the same SNR). More spatially heterogeneity was seen in the strain maps at the two smallest strain magnitudes for the calculated axial compression and lateral tension. The color bar of each map was adjusted to its own range.
Both axial and lateral strains from 0.001 down to 0.00025 were accurately computed, with a percent error below 10%. For a strain magnitude of 0.0001, the error in axial compression remained just below 10%, but the error in lateral tension was slightly higher (~13%). The smallest strain, 0.00006, showed larger errors of around 20% for both categories of strain. Each strain level was repeated twice with a different set of random noise at the same SNR. The coefficient of variance (COV) across the three runs was lower than 0.10 for all strains of 0.0001 and above. At the smallest strain level (i.e. 0.00006), the COV was higher due to an increased susceptibility to noise.
The spatial variance in strain across the simulated tissue can be visualized by examining the strain maps for each strain level (Table 1). At true strains of 0.00025 or larger, the distribution of strain within the simulated tissue cross-section was predominantly uniform for both axial compression and lateral tension. The strain maps for smaller levels of strain exhibited a slightly noisier appearance (i.e. greater presence of lighter blue regions for axial compression and lighter red regions for lateral tension). The axial compressive strain of 0.00006 and lateral tensile strains of 0.0001 and 0.00006 had the highest percent error and showed the greatest amount of noise in the spatial strain map (Table 1).
C. Comparison of OPE to Standard Inflation Testing
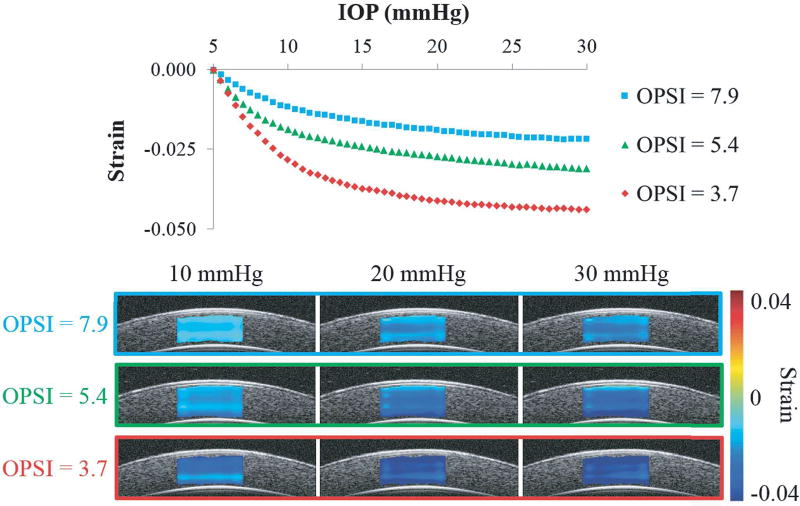
Strains in the through-thickness direction (from anterior to posterior cornea) were calculated from the axial and lateral strains. A nonlinear IOP-strain relationship was shown for through-thickness compression of the porcine cornea as the IOP was elevated from 5 to 30 mmHg (Fig. 8). The analytical model (Eq. 1) fit the experimental data well, with an average R2 of 0.98 ± 0.02 for all seventeen eyes. The OPSI values from inflation testing ranged from 3.7 to 7.9 with an average of 5.6 ± 1.4. Strain curves for the eyes with the minimum, maximum, and approximately average OPSI values are plotted in Fig. 9, along with strain maps corresponding to the 10, 20, and 30 mmHg levels of IOP. A smaller OPSI value corresponds to a more compliant response, with larger compressive strains (i.e., darker blue in the strain maps, Fig. 8).
Fig. 8.
IOP-strain curves and strain maps at 10, 20, and 30 mmHg for three porcine globes showing that a lower OPSI value corresponds to a more compliant corneal response to inflation. Darker blue color in the strain maps represents larger strain. Each eye showed increasing strain with increasing IOP, and at the same IOP, the eye with a smaller OPSI showed larger strain overall although some through-thickness heterogeneity existed within each eye.
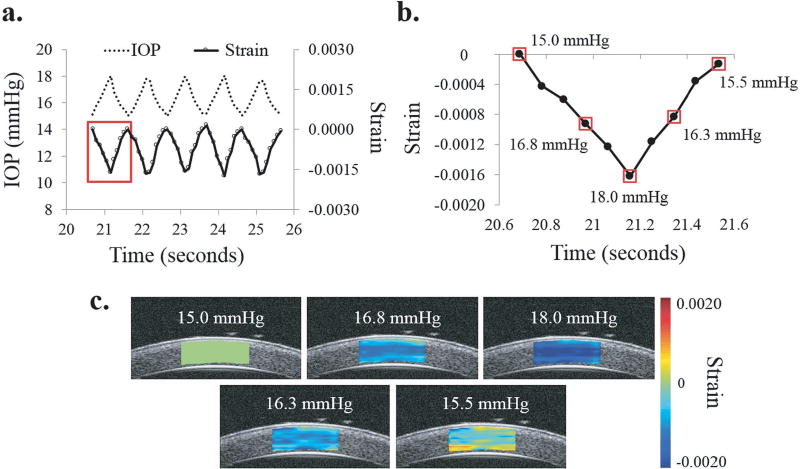
Fig. 9.
a. IOP cycles from simulated ocular pulse and resultant strain showing strong in-sync relationship, b. Strain during first OPE cycle highlighted by red box in (a), c. Strain maps for the IOP levels indicated by small red boxes in (b) showing through-thickness compression of cornea during one OPE cycle.
At 30 mmHg, the through-thickness strains ranged from −0.022 to −0.044, and the average was −0.031 ± 0.007 for all eyes.
In OPE testing, the pulsatile IOP and the calculated average through-thickness strains were strongly synchronized for each eye (Fig. 9a). During the first half of the cycle, the through-thickness strain became increasingly negative as the IOP increased, indicating compression of the cornea in that direction (Fig. 9b). The maximum compression consistently occurred at the peak IOP. As the IOP returned to 15 mmHg, the through-thickness strain decreased in magnitude as the cornea was decompressed and returned toward its original thickness. Representative strain maps for one OPE cycle are also shown in Fig. 9c. Compression of the cornea was typically seen throughout the entire tracking area, with some spatial heterogeneity in strain magnitude. The average peak through-thickness strain measured for each cornea varied from −0.0008 to −0.0019, averaging to −0.0013 ± 0.0003 for all eyes.
The OPSI values had an average value of 10.8 ± 2.4, with minimum and maximum values of 7.4 and 16.1 respectively. The peak strains were significantly correlated between OPE and inflation tests (R = 0.671, p = 0.003; Fig. 10a). The OPSI values, more representative of the overall nonlinear behavior of the cornea, were also significantly correlated between the OPE and inflation tests (R = 0.590, p = 0.013; Fig. 10b).
Fig. 10.
a. The maximum through-thickness strains measured during the OPE and inflation tests were significantly correlated (p = 0.003, n = 17), b. The OPSI values calculated for the OPE and inflation tests were also significantly correlated (p = 0.013, n = 17).
D. Repeatability in Human Donor Globes
The OPSI for the 10 eyes based on the average of three repeated measures was 14.85 ± 6.12, ranging from 8.9 to 27.6, and pooled standard deviation for the repeated measures was 0.993. The mean coefficient of variance (COV) for the ten eyes was 0.055± 0.03, ranging from 0.009 to 0.095. The ICC and Cronbach’s alpha reliability statistics were 0.98 and 0.99 respectively, suggesting the OPSI measure was highly consistent from repeated measurement. The two measurement SNR values, evaluated in two different ways (the ratio of the variance between samples and the variance within samples, and the ratio of the mean OPSI and the pooled standard deviation), were 38 and 15 respectively, which were both well above the necessary minimum value of 5 established by the Rose criterion [27].
IV. DISCUSSION
In this study, we have established the feasibility of a novel OPE method for evaluating corneal biomechanics using high-frequency ultrasound speckle tracking. The accuracy of this approach in measuring small deformations was confirmed using experimental displacement tests and simulated strain data. In porcine eyes, the biomechanical characterization by the OPE technique was comparable to the standard inflation test. Excellent repeatability was shown in human donor eye measurements.
We found good agreement between the measured displacements and the prescribed displacements using a micrometer stage (Fig. 5), showing the efficacy of sub-pixel tracking in both the axial and lateral directions. The displacement sensitivity was higher in the axial direction reaching submicron levels, due to the higher axial spatial resolution and sampling density. It is noted that experimental factors could have contributed to the error in displacement comparisons since the micrometer was controlled manually and has a finite accuracy of its own. The lower displacement sensitivity in the lateral direction can be further improved if we use kernels with a much larger lateral width than axial height, which can still achieve adequate spatial resolution of strain mapping in the lateral direction, given the geometry of the cornea (i.e., a much larger lateral width than thickness).
Field II simulations showed accurate and repeatable detection of axial compressive strains as small as 0.0001, which is approximately 10 times smaller than the peak strains measured using OPE in ex vivo human donor eyes. Lateral tensile strains were accurately measured at magnitudes of 0.00025 and higher. Measurement of smaller simulated strains had lower accuracy and higher variability but was consistently distinguishable when averaged over the entire tissue crosssection. Noise reduction techniques such as image averaging increases the SNR and thus could potentially further improve the accuracy of strain measurements.
Whole eye inflation testing is a well-accepted ex vivo mechanical testing method because it preserves the eye’s in vivo like configuration and boundary conditions [23], [28], [29]. However, the IOP loading protocol of inflation testing is difficult to translate to in vivo. The OPE test, non-invasive and with no need for external pressure loading, is essentially an inflation test using a much smaller range of IOP naturally existing in the eye. Our results showed that OPE provided an equivalent biomechanical analysis as the full range inflation testing (Fig. 10) yielding correlative peak strains and OPSI. Interestingly, the OPSI measured from the OPE method was always higher than the inflation OPSI for the same eye. This may be explained in part by the viscoelastic nature of the cornea, which causes the mechanical response of the tissue to depend on the rate of the load. The IOP rate of change is roughly 180 times faster in the OPE test, so the cornea has a higher “apparent” stiffness and consequently a higher OPSI. The OPSI from inflation tests could also have been affected by the cornea’s mechanical behavior outside of the 15–18 mmHg range within which the OPE tests were performed. Our preliminary data (not shown) indicated that differences in heart rate, however, will not result in significant change in OPE response due to the small range of the loading rate corresponding to the range of human heart rate. We will evaluate systematically in future studies the relationship between OPSI and the ocular pulse frequency (i.e., heart rate), ocular pulse amplitude, and baseline IOP.
Measurement of human donor globes showed excellent repeatability for the OPE method as indicated by the ICC and Cronbach’s alpha being nearly equal to one and the small COV for each cornea. The measurement SNR was well above the minimum value needed to distinguish signal from noise. This repeatability data, combined with the validation against inflation testing, supports the efficacy of the OPE technique in providing a meaningful and consistent biomechanical analysis of the cornea.
Involuntary eye motion may present a challenge for continuous speckle tracking of a specific corneal plane between consecutive scanning frames. Our results showed that speckle tracking remained successful for up to 32 µm of out-of-plane movement. Three types of involuntary eye movements take place during attempted fixation: tremor, drift, and microsaccades [30]. Tremor is of high frequency but very small amplitudes (5–30 sec-arc). Drift has an average amplitude of 5-min arc per second, which translates into about 15–20 µm corneal movement per second, dominantly along the lateral or axial meridian [30], [31]. Microsaccades, occurring a few times per second, have a similar average amplitude as drift but are very rapid lasting only 10–25 ms [30], [31]. With high frame rate sampling, image frames occurring during microsaccades can be removed prior to analysis, while keeping the overall eye motion within 30 µm to ensure successful tracking.
There are a number of limitations in this study. First, the strains in the in-plane direction tracked poorly during OPE experiments and were not reported. The displacement sensitivity and robustness were poorer in the direction perpendicular to the ultrasound beam due to the innate asymmetry of spatial resolution in ultrasound imaging. The current scanning frame rate also negatively impacts the performance in the in-plane direction. Due to the single-transducer set up of the current imaging system, tissue deformation could have occurred during the mechanical scanning from the first A-line to the last within the same cross-section, contributing to additional noise in the lateral direction. Utilizing an array design with a higher frame rate could potentially alleviate this issue and thus improve the in-plane strain measurements and minimize noise. Nonetheless, the cornea’s lamellar structure also presents a challenge in detecting in-plane speckle motion due to paucity of structural variations in this direction (likely more so than sclera), which may limit the achievable sensitivity in measuring in-plane strains. Secondly, the present study did not analyze the spatial heterogeneity of the corneal strains. As more data and larger scan areas become available, it will be interesting to identify through-thickness and regional variances in corneal strains. Finally, the analytical model for corneal inflation response (i.e., Eq (1)) may be further improved to better capture corneal response to IOP changes and derive IOP-independent corneal biomechanical parameters.
In summary, we have developed a non-invasive OPE technique to measure the through-thickness mechanical responses of the cornea. Our approach takes advantage of the naturally occurring ocular pulse and utilizes ultrasound speckle tracking to measure corneal strains during cyclic IOP changes. The technique allows for strain calculations at a high spatial resolution through the entire thickness and along any meridian of the cornea, with no external force needed to induce tissue deformation. These unique qualities and the demonstrated feasibility may help translate this technique to a clinical tool for in vivo imaging of corneal biomechanics that improves disease diagnosis [32], [33] and therapeutic planning [34], [35].
Acknowledgments
This work was supported in part by the National Institutes of Health under grants RO1EY020929 and RO1EY025358.
Contributor Information
Elias Pavlatos, Department of Biomedical Engineering, Ohio State University, Columbus, OH 43210 USA.
Hong Chen, Department of Biomedical Engineering, Ohio State University, Columbus, OH 43210 USA. He is now with Vasomedical, Inc, Westbury, NY, 11590 USA.
Keyton Clayson, Department of Biomedical Engineering and the Biophysics Program, Ohio State University, Columbus, OH 43210 USA.
Xueliang Pan, Center for Biostatistics, Department of Biomedical Informatics, Ohio State University, Columbus, OH 43210 USA.
Jun Liu, Department of Biomedical Engineering, the Biophysics Program, and the Department of Ophthalmology and Visual Science, Ohio State University, Columbus, OH 43210 USA.
References
- 1.Qazi Y, Wong G, Monson B, Stringham J, Ambati BK. Corneal transparency: genesis, maintenance and dysfunction. Brain Research Bulletin. 2010 Feb;81(2–3):198–210. doi: 10.1016/j.brainresbull.2009.05.019. [DOI] [PMC free article] [PubMed] [Google Scholar]
- 2.Rabinowitz YS. Keratoconus. Survey of Ophthalmology. 1998 Jan-Feb;42(4):297–319. doi: 10.1016/s0039-6257(97)00119-7. [DOI] [PubMed] [Google Scholar]
- 3.Krachmer JH, Feder RS, Belin MW. Keratoconus and related noninflammatory corneal thinning disorders. Survey of Ophthalmology. 1984 Jan-Feb;28(4):293–322. doi: 10.1016/0039-6257(84)90094-8. [DOI] [PubMed] [Google Scholar]
- 4.Meek KM, Tuft SJ, Huang Y, Gill PS, Hayes S, Newton RH, Bron AJ. Changes in collagen orientation and distribution in keratoconus corneas. Investigative Ophthalmology and Visual Science. 2005 Jun;46(6):1948–56. doi: 10.1167/iovs.04-1253. [DOI] [PubMed] [Google Scholar]
- 5.Ali NQ, Patel DV, McGhee CN. Biomechanical responses of healthy and keratoconic corneas measured using a noncontact scheimpflug-based tonometer. Investigative Ophthalmology and Visual Science. 2014 May;15; 55(6):3651–9. doi: 10.1167/iovs.13-13715. [DOI] [PubMed] [Google Scholar]
- 6.Hon Y, Lam AKC. Corneal deformation measurement using Scheimpflug noncontact tonometry. Optometry and Vision Science. 2013 Jan;90(1):e1–e8. doi: 10.1097/OPX.0b013e318279eb87. [DOI] [PubMed] [Google Scholar]
- 7.Ford MR, Roy AS, Rollins AM, Dupps WJ., Jr Serial biomechanical comparison of edematous, normal, and collagen crosslinked human donor corneas using optical coherence elastography. Journal of Cataract & Refractive Surgery. 2014 Jun;40(6):1041–1047. doi: 10.1016/j.jcrs.2014.03.017. [DOI] [PMC free article] [PubMed] [Google Scholar]
- 8.Singh M, Li J, Han Z, Vantipalli S, Liu C–H, Wu C, Raghunathan R, Aglyamov SR, Twa MD, Larin KV. Evaluating the effects of riboflavin/UVA and Rose-Bengal/green light cross-linking of the rabbit cornea by noncontact optical coherence elastography. Investigative Ophthalmology & Visual Science. 2016 Jul;57(9):OCT112–OCT120. doi: 10.1167/iovs.15-18888. [DOI] [PMC free article] [PubMed] [Google Scholar]
- 9.Scarcelli G, Pineda R, Yun SH. Brillouin optical microscopy for corneal biomechanics. Investigative Ophthalmology & Visual Science. 2012 Jan;53(1):185–190. doi: 10.1167/iovs.11-8281. [DOI] [PMC free article] [PubMed] [Google Scholar]
- 10.Hollman KW, Shtein RM, Tripany S, Kang K. Using an ultrasound elasticity microscope to map three-dimensional strain in a porcine cornea. Ultrasound in Medicine & Biology. 2013 Aug;39(8):1451–1459. doi: 10.1016/j.ultrasmedbio.2013.02.465. [DOI] [PMC free article] [PubMed] [Google Scholar]
- 11.Tanter M, Touboul MD, Gennisson JL, Bercoff J, Fink M. High-resolution quantitative imaging of cornea elasticity using supersonic shear imaging. IEEE Transaction on Medical Imaging. 2009 Dec;28(12):1881–93. doi: 10.1109/TMI.2009.2021471. [DOI] [PubMed] [Google Scholar]
- 12.Qu Y, Ma T, He Y, Zhu J, Dai C, Yu M, Huang S, Lu F, Shung KK, Zhou Q, Chen Z. Acoustic radiation force optical coherence elastography of corneal tissue. IEEE Journal of Selected Topics in Quantum Electronics. 2016 May-Jun;22(3):288–294. doi: 10.1109/JSTQE.2016.2524618. [DOI] [PMC free article] [PubMed] [Google Scholar]
- 13.Mikula E, Hollman K, Chai D, Jester JV, Juhasz T. Measurement of corneal elasticity with an acoustic radiation force elasticity microscope. Ultrasound in Medicine & Biology. 2014 Jul;40(7):1671–1679. doi: 10.1016/j.ultrasmedbio.2013.11.009. [DOI] [PMC free article] [PubMed] [Google Scholar]
- 14.Schwenn O, Troost R, Vogel A, Grus F, Beck S, Pfeiffer N. Ocular pulse amplitude in patients with open angle glaucoma, normal tension glaucoma, and ocular hypertension. British Journal of Ophthalmology. 2006 Sep;86(9):981–984. doi: 10.1136/bjo.86.9.981. [DOI] [PMC free article] [PubMed] [Google Scholar]
- 15.Hoffmann EM, Grus FH, Pfeiffer N. Intraocular pressure and ocular pulse amplitude using dynamic contour tonometry and contact lens tonometry. BMC Ophthalmology. 2004 Dec;4(1):1–7. doi: 10.1186/1471-2415-4-4. [DOI] [PMC free article] [PubMed] [Google Scholar]
- 16.Kaufmann C, Bachmann LM, Robert YC, Thiel MA. Ocular pulse amplitude in healthy subjects as measured by dynamic contour tonometry. Archives of Ophthalmology. 2006 Aug;124(8):1104–1108. doi: 10.1001/archopht.124.8.1104. [DOI] [PubMed] [Google Scholar]
- 17.Silverman RH. High-resolution ultrasound imaging of the eye - a review. Clinical and Experimental Ophthalmology. 2009 Jan;37(1):54–67. doi: 10.1111/j.1442-9071.2008.01892.x. [DOI] [PMC free article] [PubMed] [Google Scholar]
- 18.Tang J, Liu J. Ultrasonic measurement of scleral cross-sectional strains during elevations of intraocular pressure: method validation and initial results in posterior porcine sclera. Journal of Biomedical Engineering. 2012 Sep;134(9):091007. doi: 10.1115/1.4007365. [DOI] [PMC free article] [PubMed] [Google Scholar]
- 19.Kallel F, Ophir J. A least-squares strain estimator for elastography. Ultrasonic Imaging. 1997 Jul;19(3):195–208. doi: 10.1177/016173469701900303. [DOI] [PubMed] [Google Scholar]
- 20.Huang Y, Meek KM. Swelling studies on the cornea and sclera: the effects of pH and ionic strength. Biophysical Journal. 1999;77(3):1655–1665. doi: 10.1016/S0006-3495(99)77013-X. [DOI] [PMC free article] [PubMed] [Google Scholar]
- 21.Jensen JA. FIELD: a program for simulating ultrasound systems. Medical & Biological Engineering & Computing. 1997;34(sup. 1):351–353. [Google Scholar]
- 22.Jensen JA, Svendsen NB. Calculation of pressure fields from arbitrarily shaped, apodized, and excited ultrasound transducers. IEEE Transactions on Ultrasonics, Ferroelectrics, and Frequency Control. 1992 Mar;39(2):262–267. doi: 10.1109/58.139123. [DOI] [PubMed] [Google Scholar]
- 23.Boyce BL, Grazier JM, Jones RE, Nguyen TD. Full-field deformation of bovine cornea under constrained inflation conditions. Biomaterials. 2008 Oct;29(28):3896–3904. doi: 10.1016/j.biomaterials.2008.06.011. [DOI] [PubMed] [Google Scholar]
- 24.Shrout PE, Fleiss JL. Intraclass correlations: uses in assessing rater reliability. Psychological Bulletin. 1979 Feb;86(2):420–428. doi: 10.1037//0033-2909.86.2.420. [DOI] [PubMed] [Google Scholar]
- 25.Cronbach LJ. Coefficient alpha and the internal structure of tests. Psychometrika. 1951 Sep;16(3):297–334. [Google Scholar]
- 26.DeVellis RF. Classical test theory. Medical Care. 2006 Nov;44(11):S50–S59. doi: 10.1097/01.mlr.0000245426.10853.30. [DOI] [PubMed] [Google Scholar]
- 27.Bushberg JT. The Essential Physics of Medical Imaging. 2. Philadelphia: Lippincott Williams & Wilkins; 2006. p. 280. [Google Scholar]
- 28.Palko JR, Tang J, Cruz Perez B, Pan X, Liu J. Spatially heterogeneous corneal mechanical responses before and after riboflavin-ultraviolet-A crosslinking. Journal of Cataract & Refractive Surgery. 2014 Jun;40(6):1021–1031. doi: 10.1016/j.jcrs.2013.09.022. [DOI] [PMC free article] [PubMed] [Google Scholar]
- 29.Wong FF, Lari DR, Schultz DS, Stewart JM. Whole globe inflation testing of exogenously crosslinked sclera using genipen and methylglyoxal. Experimental Eye Research. 2012 Oct;103:17–21. doi: 10.1016/j.exer.2012.06.010. [DOI] [PMC free article] [PubMed] [Google Scholar]
- 30.Ciuffreda K, Tannen B. Eye Movement Basics for the Clinician. 1. Mosby: 1995. [Google Scholar]
- 31.Castet E, Crossland M. Quantifying eye stability during a fixation task: a review of definitions and methods. Seeing and Perceiving. 2012 Sep-Oct;25(5):449–469. doi: 10.1163/187847611X620955. [DOI] [PubMed] [Google Scholar]
- 32.Girard MJA, Dupps WJ, Jr, Baskaran M, Scarcelli G, Yun SH, Quigley HA, Sigal IA, Strouthidis NG. Translating ocular biomechanics into clinical practice: current state and future prospects. Current Eye Research. 2015 May;40(1):1–18. doi: 10.3109/02713683.2014.914543. [DOI] [PMC free article] [PubMed] [Google Scholar]
- 33.Congdon NG, Broman AT, Bandeen-Roche K, Grover D, Quigley HA. Central corneal thickness and corneal hysteresis associated with glaucoma damage. American Journal of Ophthalmology. 2006 May;141(5):868–875. doi: 10.1016/j.ajo.2005.12.007. [DOI] [PubMed] [Google Scholar]
- 34.Brown SE, Simmasalam R, Antonova N, Gadaria N, Asbell PA. Progression in keratoconus and the effect of corneal cross-linking on progression. Eye & Contact Lens. 2014 Nov;40(6):331–338. doi: 10.1097/ICL.0000000000000085. [DOI] [PubMed] [Google Scholar]
- 35.Caporossi A, Mazzotta C, Baiocchi S, Caporossi T. Long-term results of riboflavin ultraviolet A corneal collagen cross-linking for keratoconus in Italy: the Siena Eye Cross Study. American Journal of Ophthalmology. 2010 Apr;149(4):585–593. doi: 10.1016/j.ajo.2009.10.021. [DOI] [PubMed] [Google Scholar]


