Abstract
Objective
Magnetic resonance imaging (MRI) is an essential imaging modality in non-invasive splenomegaly diagnosis. However, it is challenging to achieve spleen volume measurement from 3D MRI given the diverse structural variations of human abdomens as well as the wide variety of clinical MRI acquisition schemes. Multi-atlas segmentation (MAS) approaches have been widely used and validated to handle heterogeneous anatomical scenarios. In this paper, we propose to use MAS for clinical MRI spleen segmentation for splenomegaly.
Methods
First, an automated segmentation method using the selective and iterative method for performance level estimation (SIMPLE) atlas selection is used to address the concerns of inhomogeneity for clinical splenomegaly MRI. Then, to further control outliers, semiautomated craniocaudal spleen length-based SIMPLE atlas selection (L-SIMPLE) is proposed to integrate a spatial prior in a Bayesian fashion and guide iterative atlas selection. Last, a graph cuts refinement is employed to achieve the final segmentation from the probability maps from MAS.
Results
A clinical cohort of 55 MRI volumes (28 T1 weighted and 27 T2 weighted) were used to evaluate both automated and semi-automated methods.
Conclusion
The results demonstrated that (1) both methods achieved median Dice > 0.9, (2) outliers were alleviated by the L-SIMPLE (≈1 min manual efforts per scan), which achieved 0.97 Pearson correlation of volume measurements with the manual segmentation.
Significance
This work performed spleen segmentation on MRI splenomegaly using MAS.
Index Terms: Spleen Segmentation, MRI, Multi-atlas, multi-contrast, splenomegaly
I. Introduction
Abnormal enlargement of the spleen, called splenomegaly [1], is a clinical finding in the patients with liver disease [2], cancer [3] and infection [4]. To quantify spleen enlargement, non-invasive spleen volume estimation approaches have been proposed using different imaging modalities (e.g., ultrasound [5–8], computed tomography (CT) [9–12], magnetic resonance imaging (MRI) [13, 14]). Slice-by-slice manual tracing on three-dimensional (3D) spleen volumes has been regarded as the gold standard of in vivo spleen size estimation [14]. However, the manual delineation is resource and time consuming, especially for large cohorts. To alleviate manual efforts and accelerate the spleen volume estimation, many endeavors haven been made. One direction is to replace 3D delineation with less time consuming one-dimensional (1D) manual measurements (e.g., splenic width, length, thickness) [7]. With 1D measurements, the whole spleen volume can be estimated using regression models. Another direction seeks to obtain 3D volumetric spleen segmentation automatically using medical image segmentation approaches [15]. Previous automatic spleen segmentation methods are typically able to be categorized by, but not limited to, shape/contour based models [16], intensity based models [17], graph cuts [18], learning based models [19], and atlas-based methods [20].
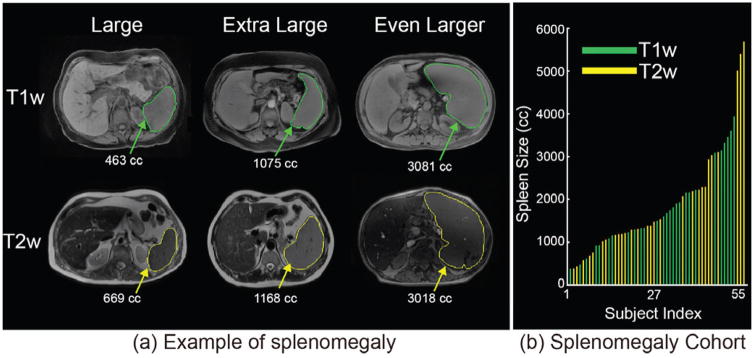
Most previous spleen segmentation methods were proposed using CT imaging since it has been used as the standard technique in abdominal imaging [7]. One of the essential benefits for medical imaging processing is that the image intensities in CT are the quantitative Hounsfield Unit (HU). The scaled intensity feature are essential in the learning based segmentation methods, such as discriminative models [21] and vantage point forests (V.P. Forests) [22]. In the past decades, MRI has been successfully used in clinical diagnosis and scientific investigations. Compared with CT, MRI eliminates the radiation risk for patients [23, 24], and the frequency of clinical abdominal MRI renders MRI based spleen volume estimation techniques an attractive target. However, the intensities in clinical acquired MRI are heterogeneous (Fig. 1a) and without absolute scales, such as HU in CT. Therefore, the intensity based segmentation methods developed for CT cannot be directly applied on MRI. Relatively few spleen segmentation methods have been proposed for MRI. Behrad et al. proposed an MRI spleen segmentation method using neural networks and recursive watershed [19]. Farraher et al. achieved accurate spleen segmentation using a semi-automated dual-space clustering segmentation technique [25]. Wu et al. integrated Gabor texture features with snake post-processing for MRI spleen segmentation [26]. Pauly et al. proposed the supervised regression method to perform the whole body segmentation on the particular MRI Dixon sequences [27]. The multi-atlas segmentation (MAS) method is regarded as state-of-the-art and has been deployed on various scenarios on both CT and MRI [28–35]. Yet, MAS has not been applied to spleen segmentation on clinically acquired splenomegaly MRI.
Fig. 1.
(a) presents heterogeneous sequences in clinical acquired abdominal MRI as well as the examples of splenomegaly spleens on MRI. (b) shows the spleen size and sequence type of all 55 MRI.
In this paper, (1) we evaluate the performance of Selective and Iterative Method for Performance Level Estimation (SIMPLE) atlas selection method [36] based on our previous efforts on CT spleen segmentation [31, 32]. (2) For the particular concerns for MRI clinical splenomegaly images, we propose the L-SIMPLE method to achieve the robust spleen segmentation using craniocaudal spleen length (L). To perform the evaluation and validation, 55 clinical acquired MRI volumes were examined, consisting of 28 T1-weighted (T1w) and 27 T2-weighted (T2w) scans (Fig. 1b), which represented the two major contrast mechanisms in clinically acquired abdominal MRI.
This paper extends a previous conference paper [33] in the following ways. First, a more complete description of the different MAS methods is provided. Second, a graph cut based refinement is created to ensure the topological correctness. Third, more thorough analyses of using craniocaudal spleen length and graph cuts are demonstrated.
II. Method
A. Multi-atlas Segmentation Framework
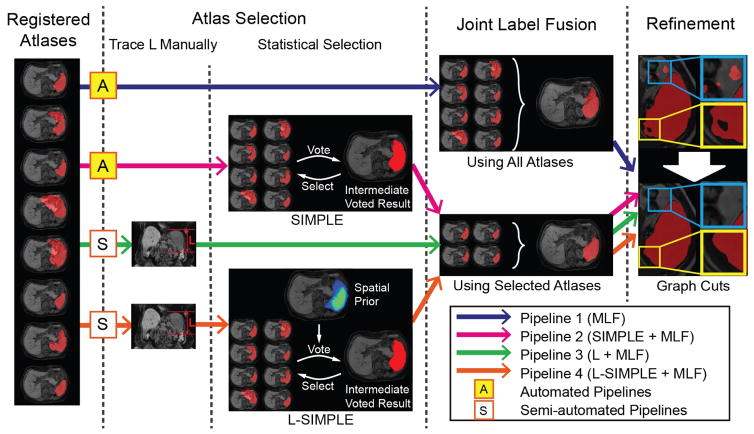
The general MAS framework consists of preprocessing, image registration, atlas selection, label propagation and multi-atlas label fusion (MLF) [30]. Briefly, first a target image was preprocessed using N4 bias field correction [37] and resampled to 1.5 mm isotropic voxel size using FMRIB’s Linear Image Registration Tool (FLIRT) [38]. Second, each atlas image was sequentially affinely registered and non-rigidly registered using DEnsE Displacement Sampling (DEEDS) [39]. Registration accuracy is essential in the atlas based segmentation methods; DEEDS was chosen based on its superior performance in a relevant comparative evaluation [40]. Third, atlases selection is performed to address substantial registration failures. Finally, MLF was conducted on the selected registered atlases using joint label fusion (JLF) [41]. In this paper, a substantial algorithmic focus is on designing and evaluating atlas selection methods (Fig. 2).
Fig. 2.
Multi-atlas labeling steps for each of the four pipelines. Pipeline 1 conducted multi-atlas label fusion (MLF) on all registered atlases without using atlas selection. Pipeline 2 employed the SIMPLE atlas selection method before performing MLF. Pipeline 3 used the craniocaudal spleen length (L) to guide the atlas selection. Pipeline 4 evaluated the proposed L-SIMPLE method, which integrated the feature L to the SIMPLE atlas selection under the Bayesian framework. For all pipelines, a post refinement procedure was included to ensure the topological correctness of the spleen segmentation (one connected component).
B. Automated Pipelines
Two automated pipelines (without manual intervention) were evaluated as shown in Figure 2.
Pipeline 1
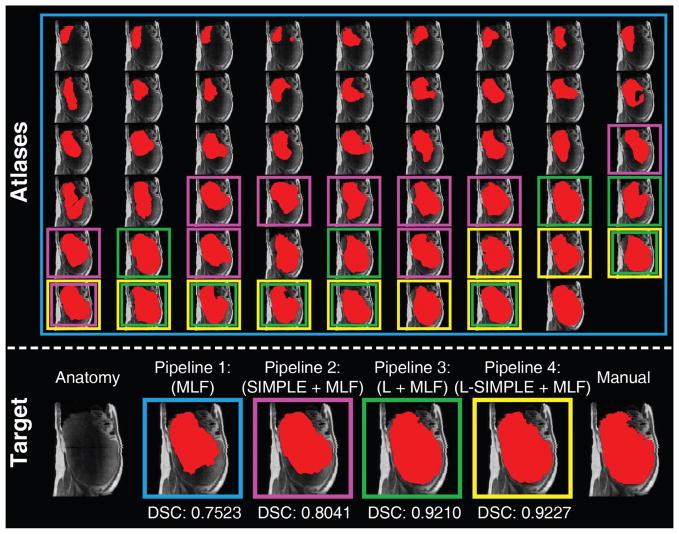
Pipeline 1 consisted of a naïve strategy that excluded the atlas selection step in the MAS framework (Fig. 2). Note that registration failures typically occur more frequently in abdominal registrations (Fig. 3) compared with brain registrations. Therefore, using all registered atlas images might lead to inaccurate label fusion results (Fig. 3; blue rectangles).
Fig. 3.
This figure presents an example of using different atlas selection strategies. The upper panel reflects the registration results of registering each atlas to the target image. The target image is shown as the left figure on the lower panel. The registered atlases are arranged based on the Dice similarity coefficient (DSC) to the target manual segmentation, whose DSC increased from top left to bottom right. Pipeline 1 (in blue rectangles) employed all registered atlases in the label fusion. Pipeline 2 (in pink rectangles) performed the atlas selection using SIMPLE method. Pipeline 3 (in green rectangles) used the craniocaudal spleen length (L) to guide the atlas selection. Pipeline 4 (in yellow rectangles) integrated L and SIMPLE to the proposed L-SIMPLE method under the Bayesian framework. In this example, Pipeline 4 chose the better atlas candidates (lower rows in upper panel) for the atlas selection, which achieved the highest DSC relative to the manual segmentation.
Pipeline 2
To alleviate registration failures, the Selective and Iterative Method for Performance Level Estimation (SIMPLE) method [36] was used in the atlas selection in Pipeline 2 (Fig. 2). The SIMPLE method was proposed as a voting based label fusion method. In this work, SIMPLE was used in the similar way as a recent work [31], where SIMPLE has been applied to the atlas selection by iteratively evaluating the Dice similarity coefficient between intermediate segmentation and atlases.
C. Semi-automated Pipeline using craniocaudal spleen length
The SIMPLE atlas selection in Pipeline 2 only considered the registered atlas labels in an iterative atlas selection manner without taking the anatomical information from the intensity atlases into account. Therefore, although the SIMPLE method was able to achieve robust performance on most of the cases, it would not be able to select better atlas candidates when multiple registration failures occur in a similar fashion (pink rectangles in Fig. 3). Therefore, we proposed to use craniocaudal spleen length (L) to guide the atlas selection (Pipeline 3 in Fig. 2).
Pipeline 3
In clinical diagnosis of splenomegaly, one dimensional (1D) measurements had been used to estimate spleen volume efficiently. Following [32], the 1D craniocaudal spleen length (L) yielded 0.8613 Pearson correlation with ground truth on spleen volume estimation using ≈ 1 minute manual efforts. Therefore, the craniocaudal spleen length was employed in Pipeline 3 to guide the atlas selection. The craniocaudal spleen length was calculated by multiplying slice thickness by the numbers of visible slices on axial direction [7]. The number of visible slices is typically derived manually by experts [7]. In this study, since we had delineated the whole spleen for all volumes, we derived the numbers of visible slices automatically by subtracting the smallest axial slice number from the largest axial slice number that contained the spleen label. Then, atlas selection was deployed by choosing the ten atlases whose craniocaudal spleen length values were the closest to the target image.
D. Semi-automated Pipeline using L-SIMPLE
In Pipelines 2 and 3, the SIMPLE and craniocaudal spleen length (L) were used to conduct atlas selection respectively. In this paper, we propose the L-SIMPLE method, which employed the craniocaudal spleen length as a prior information to guide the SIMPLE atlas selection (Pipeline 4 in Fig. 2).
Pipeline 4
In Pipeline 4, the L-SIMPLE method was proposed to perform the atlas selection by integrating the craniocaudal spleen length (L) with the SIMPLE approach under a Bayesian framework. A probabilistic map was obtained by averaging the ten registered spleen labels, whose craniocaudal spleen lengths were the closest to the target image. Then the probabilistic map served as a prior in L-SIMPLE to guide the iterative atlas selection. The inputs of L-SIMPE were (1) The craniocaudal spleen lengths of the target image, and (2) registered spleen label atlases A = {A1, A2, …, AM}, where each Aj represented the jth label atlas in total M available atlases. The outputs of L-SIMPLE were N selected atlases A′ for the following multi-atlas label fusion (N ≤ M). The complete L-SIMPLE algorithm was:
Step 1) The A were used as all atlases initially. The spleen spatial prior p(T) was obtained by averaging the r registered label atlases, whose craniocaudal spleen length had the smallest differences compared with target image’s craniocaudal spleen length. p(T = 1) was the probability prior map of the spleen (spleen label was 1), while p(T = 0) was the probability prior map of non-spleen tissues as well as background.
- Step 2) The iterative atlas selection strategy was performed. Ak represented the set of the remaining nk atlases at iteration k. For each voxel i, the likelihood function of spleen was defined by
(1) - Step 3) Using the prior in step 1 and likelihood function in step 2, the Bayesian posterior probability of spleen at voxel i was derived as
(2) - Step 4) The intermediate spleen segmentation S at voxel i was obtained by
(3) - Step 5) The one-dimensional weight vector w was defined by the Dice similarity coefficient (DSC) between each and S.
(4) - Step 6) For the k+1 iteration, the Ak+1 was a subset of Ak by comparing wj with mean (w̄) and standard deviation (σw) of w.
(5) Step 7) If the nk+1 (size of Ak+1) was less than the minimum number of atlases N (herein, 10) or nk+1 = nk, the L-SIMPLE was terminated and Ak was returned as selected atlases. Otherwise, the method performed another iteration at step 2.
E. Refinement Using Graph Cuts
Since the MAS segmentation was conducted based on voxel wise voting, spleen topology (one connected component) was not guaranteed. Therefore, a post processing step using graph cuts was used to ensure the topological correctness of MAS spleen segmentation. The graph cuts method proposed in [31] was used in this work, which maximized the Markov random field (MRF) based energy function [42, 43].
III. Data
A clinical cohort containing 55 abdominal MRI volumes was acquired from 26 patients with splenomegaly. Eight patients were scanned one time, seven patients were scanned twice, while eleven patients were scanned three times. This cohort has two major features. First, the cohort was a multi-contrast dataset, which consists of 27 T1w and 28 T2w images. This dataset was used to evaluate the performance of the proposed methods on clinically acquired multi-contrast MRI images. Second, the cohort had large variations on spleen volume size for splenomegaly, varying from 368 cubic centimeter (cc) to 5670 cc. The mean spleen volume was 1881 cc while the standard deviation was 1219 cc.
The leave-one-subject-out strategy was employed for the empirical validation, which means that the 55 MRI image volumes were used as either atlases or target images in each leave-one-subject-out test. To achieve the 3D whole spleen labels on atlases, the manual delineation was obtained on every volume by an experienced rater. The whole spleen segmentation for each scan was traced slice-by-slice (axially).
IV. Experiments and Results
The Wilcoxon signed rank test [44] was used for statistical analyses. All statements of statistical significance are made using the Wilcoxon signed rank test for p<0.05.
A. Validation the Rationale of Using L
1) Experiments
Fifty-five clinical scans were used to evaluate the rationale of using craniocaudal spleen length in atlas selection. We consecutively performed affine and rigid registration using DEEDS registration method [39] on all possible combinations between 55 image volumes. (1) Each image was used as a target image. (2) All the other available images except the target image’s longitudinal scans were employed as moving images, which were then registered to the target image. This strategy was called “leave-one-subject-out”, which means the longitudinal scans (three at maximum) for every target image were excluded from the atlases. Therefore, 52 to 54 atlases were used for each target image. (3) The affine transformation and non-rigid transformation field were applied on the spleen labels of source images. (4) The DSC values were calculated between source images and target. Finally, affine and non-rigid registrations were performed on 2890 pairs of source and target 3D volumes using 55 scans.
2) Results
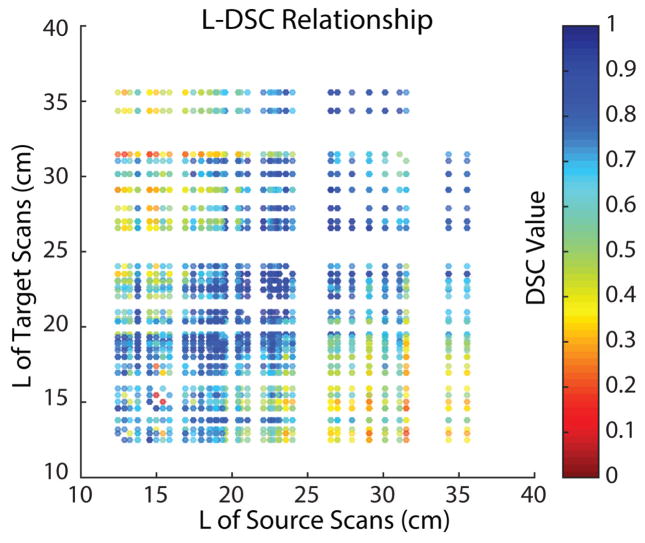
The registrations were conducted on 2890 pairs of scans. In each pair, the craniocaudal spleen length of source and target scan were used as x and y coordinates in the Fig. 4. The color of each dot indicated the DSC value between the registered source spleen label and target spleen label. From the scatter plot, the registrations between scans with similar craniocaudal spleen length typically achieved better performance on DSC.
Fig. 4.
The scatter plot demonstrated that 2890 registrations have been performed on all possible combinations between 55 clinical acquired splenomegaly images. The coordinate of each dot corresponded to the craniocaudal spleen length (L) of the source and target scan of the registration. The color of each dot indicated the DSC value between the registered spleen label and the manual segmentation.
B. Validation on Four Pipelines
1) Experiments
The same 55 scans were used in the leave-one-subject-out validations on the four different pipelines respectively. The selection of atlases and target images was the same as section IV.A “Validation the Rationale of Using L”. In these experiments, Pipeline 1 to 4 were deployed as atlas selection and label fusion as Figure 2.
We also compared our pipelines with a recent learning based method called vantage point forest (V. P. Forests) [22]. The code was downloaded from the link in that paper. All the parameters were set to the default except the “num_labels”. In this study, we set num_labels = 1 since we only had one spleen label.
2) Results
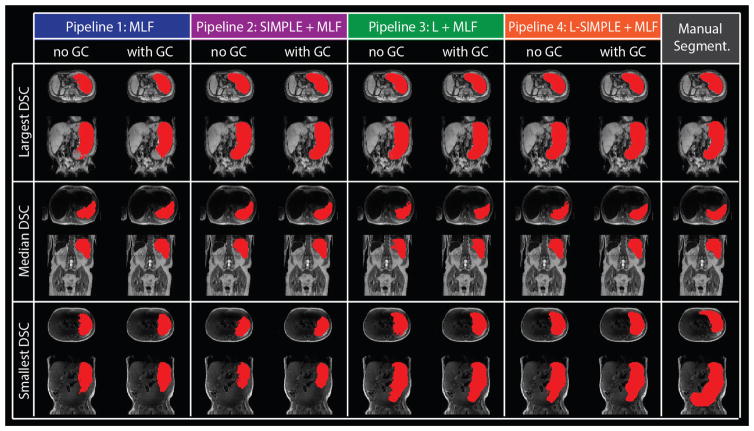
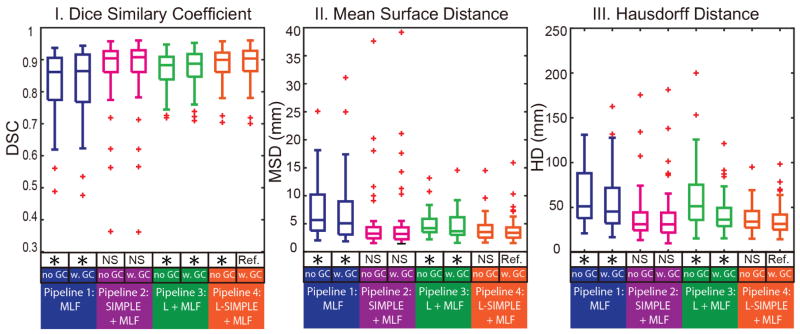
The qualitative results of four pipelines are demonstrated in Fig. 5. The qualitative results of comparing the proposed Pipeline 4 with other method had been shown in Fig. 6 and Table 1. The performance of graph cuts using DSC is significantly higher than without graph cuts refinement.
Fig. 5.
The qualitative results of four pipelines on the three subjects with largest, median and smallest DSC of Pipeline 4 with GC were shown with manual segmentation. For each pipeline, the “no GC” indicated the results without Graph Cuts while the “with GC” demonstrated the results with Graph Cuts.
Fig. 6.
The quantitative results of four pipelines on Dice similarity coefficient (DSC), mean surface distance (MSD) as well as Hausdorff distance (HD) are shown in boxplots. The “no GC” indicated the results without Graph Cuts while the “w. GC” demonstrated the results with Graph Cuts. The statistical analyses were conducted between the proposed Pipeline 4 L-SIMPLE with Graph Cuts method (marked as reference “Ref.”) with other approaches. Statistically significant, differences are marked with a “*” symbol. Non-significant differences are indicated with “N.S.”
TABLE I.
Performance of four pipelines using all 55 volumes in a leave-one-subject-out approach.
| Measurements | Automated | Semi-automated | ||||||||
|---|---|---|---|---|---|---|---|---|---|---|
| V.P. Forests [25] | Pipeline 1 | Pipeline 2 | Pipeline 3 | Pipeline 4 | ||||||
| No GC | With GC | No GC | With GC | No GC | With GC | No GC | With GC | |||
| Dice similarity (DSC) | median | 0.697 | 0.861 | 0.864 | 0.905 | 0.908 | 0.883 | 0.888 | 0.900 | 0.904 |
| mean±std | 0.70±0.12 | 0.82±0.11 | 0.83±0.11 | 0.87±0.10 | 0.88±0.10 | 0.87±0.06 | 0.87±0.06 | 0.88±0.06 | 0.89±0.06 | |
| Mean surface distance (mm) | median | 21.42 | 5.68 | 5.09 | 3.24 | 3.19 | 4.21 | 3.67 | 3.54 | 3.41 |
| mean±std | 22.69±8.29 | 7.23±4.80 | 6.93±5.74 | 4.75±5.73 | 4.83±6.04 | 4.86±2.13 | 4.52±2.41 | 3.96±2.17 | 3.97±2.45 | |
| Hausdorff distance (mm) | median | 123.64 | 51.19 | 45.44 | 31.29 | 31.25 | 51.31 | 36.45 | 34.10 | 31.65 |
| mean±std | 135.2±48.8 | 61.4±29.6 | 53.4±31.3 | 39.7±28.4 | 39.6±30.9 | 61.8±35.6 | 42.6±20.9 | 38.3±15.8 | 37.1±18.2 | |
| Number of Failures | DSC<0.8 | 45 | 19 | 15 | 6 | 5 | 8 | 8 | 7 | 6 |
| DSC<0.75 | 37 | 11 | 13 | 4 | 4 | 3 | 3 | 2 | 2 | |
| DSC<0.7 | 28 | 9 | 6 | 3 | 3 | 0 | 0 | 0 | 0 | |
The bold values indicate the best performance on the particular metric. The “No GC” indicated the results without Graph Cuts while the “With GC” demonstrated the results with Graph Cuts
C. Sensitivity Analyses on Multi-Contrast Scenarios
1) Experiments
The multi-contrast images (e.g., T1w and T2w) in clinical acquired images were heterogeneous on both absolute intensity and intensity contrast. In this experiment, we explored the robustness of the MAS methods on the multi-contrast images. Moreover, we evaluate the performance of using (1) both T1w images as atlases and targets, (2) both T2w images as atlases and targets, (3) T1w images as atlases and T2w images as targets, and (4) T2w images as atlases and T1w images as targets.
2) Results
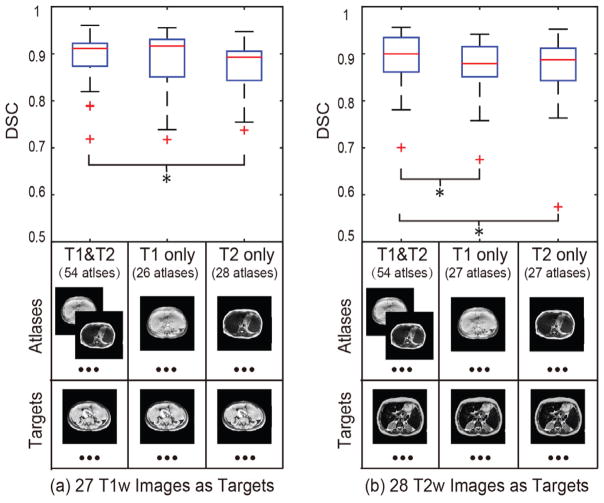
For T1w target images, using both T1w and T2w atlases achieved significantly higher DSC than using all T1w or T2w atlases. For T2w target images, using both T1w and T2w atlases achieved significantly higher DSC than using all T1w or T2w atlases. No significant differences were detected.
V. Discussion
Fully automated segmentation methods are commonly preferred over manual or semi-manual segmentation methods. Therefore, we evaluate the fully-automated Pipeline 1 and Pipeline 2. The results demonstrated that the Pipeline 2 was able to achieve 0.9 median DSC on spleen segmentation for splenomegaly. However, outliers (e.g., bad segmentations with DSC<0.7) were generated from the registration failures. Such poor cases were typically not desired in the clinical scenarios. To alleviate such failures, the 1D manual measurement L was introduced to form the Pipeline 3 and Pipeline 4. From the validations, the Pipeline 4 achieved more robust segmentations (Pearson correlation > 0.97) without sacrificing on segmentation accuracy (DSC>0.9) compared with Pipeline 2. Meanwhile, the number of worst cases (DSC<0.8, DSC<0.75 and DSC<0.7) were alleviated when introducing the L. Since manual efforts were still required in Pipeline 4, a meaningful future work would be automated craniocaudal spleen length estimation using machine learning and artificial intelligence.
In this work, four atlas selection strategies (none, automated, manual, semi-automated) have been evaluated. Other atlas selection methods could be used to further leverage the performance of the atlas based spleen segmentation. Craniocaudal length L can be used for spleen volume estimation directly using regression models (with 0.816 correlation to the true volume reported in [10]). The proposed pipelines not only achieved higher correlation scores but also provided the 3D volumetric segmentations that the regression was not able to. The computational time of registering one atlas to target image was typically <5 min in our experiments. The computational time would be further reduced when performing atlas selection (e.g., using the information from spleen length L). Another direction worth pursing using the spleen length L and its spatial information to initialize or leverage the image registration. In the future, the publicly available dataset from VISCERAL Anatomy3 challenge could be used to evaluate the proposed method or new methods on abdominal organ segmentation [45].
VI. Conclusion
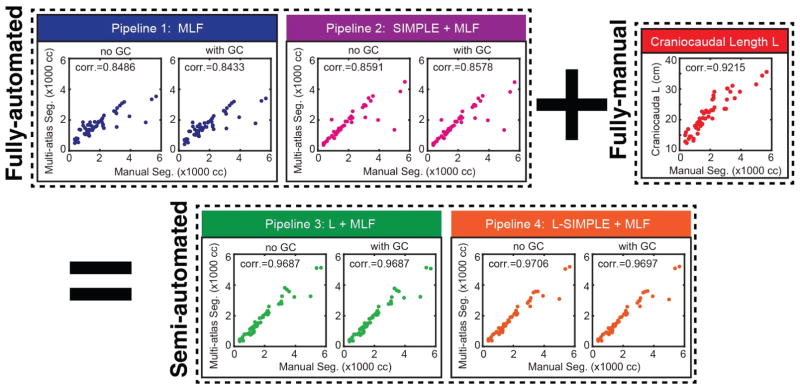
In this paper, we have proposed the L-SIMPLE method and evaluated the performance of multi-atlas segmentation on clinical acquired MRI for splenomegaly patients. The rationale of introducing the manual measurement L was illustrated in Fig. 4. Fig. 5 and Fig. 6 demonstrated that the fully automated Pipeline 2 (SIMPLE+MLF) and semi-automated Pipeline 4 (L-SIMPLE + MLF) both achieved DSC>0.9. By using the feature L, Pipeline 4 achieved 0.97 Pearson correlation with the manual segmentation (in Fig. 7 and Table 1), which was better than either fully automated pipelines or only using the spleen length L. The performance of all the four pipelines were better than the V. P. Forests method, which shown the robustness of the proposed methods on the multi-contrast MRI segmentation. By using the prior from the manually traced L, the worst cases of the spleen volume estimations were alleviated as shown in Fig. 6 and Table 1. The number of worst cases (DSC<0.8, DSC<0.75 and DSC<0.7) for the Pipeline 3 and 4 were less than Pipeline 1 and 2. Although the improvements on DSC, MSD, HD using the graph cuts refinement were not large compared with omitting refinement, the graph cut ensures the topological correctness of the final spleen segmentation (one connected component).
Fig. 7.
The correlation analyses between different pipelines with manual segmentation. The semi-automated pipelines achieved higher Pearson correlation values than fully-automated pipelines and fully-manual L measurements. The “+” and “=” indicated that the Pipeline 3 and 4 integrated the information derived from Pipeline 1 and 2 plus the craniocaudal spleen length (L). The “corr.” reflected the Pearson correlation values. The “no GC” indicated the results without Graph Cuts while the “with GC” demonstrated the results with Graph Cuts
Fig. 8 evaluated the sensitivity of the proposed method on multi-contrast scenarios. The results demonstrated that the proposed method yields consistent segmentation performance even if the contrast mechanism of atlases and targets are different (T1w and T2w). Meanwhile, using all available atlases, the performance of the segmentation was better than to pre-classify them to T1w atlases or T2w atlases.
Fig. 8.
The sensistivty analyses of the proposed L-SIMPLE method on multi-contrast images. (a) demonstrates that using both T1w and T2w images as atlases achieved better performance than only using T1w or T2w atlases on segmenting T1w images. (b) shows that using both T1w and T2w images as atlases achieved better performance than only using T1w or T2w atlases. From (a) and (b), it is evident that the performance of using the same sequence on both atlases and targets did not yield a significant difference on DSC compared with using the different sequences for atlases and targets respectively. The “*” symbol indicates significant differences.
Acknowledgments
This research was supported by NSF CAREER 1452485 (Landman), NIH grants 5R21EY024036 (Landman), R01EB017230 (Landman), 1R21NS064534 (Prince/Landman), 1R01NS070906 (Pham), 2R01EB006136 (Dawant), 1R03EB012461 (Landman) and R01NS095291 (Dawant). InCyte Corporation (Abramson/Landman). This research was conducted with the support from Intramural Research Program, National Institute on Aging, NIH. This study was also supported by NIH 5R01NS056307, 5R21NS082891 and in part using the resources of the Advanced Computing Center for Research and Education (ACCRE) at Vanderbilt University, Nashville, TN. This project was supported in part by ViSE/VICTR VR3029 and the National Center for Research Resources, Grant UL1 RR024975-01, and is now at the National Center for Advancing Translational Sciences, Grant 2 UL1 TR000445-06. The content is solely the responsibility of the authors and does not necessarily represent the official views of the NIH. We appreciate the NIH S10 Shared Instrumentation Grant 1S10OD020154-01 (Smith), Vanderbilt IDEAS grant (Holly- Bockelmann, Walker, Meliler, Palmeri, Weller), and ACCRE’s Big Data TIPs grant from Vanderbilt University.
Contributor Information
Yuankai Huo, Department of Electrical Engineering and Computer Science, Vanderbilt University, Nashville, TN 37235 USA.
Jiaqi Liu, Department of Electrical Engineering and Computer Science, Vanderbilt University, TN 37235 USA.
Zhoubing Xu, Department of Electrical Engineering and Computer Science, Vanderbilt University, TN 37235 USA.
Robert L. Harrigan, Department of Electrical Engineering and Computer Science, Vanderbilt University, TN 37235 USA
Albert Assad, Incyte Corp., Delaware 19803 USA.
Richard G. Abramson, Department of Radiology and Radiological Science, Vanderbilt University. TN 37235 USA
Bennett A. Landman, Department of Electrical Engineering and Computer Science, Vanderbilt University, TN 37235 USA
References
- 1.Eichner ER. Splenic function: normal, too much and too little. Am J Med. 1979 Feb;66:311–20. doi: 10.1016/0002-9343(79)90554-0. [DOI] [PubMed] [Google Scholar]
- 2.McCormick PA, Murphy KM. Splenomegaly, hypersplenism and coagulation abnormalities in liver disease. Baillieres Best Pract Res Clin Gastroenterol. 2000 Dec;14:1009–31. doi: 10.1053/bega.2000.0144. [DOI] [PubMed] [Google Scholar]
- 3.Klein B, Stein M, Kuten A, Steiner M, Barshalom D, Robinson E, et al. Splenomegaly and solitary spleen metastasis in solid tumors. Cancer. 1987 Jul 01;60:100–2. doi: 10.1002/1097-0142(19870701)60:1<100::aid-cncr2820600118>3.0.co;2-9. [DOI] [PubMed] [Google Scholar]
- 4.Woodruff AW. Mechanisms involved in anaemia associated with infection and splenomegaly in the tropics. Trans R Soc Trop Med Hyg. 1973;67:313–28. doi: 10.1016/0035-9203(73)90107-7. [DOI] [PubMed] [Google Scholar]
- 5.Hosey RG, Mattacola CG, Kriss V, Armsey T, Quarles JD, Jagger J. Ultrasound assessment of spleen size in collegiate athletes. Br J Sports Med. 2006 Mar;40:251–4. doi: 10.1136/bjsm.2005.022376. discussion 251–4. [DOI] [PMC free article] [PubMed] [Google Scholar]
- 6.De Odorico I, Spaulding KA, Pretorius DH, Lev-Toaff AS, Bailey TB, Nelson TR. Normal splenic volumes estimated using three-dimensional ultrasonography. Journal of ultrasound in medicine. 1999;18:231–236. doi: 10.7863/jum.1999.18.3.231. [DOI] [PubMed] [Google Scholar]
- 7.Rodrigues AJ, Rodrigues CJ, Germano MA, Rasera I, Cerri GG. Sonographic assessment of normal spleen volume. Clinical Anatomy. 1995;8:252–255. doi: 10.1002/ca.980080403. [DOI] [PubMed] [Google Scholar]
- 8.Spielmann AL, DeLong DM, Kliewer MA. Sonographic evaluation of spleen size in tall healthy athletes. American Journal of Roentgenology. 2005;184:45–49. doi: 10.2214/ajr.184.1.01840045. [DOI] [PubMed] [Google Scholar]
- 9.Prassopoulos P, Daskalogiannaki M, Raissaki M, Hatjidakis A, Gourtsoyiannis N. Determination of normal splenic volume on computed tomography in relation to age, gender and body habitus. Eur Radiol. 1997;7:246–8. doi: 10.1007/s003300050145. [DOI] [PubMed] [Google Scholar]
- 10.Bezerra AS, D’Ippolito G, Faintuch S, Szejnfeld J, Ahmed M. Determination of splenomegaly by CT: is there a place for a single measurement? AJR Am J Roentgenol. 2005 May;184:1510–3. doi: 10.2214/ajr.184.5.01841510. [DOI] [PubMed] [Google Scholar]
- 11.Linguraru MG, Sandberg JK, Jones EC, Summers RM. Assessing splenomegaly: automated volumetric analysis of the spleen. Acad Radiol. 2013 Jun;20:675–84. doi: 10.1016/j.acra.2013.01.011. [DOI] [PMC free article] [PubMed] [Google Scholar]
- 12.Bezerra AS, D’Ippolito G, Faintuch S, Szejnfeld J, Ahmed M. Determination of splenomegaly by CT: is there a place for a single measurement? American Journal of Roentgenology. 2005;184:1510–1513. doi: 10.2214/ajr.184.5.01841510. [DOI] [PubMed] [Google Scholar]
- 13.Thomsen C, Josephsen P, Karle H, Juhl E, Sorensen PG, Henriksen O. Determination of T1- and T2-relaxation times in the spleen of patients with splenomegaly. Magn Reson Imaging. 1990;8:39–42. doi: 10.1016/0730-725x(90)90210-s. [DOI] [PubMed] [Google Scholar]
- 14.Mazonakis M, Damilakis J, Maris T, Prassopoulos P, Gourtsoyiannis N. Estimation of spleen volume using MR imaging and a random marking technique. European Radiology. 2000;10:1899–1903. doi: 10.1007/s003300000551. [DOI] [PubMed] [Google Scholar]
- 15.Mihaylova A, Georgieva V. A Brief Survey of Spleen Segmentation in MRI and CT Images. International Journal. 2016;5 [Google Scholar]
- 16.Campadelli P, Casiraghi E, Pratissoli S. A segmentation framework for abdominal organs from CT scans. Artif Intell Med. 2010 Sep;50:3–11. doi: 10.1016/j.artmed.2010.04.010. [DOI] [PubMed] [Google Scholar]
- 17.Campadelli P, Pratissoli S, Casiraghi E, Lombardi G. Automatic abdominal organ segmentation from CT images. ELCVIA: electronic letters on computer vision and image analysis. 2009;8:001–14. [Google Scholar]
- 18.Chen X, Udupa JK, Bagci U, Zhuge Y, Yao J. Medical image segmentation by combining graph cuts and oriented active appearance models. IEEE Trans Image Process. 2012 Apr;21:2035–46. doi: 10.1109/TIP.2012.2186306. [DOI] [PMC free article] [PubMed] [Google Scholar]
- 19.Behrad A, Masoumi H. Automatic spleen segmentation in MRI images using a combined neural network and recursive watershed transform. Neural Network Applications in Electrical Engineering (NEUREL), 2010 10th Symposium on; 2010. pp. 63–67. [Google Scholar]
- 20.Linguraru MG, Sandberg JK, Li Z, Shah F, Summers RM. Automated segmentation and quantification of liver and spleen from CT images using normalized probabilistic atlases and enhancement estimation. Med Phys. 2010;37:771–783. doi: 10.1118/1.3284530. [DOI] [PMC free article] [PubMed] [Google Scholar]
- 21.Lay N, Birkbeck N, Zhang J, Zhou SK. Rapid multi-organ segmentation using context integration and discriminative models. International Conference on Information Processing in Medical Imaging. 2013:450–462. doi: 10.1007/978-3-642-38868-2_38. [DOI] [PubMed] [Google Scholar]
- 22.Heinrich MP, Blendowski M. Multi-organ segmentation using vantage point forests and binary context features. International Conference on Medical Image Computing and Computer-Assisted Intervention. 2016:598–606. [Google Scholar]
- 23.Lin EC. Radiation risk from medical imaging. Mayo Clinic Proceedings. 2010:1142–1146. doi: 10.4065/mcp.2010.0260. [DOI] [PMC free article] [PubMed] [Google Scholar]
- 24.Semelka RC, Armao DM, Elias J, Huda W. Imaging strategies to reduce the risk of radiation in CT studies, including selective substitution with MRI. Journal of Magnetic Resonance Imaging. 2007;25:900–909. doi: 10.1002/jmri.20895. [DOI] [PubMed] [Google Scholar]
- 25.Farraher SW, Jara H, Chang KJ, Hou A, Soto JA. Liver and Spleen Volumetry with Quantitative MR Imaging and Dual-Space Clustering Segmentation 1. Radiology. 2005;237:322–328. doi: 10.1148/radiol.2371041416. [DOI] [PubMed] [Google Scholar]
- 26.Wu J. An automated human organ segmentation technique for abdominal magnetic resonance images. McMaster University; 2010. [Google Scholar]
- 27.Pauly O, Glocker B, Criminisi A, Mateus D, Möller AM, Nekolla S, et al. Fast multiple organ detection and localization in whole-body MR Dixon sequences. International Conference on Medical Image Computing and Computer-Assisted Intervention. 2011:239–247. doi: 10.1007/978-3-642-23626-6_30. [DOI] [PubMed] [Google Scholar]
- 28.Rohlfing T, Russakoff DB, Maurer CR., Jr Performance-based classifier combination in atlas-based image segmentation using expectation-maximization parameter estimation. IEEE Trans Med Imaging. 2004 Aug;23:983–94. doi: 10.1109/TMI.2004.830803. [DOI] [PubMed] [Google Scholar]
- 29.Heckemann RA, Hajnal JV, Aljabar P, Rueckert D, Hammers A. Automatic anatomical brain MRI segmentation combining label propagation and decision fusion. Neuroimage. 2006 Oct 15;33:115–26. doi: 10.1016/j.neuroimage.2006.05.061. [DOI] [PubMed] [Google Scholar]
- 30.Iglesias JE, Sabuncu MR. Multi-atlas segmentation of biomedical images: A survey. Med Image Anal. 2015 Aug;24:205–19. doi: 10.1016/j.media.2015.06.012. [DOI] [PMC free article] [PubMed] [Google Scholar]
- 31.Xu Z, Burke RP, Lee CP, Baucom RB, Poulose BK, Abramson RG, et al. Efficient multi-atlas abdominal segmentation on clinically acquired CT with SIMPLE context learning. Med Image Anal. 2015 Aug;24:18–27. doi: 10.1016/j.media.2015.05.009. [DOI] [PMC free article] [PubMed] [Google Scholar]
- 32.Xu Z, Gertz AL, Burke RP, Bansal N, Kang H, Landman BA, et al. Improving Spleen Volume Estimation Via Computer-assisted Segmentation on Clinically Acquired CT Scans. Acad Radiol. 2016 Oct;23:1214–20. doi: 10.1016/j.acra.2016.05.015. [DOI] [PMC free article] [PubMed] [Google Scholar]
- 33.Huo Y, Liu J, Xu Z, Harrigan RL, Assad A, Abramson RG, et al. Multi-atlas segmentation enables robust multi-contrast MRI spleen segmentation for splenomegaly. SPIE Medical Imaging. 2017 doi: 10.1117/12.2254147. [DOI] [PMC free article] [PubMed] [Google Scholar]
- 34.Liu J, Huo Y, Xu Z, Assad A, Abramson RG, Landman BA. Multi-Atlas Spleen Segmentation on CT Using Adaptive Context Learning. SPIE Medical Imaging. 2017:1013309–1013309-7. doi: 10.1117/12.2254437. [DOI] [PMC free article] [PubMed] [Google Scholar]
- 35.Schreibmann E, Marcus DM, Fox T. Multiatlas segmentation of thoracic and abdominal anatomy with level set-based local search. Journal of Applied Clinical Medical Physics. 2014;15:22–38. doi: 10.1120/jacmp.v15i4.4468. [DOI] [PMC free article] [PubMed] [Google Scholar]
- 36.Langerak TR, van der Heide UA, Kotte AN, Viergever MA, van Vulpen M, Pluim JP. Label fusion in atlas-based segmentation using a selective and iterative method for performance level estimation (SIMPLE) IEEE Trans Med Imaging. 2010 Dec;29:2000–8. doi: 10.1109/TMI.2010.2057442. [DOI] [PubMed] [Google Scholar]
- 37.Tustison NJ, Avants BB, Cook PA, Zheng Y, Egan A, Yushkevich PA, et al. N4ITK: improved N3 bias correction. IEEE transactions on medical imaging. 2010;29:1310–1320. doi: 10.1109/TMI.2010.2046908. [DOI] [PMC free article] [PubMed] [Google Scholar]
- 38.Jenkinson M, Smith S. A global optimisation method for robust affine registration of brain images. Medical image analysis. 2001;5:143–156. doi: 10.1016/s1361-8415(01)00036-6. [DOI] [PubMed] [Google Scholar]
- 39.Heinrich MP, Jenkinson M, Brady M, Schnabel JA. MRF-based deformable registration and ventilation estimation of lung CT. IEEE Trans Med Imaging. 2013 Jul;32:1239–48. doi: 10.1109/TMI.2013.2246577. [DOI] [PubMed] [Google Scholar]
- 40.Xu Z, Lee CP, Heinrich MP, Modat M, Rueckert D, Ourselin S, et al. Evaluation of six registration methods for the human abdomen on clinically acquired CT. IEEE Transactions on Biomedical Engineering. 2016;63:1563–1572. doi: 10.1109/TBME.2016.2574816. [DOI] [PMC free article] [PubMed] [Google Scholar]
- 41.Wang HZ, Suh JW, Das SR, Pluta JB, Craige C, Yushkevich PA. Multi-Atlas Segmentation with Joint Label Fusion. Ieee Transactions on Pattern Analysis and Machine Intelligence. 2013 Mar;35:611–623. doi: 10.1109/TPAMI.2012.143. [DOI] [PMC free article] [PubMed] [Google Scholar]
- 42.Song Z, Tustison N, Avants B, Gee JC. Integrated graph cuts for brain MRI segmentation. International Conference on Medical Image Computing and Computer-Assisted Intervention. 2006:831–838. doi: 10.1007/11866763_102. [DOI] [PubMed] [Google Scholar]
- 43.Wolz R, Chu C, Misawa K, Fujiwara M, Mori K, Rueckert D. Automated abdominal multi-organ segmentation with subject-specific atlas generation. IEEE transactions on medical imaging. 2013;32:1723–1730. doi: 10.1109/TMI.2013.2265805. [DOI] [PubMed] [Google Scholar]
- 44.Wilcoxon F. Individual comparisons by ranking methods. Biometrics bulletin. 1945:80–83. [Google Scholar]
- 45.Jimenez-del-Toro O, Müller H, Krenn M, Gruenberg K, Taha AA, Winterstein M, et al. Cloud-based evaluation of anatomical structure segmentation and landmark detection algorithms: VISCERAL anatomy benchmarks. IEEE transactions on medical imaging. 2016;35:2459–2475. doi: 10.1109/TMI.2016.2578680. [DOI] [PubMed] [Google Scholar]


