

Summary
To better understand the gene regulatory mechanisms that program developmental processes, we carried out simultaneous, genome-wide measurements of mRNA, translation and protein through meiotic differentiation in budding yeast. Surprisingly, we observed that the levels of several hundred mRNAs are anti-correlated with their corresponding protein products. We show that rather than arising from canonical forms of gene regulatory control, the regulation of at least 380 such cases—or over 8% of all measured genes—involves temporally regulated switching between production of a canonical, translatable transcript and a 5′ extended isoform that is not efficiently translated into protein. By this pervasive mechanism for the modulation of protein levels through a natural developmental program, a single transcription factor can coordinately activate and repress protein synthesis for distinct sets of genes. The distinction is not based on whether an mRNA is induced or not, but rather based on the type of transcript produced.
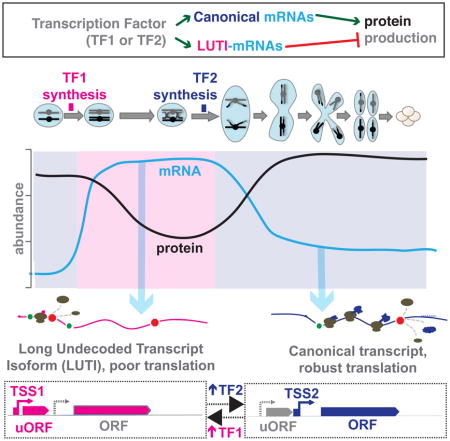
Graphical Abstract
Introduction
The decoding of cellular information from DNA to protein determines cellular identity. Despite a strong body of knowledge of how transcription and translation are controlled, our understanding of how their regulation drives fluid changes in cell structure and function over a developmental program is rudimentary. Global studies have revealed complex patterns of gene expression regulation in contexts of cellular change, especially during developmental programs, with evidence accumulating for much more regulation than we can currently explain mechanistically [for examples, see (Blank et al., 2017; Brar et al., 2012; Duncan and Mata, 2014; Jovanovic et al., 2015; Kronja et al., 2014; Peshkin et al., 2015; Tanenbaum et al., 2015); for review, see (Liu et al., 2016)]. Developmental programs include embryogenesis, as well as cellular differentiation, and are characterized by rapid and unidirectional transitions in cellular state. These changes are largely thought to be driven by transcriptional activators, which turn up mRNA production to promote protein synthesis, and repressors, which turn down mRNA production and allow gene expression to be reduced. By such classical models, gene expression patterns are thus set by transcriptional regulation, which may be subsequently enhanced or dampened by post-transcriptional regulation.
Meiosis is one such conserved process of differentiation, during which chromosome and organelle segregation are coupled to gamete formation (sporulation in budding yeast). The large body of knowledge about meiotic progression in the budding yeast Saccharomyces cerevisiae and the tractability of isolating large numbers of synchronous cells makes this system a valuable model for studying gene regulation in cellular differentiation. Our previous study (Brar et al., 2012), revealed extensive formerly unrecognized transcriptional and translational regulation in meiotic cells, but the mechanisms responsible for this regulation and their impact on protein levels were unclear. We therefore performed a deeper global study here, aimed at determining the impact of transcriptional and translational regulation on the meiotic proteome. To our knowledge, the resultant dataset represents the most complete gene expression atlas to date for any developmental process.
We were surprised to identify a large subset of genes for which mRNA abundance patterns were not predictive of protein patterns despite high quality and reproducibility of measurements. Our deep dataset, enabling robust detection of both qualitative and quantitative features of gene expression, allowed us to discover that many such cases show hallmarks of a non-canonical mode of regulation that involves transcriptional toggling between two transcript isoforms encoding identical Open Reading Frames (ORFs), one of which is a traditional mRNA that is zwell translated and results in protein accumulation, and one of which is an often abundant transcript that cannot be efficiently translated and results in decreased protein production (Chen et al., 2017; Chia et al., 2017). We find that this is a global regulatory mechanism that sets protein levels for over 8% of all measured genes over meiotic differentiation. By this mechanism, a transcription factor can drive synthesis of mRNA for a set of genes in concert, but this transcriptional activation results in gene expression activation in some cases and repression in others, depending on the type of transcript produced. Here, transcriptional and translational control are integrated in their regulation rather than sequential, such that the translatability of an mRNA isoform—rather than its quantity per se—is fundamental in setting protein levels through a natural and conserved developmental process.
Results
A deep dataset reveals meiotic gene regulation in detail from transcript to protein
To assay the degree of change in gene regulation as cells progress through meiosis, we measured matched samples for protein levels by quantitative mass spectrometry (isobaric TMT10-plex labeling), mRNA levels by mRNA-seq, and translation by ribosome profiling—on 8 stages of natural meiotic differentiation, one vegetative exponential control in rich media, and one sporulation media-matched non-meiotic (MATa/a) control (Fig. 1A, S1A, S1E). Our protein measurements were highly reproducible, both when comparing to biological replicates and to label free quantification (LFQ;Fig. S1C–D). Our mRNA-seq and ribosome profiling measurements also showed high reproducibility (Fig. S1C).
Figure 1.

Gene expression through meiotic differentiation, from mRNA to protein. A) Matched extract was used for mRNA-seq, ribosome profiling, and quantitative mass spectrometry. B) Hierarchical clustering of protein measurements for all quantified annotated genes (n=4464, columns) over all timepoints (rows) is shown. Total signal is normalized per column to allow comparison of patterns. See also Fig. S1, Tables S1, S3, and S6.
We were able to quantify 4,464 annotated proteins at every timepoint, with an average coverage of 10.7 peptides/protein. We efficiently captured proteins from most cellular compartments, with few exceptions (Table S1). Our mass spectrometry measurements reveal extensive protein level regulation when looking broadly at all quantified genes and suggest that most proteins are subject to active degradation in the meiotic program, with decreases in abundance observed for nearly every protein despite no dilution due to cell division, as would be seen during mitosis (Fig. 1B, S1E). Patterns of protein abundance for well studied genes confirmed known regulation, and was remarkably consistent with known function [Fig. S1F–K;(Zaslaver et al., 2004)].
Discordant mRNA and protein levels are common and reflect biological regulation
The degree to which regulation at the level of transcription, translation, and protein degradation drive protein levels has been a topic of extensive debate (Liu et al., 2016). We first investigated this issue in our dataset by examining the degree to which mRNA patterns predicted protein patterns. A plot of the correlation coefficients between mRNA and protein abundances revealed a positive trend, as expected based on canonical models of gene regulation (Fig. 2A). We were surprised to see, however, a subset of genes that showed poor, even negative, mRNA:protein correlations (Fig. 2A, S2A). Given the large number of genes in this group, we tested whether they were lowly expressed, and thus the poor correlation could be driven by measurement noise. However, analyses of mean mRNA and protein abundance measurements indicated no association with mRNA to protein agreement over time (Fig. 2B). We determined that a parallel set of mRNA-seq without polyA-selection was similar to our original mRNA-seq data, and thus that the discrepancy between mRNA and protein patterns was not an artifact of polyA tail length changes, which have been observed during developmental processes [Fig. S2B–D; for example (Subtelny et al., 2014)]. We concluded that the poor mRNA to protein correlation that we detect for a large subset of genes is likely to result from biological regulation.
Figure 2.

Many genes show a poor correlation between mRNA and protein in meiotic differentiation that is associated with alternate transcripts. A) A histogram of the Pearson correlation coefficients between mRNA and protein abundance measurements over all timepoints for all genes is shown. Note the general skew towards a positive correlation and a subdistribution (centered at ~−0.2) with a poor correlation. B) Mean levels of mRNA (blue) and protein (black) for each of the genes shown in the distribution above is shown. C) Protein abundances for Ndt80 targets. Columns are genes, rows are timepoints. Shaded boxes below denote discrete clusters representing patterns of protein abundance. The gray box denotes the set of genes that show protein abundance patterns that fit well with mRNA abundances in D. D) mRNA abundances matched to the columns in C. For E), F) and G), pink bars denote the timing of production of long transcripts and blue bars denote the timing of production of short, canonical transcripts. mRNA, ribosome footprints, protein, and TE are plotted for E) canonical Ndt80 target CDC5, F) ORC1 and G) NDC80. See also Fig. S2.
A subset of transcriptionally co-regulated genes show discordant protein patterns
We hypothesized that we might be able to identify regulatory mechanisms that lead to specific cases of poor mRNA:protein concordance by focusing on a set of genes that are transcriptionally co-activated, and thus allow straightforward parallel comparison of their post-transcriptional regulation. Towards this end, we clustered mRNA-seq data and observed, as previously seen, that a large group of transcripts are sharply induced in concert in late meiotic prophase (Fig. S2E). Several features suggest that these genes are targets of the transcription factor Ndt80 (Xu et al., 1995): they include known Ndt80 target genes [Fig. 2C, S2E;(Chu and Herskowitz, 1998)]; they show a high expression correlation and a pattern matching expectations for Ndt80 induction (Fig. S2E); and the consensus Ndt80 binding motif, termed the Middle Sporulation Element (MSE) was strongly enriched in their promoters [Fig. S2F–G;(Chu and Herskowitz, 1998)].
We isolated data for the 241 of these genes quantified for protein and determined that, as expected, the most well characterized Ndt80 targets (including NDT80 itself and the Polo kinase-encoding CDC5) showed a sharp uptick in protein abundance that mirrors patterns of mRNA abundance. Protein levels decrease with timing similar to mRNA decreases, suggesting a short protein half-life (Fig. 2C, 2D). Such high mRNA:protein agreement is seen for 150 (62%) of targets (Fig. 2C, 2D). However, the protein levels for the other Ndt80 targets were not well predicted by the patterns of mRNA levels, showing, for example, markedly delayed protein accumulation (orange box in Fig. 2C, 2D) or protein patterns that appeared to have little relationship to transcript patterns (blue and green boxes in Fig. 2C, 2D). These cases showed the type of paradoxical poor mRNA:protein correlation seen to be prevalent in the full dataset (Fig. 2A, 2C, S2A, S2H–I) and we proceeded to investigate their regulation in detail.
Decoupled mRNA and protein levels are associated with transcript isoform toggling
We noted that two members of this aberrant class of Ndt80 targets were ORC1 and NDC80 (Fig. 2C, S2I), encoding conserved proteins that are required for DNA replication and kinetochore function, respectively. Both genes have recently been shown to be associated with regulation involving mutually exclusive alternate transcript isoforms, so we investigated the possibility that this could account for their poor mRNA:protein agreement. A recent study showed that the 5′ extended ORC1 transcript isoform results from Ndt80 activation of an upstream Transcription Start Site (TSS), producing a transcript that is poorly translated for the ORC1 ORF and instead shows translation of several upstream Open Reading Frames [uORFs;(Brar et al., 2012; Xie et al., 2016)]. Comparison to a canonical Ndt80 target, CDC5 (Fig. 2E, 2F), revealed that both show a robust boost in overall mRNA levels consistent with Ndt80 activation. However, in the case of ORC1, the translation of the ORF on the longer, Ndt80-induced transcript is poor and thus results in a peak in translation that precedes the peak in total mRNA accumulation [Fig. 2F; (Brar et al., 2012)]. In contrast, induction of higher transcript levels of CDC5 by Ndt80 results in increased translation and protein accumulation, as expected from canonical models of gene regulation (Fig. 2E).
Regulation of the kinetochore component NDC80 shows the opposite pattern as ORC1 with respect to transcript induction by Ndt80. In the case of NDC80, a long, translationally silent transcript is present early in meiosis (Chen et al., 2017; Chia et al., 2017). The poor translation of Ndc80 protein from the long transcript led to it being named a “LUTI” or “Long Undecoded Transcript Isoform”, and depends on the translation of AUG-initiated uORFs. The short, translatable version of the NDC80 transcript is induced later by Ndt80 [Fig. 2G;(Chen et al., 2017; Chia et al., 2017)]. In our dataset, NDC80 showed a translation peak after the mRNA peak, and the gap was more prominent than we see for known cases of translational repression (Fig. 2G, Fig. S2J). We interpret this delay to reflect the switch between the abundant LUTI transcript and activation of the previously silenced proximal TSS to produce the shorter transcript. This results in mRNA and protein bursts that are out of phase by hours, which is not typical of canonically regulated genes in meiosis. Strikingly, this regulation results not just in a poor correlation between mRNA and protein abundance, but an anti-correlation (Fig. 2G, S2I).
Differences in translatability of alternate transcripts produced at ORC1 and NDC80 are apparently more important in setting protein output than the differences in overall mRNA abundance for these genes, explaining the discordance between mRNA and protein level patterns in these cases (Fig. 2C, 2F, 2G). Thus, the single transcription factor, Ndt80, is capable of activating transcription of three types of target genes (Fig. 3A, 3C). First, CDC5 is a canonical target that promotes meiotic progression and its translation and protein levels increase in a manner that mirrors its sole, canonical transcript (Fig. 2E, 3A, 3C). Second, ORC1, whose protein levels decrease late in meiosis when DNA replication is complete, is silenced by Ndt80 induction through production of a longer transcript that does not efficiently produce protein and is associated with shutdown of the short, translatable transcript [Fig. 2F, 3A, 3C,(Xie et al., 2016)]. Translation efficiency [TE; (ribosome footprint)/(mRNA)] of the early, short ORC1 transcript is high, but TE of the abundant longer, Ndt80-induced ORC1 transcript is low (Fig. 2F, 3A). Thus, counter-intuitively, due to the scale of these differences in TE for the ORC1 isoforms, Ndt80-mediated transcriptional activation is actually associated with repressed translation for this target (Fig. 3A, 3C). Third, NDC80, whose protein levels are kept low early to enable normal assembly of the meiosis I kinetochore, is required for chromosome segregation. Ndt80 drives the necessary late burst in protein levels and overcomes the silencing mediated by previous longer transcript production [Fig. 2G, 3A, 3C, (Chen et al., 2017; Chia et al., 2017)]. Taken together, Ndt80 is capable of functioning via transcriptional activation as both an inducer (CDC5 and NDC80) and as a repressor (ORC1) of protein expression, depending on the position of its binding site relative to the positions of other features of the genomic locus, including uORF sequences and the ORF start codon (Fig. 3A, 3C).
Figure 3.

Annotation of genes regulated by transcript toggling. A) Top, transcript models are shown, along with the position of the MSE. Middle, mRNA reads (top) are plotted for CDC5, NDC80, and ORC1. Bottom, TE is plotted for these same genes. The timing of Ndt80 action corresponds with an increase in translation and TE for NDC80 and a decrease for ORC1. B) Enrichment is shown for predicted alternate meiotic transcripts [as defined in (Brar et al., 2012)] for genes in the Ndt80 regulon with poor mRNA:protein correlation (<0.4, Pearson) in Fig. S2A. ** p<0.01 by Fisher’s exact test. C) A model for Ndt80 action on three different types of targets for which it induces an abundant transcript. Canonical targets like CDC5 promote meiotic progression past pachytene. At these loci, a translatable transcript is made, resulting in rapid protein accumulation. Ndt80 induction induces an abundant and longer, untranslatable transcript isoform (LUTI) of ORC1, which results in decreased in protein levels. NDC80 is a target that was previously kept silent by a LUTI transcript. Ndt80 induces a short transcript that overcomes the silent transcript in the population and is well translated and allows protein accumulation, albeit at a slower rate than most canonical Ndt80 targets. D) The description of our pipeline for LUTI-type identification is shown and expanded in Fig. S3A. E) Enrichment of the newly annotated LUTIs is seen in the ORC1, CDC5 and NDC80 clusters in Fig. 2C. Fisher’s exact test was used for statistical significance. See also Fig. S3, Table S2.
Transcript toggling is common and reshapes the meiotic proteome
We noted that ORC1 and NDC80 were both members of a group of genes that we previously predicted to have alternate transcripts in meiosis, based solely on mRNA-seq data (Brar et al., 2012). Analysis of the 55 genes in the Ndt80 regulon that showed the poorest mRNA to protein correlation (<0.4, Fig. S2H) revealed that this set was greatly enriched for genes with observed alternate transcripts (Fig. 3B), suggesting that a similar transcript toggling mechanism might be responsible for other cases of discordant mRNA to protein patterns in meiosis. We sought to define simple rules that could be used to detect such regulation in an unbiased manner. We noted that an essential feature of LUTI regulation for the one mechanistically well-defined case, NDC80, was a translated AUG-initiated uORF, specifically on the long transcript isoform, which prevented ribosomes from translating the ORF (Chen et al., 2017). Down-regulated ORF translation as a result of conditional uORF translation is a known mechanism, although in most reported examples, temporal control results from a change in trans-factor activity [for example, (Hinnebusch, 1993; Palam et al., 2011)], while in this case, uORF translation is enabled and ORF translation disabled simply by timed production of a longer transcript that encodes uORF sequences. We previously annotated genes with meiotically translated AUG-initiated uORFs, of which 911 were quantified at the protein level here [Fig. 3D; (Brar et al., 2012)]. We filtered the set of genes that show poorly correlated mRNA and protein profiles (Fig. 2A) for meiotic translation of an AUG uORF and examined each of these loci for evidence of a clear alternate 5′ extended transcript at some point in meiosis and uORF translation that was negatively associated with ORF translation (Fig. 3D). In 380 cases, or 68% of genes for which these analyses were possible, we indeed observed evidence for regulation based on transcript toggling of differentially translated isoforms (Fig. 3D, Fig. 3A, Table S2). This value changed little if discovery was conducted using mRNA-seq without single round polyA-selection (Table S2). We noted that the clusters representing aberrant protein accumulation patterns in the Ndt80 regulon were strongly enriched for these newly annotated cases of LUTI-like regulation (Fig. 2C, 3E).
We expected, based on the parameters of their discovery, that the 380 proposed LUTI cases would be regulated by an NDC80/ORC1-like mechanism involving modulation of the level of two transcripts, one of which has a long 5′ leader containing at least one translated AUG uORF that results in little protein production from the canonical ORF, and one of which has a shorter 5′ leader and a highly translated ORF that results in robust protein production. If this is true, we should be able to detect two transcripts that both encode the ORF, and the longer transcript should be associated with poor translation efficiency. mRNA-seq data is useful for predicting the possibility of alternate transcripts, but cannot distinguish between alternate transcripts and discontinuous, overlapping transcripts. We therefore performed Northern blotting for ORFs that we predicted to show LUTI-based regulation (Figure 4, S4). RNA pol II mediator complex gene MED7, for example, shows two mRNA isoforms that are differentially translated for the MED7 ORF (Fig. 4A, 4B, S4A). Timepoints with the highest total MED7 mRNA levels also showed the lowest TE and preceded a drop in protein levels, consistent with poor translation of the long transcript that was present at these times (Fig. 4A, 4B).
Figure 4.

Validation of LUTI cases predicted by systematic annotation. A) mRNA-seq and ribosome profiling data is shown over all timepoints for the MED7 locus. Existence of a long transcript that has translated uORFs and is poorly translated for MED7 is clear at mid-meiotic timepoints. B) Comparison of levels and timing between Northern blots for the MED7 ORF and the mRNA-seq, translation, protein, and TE measured from matched samples shows evidence for a poorly translated long transcript isoform. C) Z-score clustering to compare mRNA (top) and protein (bottom) patterns for each of the 380 predicted LUTIs discovered by the approach outlined in Fig. 3D. Below, the positions of the genes that are investigated in more detail in Fig. 4 and S4 are shown. D–J) Comparison of levels and timing between Northern blots and the TE in matched samples shows evidence for a poorly translated long transcript for D) RRD2, E) POP7, F) POP4, H) RAD16, J) SHS1. Pink bars represent the presence of the long transcript and blue bars represent the presence of the short transcript. G) W. blotting of a GFP reporter driven by pPOP4, I) pRAD16, and K) pSHS1. In a paired reporter deleted for the canonical SHS1 promoter, long transcript remains high and is increased relative to wild-type but protein production is low. Blots were run, transferred, and blotted together. L) Quantification of the Western blots in K. See also Fig. S4.
Examination of the full set of newly proposed LUTI cases showed a variety of patterns of mRNA and protein accumulation over our timecourse, suggesting that several transcription factors were likely to be involved in inducing long and short isoforms at these loci (Fig. 4C, top). In all cases, as expected, protein patterns did not resemble mRNA patterns (Fig. 4C). We confirmed the presence of two transcript isoforms and the expected relationship with respect to TE for ten additional cases (Fig. 4C–J, S4A–O). Regulation of RRD2, the gene encoding a peptidyl-prolyl-isomerase, is evident if one compares the 3 hour and 4.5 hour timepoints. Both show a similar amount of RRD2ORF, but the TE is higher at 4.5 hours, when we observe less RRD2LUTI isoform (Fig. 4D, S4B). Northern blots for POP7, an RNase complex component-encoding gene, and POP4, a gene encoding a fellow member of some of these complexes, showed meiotic appearance of long and poorly translated transcript isoforms at 4.5 and 1.5 hours, respectively, corresponding to low points in translation (Fig. 4E, 4F, S4C, S4F). DNA damage factor RAD16 primarily has a long transcript isoform through most of meiosis, corresponding with poor translation compared to vegetative cells (Fig. 4H, S4D). A long isoform of septin-encoding SHS1 was seen to peak at 6 hours into meiosis and was correlated in timing with a drop in SHS1 TE (Fig. 4J, S4E).
We noted that gene expression measurements for the 380 newly annotated LUTI cases were highly reproducible and that the unexpected relationship between protein levels was not due to our mass spectrometry approach (Fig. S3B–D). To further confirm our measurements, we assayed protein production from reporter constructs for three of our LUTI-regulated candidates—RAD16, SHS1, and POP4—with Green Fluorescent Protein (GFP) driven by their extended promoter regions. We observed patterns that matched expectations based on LUTI-based regulation (Fig. 4F–K, S4P–V). We further showed that Shs1 protein production was markedly decreased by inactivation of the predicted canonical (proximal) promoter in the reporter. Cells carrying this construct still show accumulation of the long transcript isoform, actually earlier and to a higher level than the wild-type construct, but show low levels of canonical transcript. Even at timepoints with high levels of the long transcript isoform present, protein levels are ~30-fold lower than in cells carrying the wild-type construct (Fig. 4K–L). We conclude that, consistent with our model, the long isoform of SHS1 is not capable of efficiently supporting protein production. Based on our stringent annotation and validation approaches (Fig. 3D, Fig. 4, S4), we conclude that the newly annotated cases of discordant mRNA to protein levels are indeed likely to reflect LUTI regulation of the type outlined in Figure 7 below.
New LUTI cases show strong apparent shifts in translation efficiency
LUTI-based regulation would be expected to result in shifts in TE over time, because TE is determined by normalizing ribosome footprint counts to mRNA counts over the ORF. Indeed, the newly proposed set of 380 LUTI-regulated genes show strong relative TE shifts compared to other genes (Fig. 6A). It is important to note that without information about the presence of alternate transcript isoforms present at these loci, we would assume that these measurements represented temporally regulated changes in translatability for a single transcript type. In the case of genes in the NDC80 or ORC1 clusters in the Ndt80 regulon, there is evidence that transcript toggling (and TE shifts) are driven by Ndt80, either towards a translatable isoform in the NDC80 cluster or towards a translationally silent isoform in the ORC1 cluster. This conclusion is based on positioning of Ndt80 binding sites and strong similarity of our measurement patterns for these genes to others in the same clusters (Fig. 2C, 2D, 3A, 3E).
A transcription factor can coordinately activate and repress protein synthesis of distinct targets
If, as our data suggest, a single transcription factor can mediate both up- and down-regulation of expression from distinct sets of target genes, this would represent a powerful mechanism for coordination in differentiation and potentially cellular transitions, more generally. To determine whether this is the case, we performed Northern blotting on samples from a timecourse for which we had measured mRNA abundances and translation rates following timed induction of the transcription factor Ndt80 in a strain carrying GAL4 under β-estradiol (βE) control and pGAL-NDT80 (Brar et al., 2012; Carlile and Amon, 2008). We noted that three of the transcripts for which we validated transcript toggling by Northern blotting, POP7, ORC3 (another origin recognition complex component) and MED7, showed similar timing for long isoform appearance following βE addition and were present in the aberrant protein level clusters among likely Ndt80 targets (Fig. 2C, 2D, 4C, 4B, S4F, S4H, S4O). A fourth gene that we had validated by Northern blotting to have two transcript isoforms, CYC8, encoding a general transcriptional co-repressor, was also present in the aberrant Ndt80 target clusters but showed the opposite pattern as the other three, with a shorter transcript isoform induced in mid-meiosis (Fig. 2C, S4N). We hypothesized that POP7, ORC3, and MED7 LUTI isoforms were driven by Ndt80, and that the CYC8 canonical isoform was driven by Ndt80, overcoming the pre-existing LUTI isoform. All four genes showed strong predicted Ndt80 binding sites adjacent to the TSS predicted to be activated (Fig. S5I–L). Within one hour of βE addition, Northern blotting revealed a sharp increase in abundance of the canonical transcript for validated Ndt80 target, CDC5, a short transcript isoform of CYC8, and long isoforms of POP7, ORC3, and MED7 (Fig. 5A). The timing of this induction was similar in all cases and corresponded with a decrease in TE of POP7, ORC3, and MED7, and an increase for canonical Ndt80 target CDC5 and CYC8 (Fig. 5B, S5E), supporting our hypothesis.
Figure 5.

A single transcription factor coordinately induces long, translationally silent transcript isoforms and canonical transcripts, with opposing effects on protein production. A) Northern blotting reveals rapid increases in mRNA following Ndt80 induction for canonical Ndt80 target, CDC5, the canonical transcript isoform of CYC8, and long isoforms of POP7, MED7, and ORC3. Pink and blue bars at the right of blots indicate canonical and LUTI isoforms. B) These increases in mRNA result in decreased TE for POP7, MED7, and ORC3, while CDC5 and the short CYC8 isoform are better translated after Ndt80 induction. C) Northern blotting reveals Ndt80-dependence to induction of CDC5, the canonical transcript isoform of CYC8, and long isoforms of POP7, MED7, and ORC3, *denotes a background band. D) mRNA abundance increases for traditional and long, poorly translated Ndt80 transcript isoform targets occur with similar timing and are dependent on Ndt80. Dotted lines show mRNA abundances without addition of β-estradiol. Solid lines show measurements with. E) Outline of experiments in A) and C) and expected effects on gene expression. F–I) mRNA (blue) and protein (black) are shown with (solid line) and without (dotted line) Ndt80 induction for F) canonical targets CDC5 and G) HRR25, H) the canonical transcript isoform of CYC8, and I) POP7LUTI. Note that induction of canonical mRNAs results in an Ndt80-dependent increase in mRNA and protein, while induction of the POP7 LUTI results in an Ndt80-dependent increase in mRNA but decrease in protein, relative to no Ndt80 induction. See also Fig. S5, Table S4, Table S5.
To prove that Ndt80 expression and not simply time in sporulation medium was responsible for these patterns, we arrested meiotic cells in late prophase and collected subsequent timepoints with or without induction of Ndt80 (Fig. 5E, S5A–D). We observed patterns of transcript appearance that matched those seen in our previous timecourse (Fig. 5A, 5C). Moreover, matched timepoints at 0.5 and 1.75 hours after βE addition showed distinct patterns from those without Ndt80 induction. In the cases of POP7, MED7, and ORC3, low levels of canonical transcript remained at 1.75 hours without Ndt80 induction and long transcript was not observed (Fig. 5C). In the case of CYC8, canonical transcript was strongly induced in an Ndt80-dependent manner (Fig. 5C). In all cases, analysis of our mRNA-seq data showed accumulation of overall mRNA levels to be strongly dependent on Ndt80 induction in a manner similar to that seen for canonical targets like CDC5 (Fig. 5C, 5D, S5E–L). Further, we observed a sharp increase in NDT80 mRNA within 15 minutes of βE addition, and subsequent increases in other target transcripts, canonical (CDC5, HRR25, CYC8) or LUTI (POP7, MED7, ORC3), with differing degrees of induction but within a shared timespan of ~45 minutes after βE addition, supporting a model in which both of these disparate target sets are simultaneous direct targets of Ndt80 (Fig. 5C, 5D).
Comparison of mass spectrometry and mRNA-seq data showed that, as expected, Ndt80 induction resulted in accumulation of first mRNA, then protein for canonical Ndt80 targets, including Cdc5 and Hrr25 (Fig. 5F, 5G). We were also able to detect Ndt80-dependent protein accumulation for Cyc8, which showed a similar pattern to these targets (Fig. 5H). Most interestingly, we detected protein for Pop7 (Fig. 4E, 5A, 5C), and observed that although overall POP7 mRNA levels were drastically increased following and dependent on Ndt80, this condition resulted in slight decreases in protein levels with Ndt80 induction (Fig. 5I). In contrast, without Ndt80 induction, Pop7 protein levels were seen to increase in this same timeframe, suggesting that induction of the long POP7 isoform by Ndt80 “turns off” pre-existing default protein production from this gene (Fig. 5I). This result shows that Ndt80 induction results in coordinate up-regulation and down-regulation of protein production of distinct sets of genes despite increased mRNA abundance for both types of targets (Fig. 5E).
New LUTI-type cases show evidence of spatio-temporal co-regulation
For most of the 380 LUTI cases, as is true of most canonically regulated genes that are expressed during meiotic differentiation, we do not know the transcription factor(s) responsible for their induction. We identified a signature in our new annotations, however, that supports the involvement of regulated differential transcriptional control in many cases. Among the 380 proposed LUTI-regulated genes, 42 of them— far more than would be expected by chance —were in adjacent genomic locations and in a divergent orientation such that the 5′ ends were close (Fig. 6B).
We wondered if this enrichment for genomically neighboring positions suggested coordinated transcriptional regulation. To investigate this possibility in greater depth, we examined mRNA read patterns over time and space in the genomic vicinity of each of our 380 predicted LUTI cases for evidence of their co-regulation with any stable neighboring transcripts. In approximately half of the cases, we observed clear evidence for co-regulation in time and genomic space (Fig. 6C). One of these was RRD2, which we had annotated as showing LUTI-based regulation, and which appeared to be spatio-temporally co-regulated with production of a long version of the RAD53 mRNA (encoding a DNA damage kinase, CHK2 in humans) that we had not identified as a candidate for LUTI-based regulation (Fig. 4D, 6D, 3D). We noted that both RRD2 and RAD53 showed short transcripts at similar times and 5′ extended transcripts at similar times, and the positions of 5′ ends of the longer transcripts were in close proximity (within 50 nt), suggesting transcriptional co-regulation. We confirmed the presence of the predicted longer version of the RAD53 transcript, and noted that the ORF appeared to be poorly translated when two AUG-initiated uORFs were translated (Fig. 6D, 6E, S4G), although we had not previously annotated translated AUG-initiated uORFs for this gene. 94 of our set of 380 LUTI-based regulation candidates showed evidence for spatio-temporally coordinated co-regulation of long transcript isoforms like that seen for RAD53/RRD2 (Fig. 6C, Fig. S6B). We further observed several other patterns that suggested neighboring transcript co-regulation (Fig. S6), including cases in which LUTI transcription was correlated in time and genomic position with transcription of a canonical transcript for a gene with no evidence for LUTI-type regulation [Fig. S6G–I (Xie et al., 2016)]. We noted that in all such cases, the 5′ transcript ends were either overlapping or close (within 100 nt), suggesting that co-regulation of two long transcript isoforms, or a LUTI and another transcript, may be driven by a change in chromatin structure and/or a shared transcription factor at a bi-directional promoter (Xie et al., 2016). The majority of canonical Ndt80 transcriptional targets (Figure 2D) also show divergent and spatiotemporally-regulated transcription, consistent with this feature as a hallmark of transcriptional activation [data not shown; examples in Fig. S6C, S6G; (Bussemaker et al., 2001)].
Figure 6.

Newly identified LUTIs result in strong apparent translational control and show unusual spatio-temporal transcriptional coordination. A) A histogram of the ratio between the highest and lowest TE measured is shown for the genes that we predicted to be LUTI-regulated (Fig. 3D), revealing a higher difference for these genes compared to others. B) The incidence of directly adjacent and divergently oriented genes with their 5′ ends close is shown for our newly defined prospective LUTIs and a control set, chosen to include the 380 genes with the lowest protein:translation Pearson correlation in our dataset. C) We examined the full set of 380 predicted LUTI cases for evidence of neighboring, correlated transcripts, with 94 of these cases oriented divergently and with apparently co-regulated long transcript isoform cases (Fig. 3D). D) mRNA seq data for the RAD53/RRD2 locus is shown, demonstrating their divergent, neighboring orientation. RAD53 shows a regulated longer transcript of the predicted size that is poorly translated. RAD53 regulation looks similar to the regulation for RRD2 (Fig. 4D, 6D) but we had not previously annotated translated AUG-initiated uORFs for RAD53. E) Translation levels, mRNA, protein, and TE for RAD53 are shown above Northern blotting of matched samples. See also Fig. S6, S7.
The discovery that RAD53 showed LUTI-like regulation but was missed by our annotation approach led us to investigate if our requirement for previously annotated uORFs (Fig. 3D) might result in other false negative cases. To investigate this possibility, we searched for genes that showed a poor mRNA:protein correlation that did not have annotated uORFs and determined whether there was evidence for translational regulation associated with an alternate transcript at the locus. We identified several cases that did appear to be associated with AUG-initiated uORF translation (Fig. S7A–D). In the cases of ADH1 (encoding alcohol dehydrogenase) and CTT1 (encoding Catalase T), like RAD53 above (Fig. 6D, 6E), the uORF in question was one that we had annotated as translated but not previously annotated within the leader of a canonical gene (Brar et al., 2012). It seems likely that there will be cases in which extended 5′ leaders suppress translation independent of AUG-initiated uORF translation, but we have yet to confirm such an example. Nonetheless, cases like RAD53, ADH1, and CTT1, which our systematic approach (Fig. 6D, 6E, Fig. S7A–D) failed to identify as LUTI-regulated, suggests that a regulatory mechanism in which transcript toggling drives protein levels is likely to be an even greater contributor to the dynamic content of the meiotic proteome than predicted by the evidence for 380 cases presented here (Fig. 3D).
Discussion
We find that gene regulation based on transcript toggling, a mechanism recently dissected in detail for a single gene (Chen et al., 2017; Chia et al., 2017), is a general mode of gene regulation during meiotic differentiation in yeast, determining the protein levels for at least 8% of measured genes (Fig. 7A). This regulatory mechanism, in which transcript isoform identity rather than transcript quantity drives protein accumulation, dramatically remodels the meiotic proteome relative to what would be expected from traditional models of gene regulation. Our results suggest that a substantial subset of the meiotic transcriptome contains protein coding regions that are not decoded by the ribosome into protein, and that this subset can change over time as part of this developmental program. As a result, total mRNA levels may have no relationship to protein levels for many genes in a changing cell.
We base our general model of this non-canonical regulation (Fig. 7) on observations from our dataset and on recent studies of NDC80 (Chen et al., 2017; Chia et al., 2017). In short, the relative levels of two transcription factors may determine the relative levels of two transcripts for these loci. The longer transcript does not result in efficient protein synthesis due to translation of interfering uORFs, while the short transcript does (Fig. 7A). In the case of NDC80, transcription from the distal TSS promotes cis-silencing by epigenetic modification at the proximal TSS, a key aspect of the toggling observed between the two isoforms. This may be true for many genes in our new set, as well, based on the inverse pattern generally seen for the two isoforms (in particular, Fig. 4B, 4E, 4F, 4H, S4O, S7C]. LUTI-based regulation is analogous in many ways to transcriptional repressor-based regulation (Fig. 7B), in that in general in both cases, two trans-factors control the capacity for protein synthesis of a gene. In the latter case, however, mRNA levels would be predictive of protein levels, while in the LUTI case, this may not be true.
Figure 7.

A model for the control of protein levels by transcript isoform toggling in meiosis. A) A subset of genes are encoded by two isoforms, differing in their 5′ end. These isoforms result from two transcription start sites (TSSes) and the choice between these two TSSes may be controlled by the relative levels of the two transcription factors (TF2 and TF1) that can bind the proximal and distal TSS, respectively. If TF2 binds the proximal TSS, a canonical transcript is produced with a short 5′ leader that is well translated and results in protein accumulation. If TF1 accumulates, it binds the distal TSS and produces a longer transcript at this locus. This transcript includes the sequence for the encoded gene, but ribosomes do not decode this region into protein due to uORFs in the extended leader region. Analysis of one case shows that transcription of the LUTI can silence the proximal TSS in cis (Chia et al., 2017). The difference in translatability of the two transcripts is more important than the abundance of transcript at these loci. Further, by this model, TF2 ultimately activates gene expression and TF1 ultimately represses gene expression. B) In contrast, canonical transcriptional repression involves either loss of binding of an activating transcription factor or the additional presence of a repressor molecule. C) In a developmental process, the LUTI mechanism can enable coordinated activation of genes required for the next cellular state and repression of genes involved in the past cellular state. D) This mode of regulation allows a relay of sequential activation and repression to time protein levels to a window of action. E) The modular nature of LUTI regulation allows genes to be turned on an off in a coordinated manner for windows of different lengths of time. For example, gene A protein production would be turned on by TF1 and turned off by production of a LUTI by TF2. Gene C, would also be turned on by TF1, but would stay on longer, until shut down by TF3.
Several factors lead us to believe that our annotations are underestimating the total incidence of LUTI-based regulation. First, we identified the set of 380 cases reported here by limiting our search pool to the set of genes that we measured to show a poor mRNA:protein correlation (Fig. 2A, Fig. 3D). This requires that we searched for and captured the protein by mass spectrometry, which excludes ~2200 canonical genes and thousands of noncanonical, shorter genes (Brar et al., 2012; Ingolia et al., 2014). Second, our follow-up analysis of the mRNA-seq data and ribosome profiling data for evidence of alternate isoforms and uORF translation require high enough expression levels for such effects to be clear. Third, the 5′ extension must be long enough that a shift in transcript boundary is apparent in the mRNA-seq data. Fourth, our ability to see transient isoforms is limited by population synchrony. The case of CTT1 is informative, as the 8 hour timepoint shows a mixture of the two isoforms which is visible by Northern blotting but was not immediately evident from the mRNA-seq data alone (orange, Fig. S7C–D). Finally, our LUTI prediction pipeline required previous annotation of a translated AUG-initiated uORF, but we are aware that our uORF annotations are incomplete (demonstrated for RAD53, ADH1, and CTT1; Fig 6E, Fig. S7A–D) and also because there may be alternate mechanisms by which a longer 5′ leader could repress translation relative to a shorter one.
Why is this mode of regulation so common in meiotic cells? It seems effective at driving up- and down-regulation of protein levels without the need for a dedicated trans-factor for transcriptional repression. This process instead allows repurposing of existing transcription factors for a new function, dependent only on cis-sequence evolution. It also appears to be readily reversible and tunable, resulting in ramping up and down of protein levels that may be important to the timing in developmental processes, which involve a series of switches in cell state (Fig. 2C, Fig. 7C–E;Chen et al., 2017; Chia et al., 2017). Further, the use of a common set of transcription factors to traditional transcriptional up-regulation provides an efficient solution for coordinated of up- and down-regulation of sets of protein targets (Fig. 2C, 3C, 7C–E). This feature is ideal for executing coordinated cell state changes, over biological and evolutionary time.
With the recent ability to quantify gene expression globally at multiple levels, there has been intense interest in ascertaining the relative importance of different stages of gene regulation (Liu et al., 2016). Our work suggests that a focus on relative quantitative contributions may cause us to miss important qualitative changes. A single transcription factor can activate protein expression or repress protein production, a distinction based not on whether an mRNA is induced or not, but based on the position of the TSS relative to the ORF start codon and the resultant translatability of the specific isoform induced (Fig. 2C, 3A, 3C, 7). A significant implication is that inferring protein production based on mRNA abundances may not just give an incomplete picture; rather such measurements may lead to completely false conclusions about protein levels. Similarly, our data shows that identification of alternate transcript isoforms alone is not enough to infer translational regulation. We identify cases in which regulated 5′ transcript extensions are seen, even accompanied by uORF translation, but for which we cannot detect an effect on translation or protein production (example in Fig. S7E–F). The basis for the difference between these cases and LUTI-based regulation remains unclear and suggests that there are important features of this regulation that are yet to be uncovered.
Our ability to systematically identify many cases of a new mode of gene regulation was enabled by the depth, time-resolved, and parallel nature of our measurements. A dataset with few timepoints or without matched measurements of mRNA and protein may not have allowed sensitive identification of the anti-correlations between mRNA and protein levels. Without matched TE measurements, we would not have been able to determine the basis for these poor correlations. Our analyses were also enabled by the apparently relatively short protein half-lives in meiotic cells relative to our timepoint spacing (Fig. 1B). A short protein half-life is a feature that one would expect to generally see during processes involving rapid unidirectional change in cellular state and this feature was important in revealing both the low mRNA:protein correlation among LUTI-regulated genes and the high mRNA:protein correlation for traditionally regulated genes (Fig. 2A, 2E). Given recent evidence of widespread alternate TSSes in mammalian cells and for variant translation efficiencies of alternate mammalian transcripts [examples in (Floor and Doudna, 2016; Wang et al., 2016)], along with the high degree of conservation of some of the genes for which we observe LUTI-based regulation, it seems likely that this mode of integrated regulation may be used outside of yeast. A recent study that compared mRNA and protein levels over embryonic development in frogs determined that a large set of genes showed a poor mRNA:protein correlation over time (Peshkin et al., 2015). Some of those cases were deemed a result of measurement noise, but it is possible that a LUTI-based mechanism might explain a remaining subset of such cases.
We suggest that thinking of transcription and translation as independent levels of regulation in eukaryotes may obscure important principles in gene regulation. Widespread use of alternate TSSes has been seen by genome-wide approaches [for example, (Aanes et al., 2013; Pelechano et al., 2013)]. Similarly, it is clear that 5′ leader identity is key in setting translation efficiency [examples in (Floor and Doudna, 2016; Hinnebusch et al., 2016; Law et al., 2005; Rojas-Duran and Gilbert, 2012; Wang et al., 2016)]. The connection between these two concepts—that a regulated toggle in TSS usage driven by the relative activity of two transcription factors can determine whether a protein-decodable or non-decodable transcript is made, and that this mechanism is employed pervasively in setting protein levels during cell fate determination, however, has not been previously apparent. By this mechanism, timed changes in the transcript pool composition for a large set of genes, rather than their levels, are key in driving the changing composition of the proteome through cellular differentiation. Further, the concept of simultaneous up- and down-regulation of distinct sets of genes by a single transcription factor provides a previously unrecognized and elegant solution to the problem of precisely coordinating increases and decreases in protein expression during a developmental program.
STAR Methods
CONTACT FOR REAGENT AND RESOURCE SHARING
Further information and requests for resources and reagents should be directed to and will be fulfilled by the Lead Contact, Gloria Brar (gabrar@berkeley.edu).
EXPERIMENTAL MODEL AND SUBJECT DETAILS
Yeast material and growth conditions
All experiments were performed using diploid Saccharomyces cerevisiae strains of the SK1 background. All are MATa/alpha except Br-Ün5805, an SK1 strain that is wild-type except for two copies of the MATa locus and no MATalpha locus (van Werven et al., 2012). This latter strain will not undergo meiosis, even when stimulated with conditions that should induce it.
For major meiotic timecourse, Br-Ün strain 1362 [equivalent to gb15 in (Brar et al., 2012)] was inoculated into YEPD overnight, then diluted to OD6000.2 into buffered YTA and grown for 12 hours. Cells were washed in water and resuspended in 250 ml sporulation media supplemented with 0.02% raffinose. Cells were incubated, with shaking at 30°C. For vegetative growth, strains were incubated with shaking at 30°C.
METHOD DETAILS
Sample collection
Meiotic samples for main experiment were collected at the timepoints presented in Figure 1, as in (Brar et al., 2012), using 1 minute cyclohexamide treatment, filtration and flash freezing in liquid Nitrogen in two portions, 90% for ribosome profiling, 10% for total RNA isolation. Vegetative exponential samples were collected after growth of 750 ml in YEPD to OD6000.6 from a dilution to OD6000.05. MATa/a samples were treated as the meiotic, but only one sample was collected, at 4.5 hours.
3 mL flash frozen buffer was added to ribosome profiling aliquot (also to be used for mass spectrometry) of the standard ribosome profiling composition (20mM Tris pH8, 140mM KCl, 1.5mM MgCl2, 100ug/ml cycloheximide, 1% Trition X-100) supplemented with 2ug/ml Aprotinin, 10ug/ml Leupeptin, 1mM PMSF, 1:100 PIC2, 1:100 PIC3 (both Sigma inhibitor cocktails). Samples were lysed by Retsch mixermilling (6×3 minute rounds at 15 Hz). Resulting powder was thawed, spun once at 4C for 5 min at 3000 RCF, sup was removed and spun at 20,000 RCF at 4C for 10 minutes. Extract was aliquoted in 200ul portions and flash frozen. Identical extract was used for ribosome profiling and mass spectrometry.
Ribosome profiling
Ribosome profiling was performed as described previously in (Brar et al., 2012). The detailed protocol is identical to (Ingolia et al., 2012) except that no linker ligation was used and instead ribosome footprints were polyA-tailed to mark the 3′ends rather than using linker ligation. In short, samples were treated with RNase I (Ambion) at 15 U per A260 unit of extract for 1 hour at room temperature. Samples were then loaded onto sucrose gradients (10–50%) and centrifuged for 3 hrs. at 35,000 rpm at 4°C in a SW41Ti rotor (Beckman). 80S/monosome peaks were collected using a Gradient Station (BioComp). RNA was extracted using the hot acid phenol method, RNA was size selected from a polyacrylamide gel, dephosphorylated, polyA-tailed, subjected to rRNA subtraction, RT-PCR, circularization, and PCR. The enzymes used were PNK (NEB, lot 0951602), E.coli polyA polymerase (NEB, lot 0101309), Superscript III (Thermo, lot 1752971), Circ Ligase (Epicentre), Phusion polymerase (NEB). Oligos used were oCJ200-oligodT for Reverse transcription, oNTI231 and aatgatacggcgaccaccgagatcggaagagcacacgtctgaactccagtcac-barcode-cgacaggttcagagttc index primers, for PCR, all also PAGE purified from IDT, where the barcodes are six nucleotides in length. Sequencing was done for both reads with standard Illumina oligos.
mRNA sequencing
The protocol followed was identical to above, except for the following: single round polyA-selected RNA was alkaline fragmented and size selected to 30–50 nt. Fragments were subjected to an identical library prep pipeline as the footprints, but no selective rRNA subtraction round was used. A parallel set of RNA was sequenced that excluded the polyA-selection step, but sequencing depth of mRNA was much lower, as expected, and agreement with the polyA-selected data was high (Fig. S2B). We thus use the polyA-selected mRNA data for all analyses presented.
Sequencing
All samples were sequenced on an Illumina HiSeq 2500, 50SRR, with multiplexing, at the UC-Berkeley Vincent Coates QB3 Sequencing facility.
Meiotic staging
Progression of cells through meiosis in each timecourse included here was determined by quantification of nuclear morphology by DAPI staining (Vectashield, Vector) of ethanol-permeabilized cells adhered to a polylysine-treated glass slide. Prior to anaphase I, cells show mononucleate morphology, at and after anaphase I and before anaphase II, cells show binucleate morphology, during and following anaphase II, cells show tetranucleate morphology. All timecourses were also assessed at 24 hours after transfer to sporulation media by brightfield microscopy to ensure high efficiency of spore formation, which we typically observe at ~90%. The Ndt80 induction experiment (Fig. 5C–I, S5) was also staged using indirect immunofluorescence of alpha-tubulin, using a rat anti-tubulin antibody (Serotec) at a dilution of 1:200 and anti-rat FITC antibody (Jackson ImmunoResearch Laboratories) at 1:100. Fluorescent microscopy was done on a DeltaVision microscope with a 100X objective.
Ndt80 induction
Cells carrying GAL-NDT80 and pGPD1-GAL4(848). ER constructs [as described in (Carlile and Amon, 2008)] were introduced to sporulation medium and incubated with shaking at 30OC for 5.5 hours. At that time, β-estradiol was added to half of the culture at a concentration of 1μM. The Northern blotting of the Ndt80 release experiment in Fig. 5A, 5B was done using mRNA extracted for this manuscript from frozen pellets archived from the experiment published in (Brar et al., 2012). Data in Figure 5B is based on analysis of matched translation and mRNA-seq data from (Brar et al., 2012).
Strain construction
Reporter strains used for Western blotting pictured in Figure 4 were constructed by amplification of promoter regions, including >200 nt upstream of 5′ most mRNA-seq read observed at any timepoint in our dataset. These regions were cloned upstream of a plasmid encoding eGFP to create (pPOP4-eGFP), pUB1288 (pRAD16-eGFP), and pUB1290 (pSHS1-eGFP). pUB1288 was mutated to remove the 50 nt region containing the proximal promoter to create pUB1324 (pSHS1 prox-eGFP), using the Q5 Site-directed mutagenesis kit (New England Biolabs). All constructs were integrated into the genome by amplification TRP1 on both sides and integration into this locus in a strain carrying a trp1::hisG allele.
Western blotting
Western blotting was performed using a standard trichloroacetic acid (TCA) protocol, exactly as described in (Chen et al., 2017), except using a mouse anti-GFP JL8 antibody (Clontech). In short, 5ml of meiotic cells in culture (or 2ml vegetative) were collected and incubated with 5% TCA for at least 10 minutes at 4°C. Cells were centrifuged for 2 min. at 20,000 rcf and supernatant was aspirated. Cells were washed with acetone and pellets dried for at least 2 hours. Cell extract was made by addition of TE, supplemented with 3 mM DTT and protease inhibitors (Roche), and 1 volume of acid-washed glass beads. Tubes were agitated for 5 minutes, after which 3X SDS sample buffer was added, samples were boiled for 5 minutes, centrifuged for 5 min at 20,000 rcf. 8 μl supernatant was loaded onto Bis-Tris acrylamide gels. Gels were transferred using a Turboblot system (BioRad). Primary anti-GFP antibody dilution was 1:2000, anti-hexokinase was 1:12,000, secondary (Li-Cor) was 1:20,000. Primary antibody incubation was overnight, secondary for 1–2 hours. Blots were visualized using a Li-Cor system.
Northern blotting
8ug of total RNA from timecourse (Fig. 1A) was loaded onto either 1% or 1.5% Formaldehyde agarose gels, and run at 170V for 2.5 hours. A DNA ladder was also loaded to assess rough sizing. The gel was transferred onto a nylon membrane (Hybond, GE), crosslinked, and methylene blue stained for loading. The blot was blocked with Northern Max Ultrahyb buffer (Ambion) at 68C for 30 minutes. The probe was generated by PCR of wild-type genomic yeast DNA and in vitro transcription (MaxiScript T7 kit, Thermo) using alpha-UTP and all other nucleotides cold. The blot was incubated with the probe overnight at 65C, washed as recommended by NorthernMax kit (Ambion), and visualized using Typhoon phosphor-imaging.
Mass spectrometry
Deep coverage meiotic time course proteomics data set generated by TMT-labeling and sample fractionation
Proteins were precipitated by adding -20°C cold acetone to the lysate (acetone to eluate ratio 10:1) and overnight incubation at -20°C. The proteins were pelleted by centrifugation at 20000xg for 15min at 4°C. The supernatant was discarded and the pellet was left to dry by evaporation. The protein pellet was reconstituted in 200μl urea buffer (8M Urea, 75mM NaCl, 50mM Tris/HCl pH 8.0, 1mM EDTA) and protein concentrations were determined by BCA assay (Pierce). 40μg of total protein per sample were processed further. Disulfide bonds were reduced with 5mM dithiothreitol and cysteines were subsequently alkylated with 10mM iodoacetamide. Samples were diluted 1:4 with 50mM Tris/HCl (pH 8.0) and sequencing grade modified trypsin (Promega) was added in an enzyme-to-substrate ratio of 1:50. After 16h of digestion, samples were acidified with 1% formic acid (final concentration). Tryptic peptides were desalted on C18 StageTips according to (Rappsilber et al., 2007) and evaporated to dryness in a vacuum concentrator. Desalted peptides were labeled with the TMT10plex mass tag labeling reagent according to the manufacturer’s instructions (Thermo Scientific) with small modifications. Briefly, 0.5 units of TMT10plex reagent was used per 40μg of sample. Peptides were dissolved in 50μl of 50mM Hepes pH 8.5 solution and the TMT10plex reagent was added in 20.5μl of MeCN. After 1h incubation the reaction was stopped with 4μl 5% Hydroxylamine for 15min at 25°C. Differentially labeled peptides were mixed for each replicate (see mixing scheme in Table S8) and subsequently desalted on C18 StageTips (Rappsilber et al., 2007) and evaporated to dryness in a vacuum concentrator.
To reduce peptide complexity and achieve deeper proteome coverage, samples were then separated by basic reversed-phase chromatography as described in (Mertins et al., 2013). Briefly desalted peptides were reconstituted in 20mM ammonium formate, pH 10, (900μl) and centrifuged at 10,000g to clarify the mixture before it was transferred into autosampler tubes. Basic reversed-phase chromatography was conducted on a Zorbax 300Å Extend-C18 column, using an Agilent 1100 Series HPLC instrument. The separations were performed on a 2.1mm. 150mm column (Agilent, 3.5μm bead size). Prior to each separation, columns were monitored for efficient separation with standard mixtures containing 6 peptides. Solvent A (2% acetonitrile, 5mM ammonium formate, pH 10), and a nonlinear increasing concentration of solvent B (90% acetonitrile, 5mM ammonium formate, pH 10) were used to separate peptides by their hydrophobicity at a high pH. We used a flow rate of 0.2ml/min and increased the percentage of solvent B in a nonlinear gradient with 4 different slopes (0% for 1min; 0% to 9% in 6min; 9% to 13% in 8min; 13% to 28.5% in 46.5min; 28.5% to 34% in 5.5min; 34% to 60% in 23min; 60% for 26min). Eluted peptides were collected in 96 well plates with 1min (= 0.2 ml) fractions. Early eluting peptides were collected in fraction “A”, which is a combined sample of all fractions collected before any major UV-214 signals were detected. The peptide samples were combined into 12 to be used for proteome analysis. Subfractions were achieved in a serpentine, concatenated pattern, combining eluted fractions from the beginning, middle, end of the run to generate subfractions of similar complexities that contain hydrophilic as well as hydrophobic peptides. For high-scale proteome analysis every 12th fraction was combined (1,13,25,37,49,61; 2,14,26,38,50,62; …). Subfractions were acidified to a final concentration of 1% formic acid and desalted on C18 StageTips according to (Rappsilber et al., 2007). LC-MS/MS analysis on a Q-Exactive HF was performed as previously described (Keshishian et al., 2015).
All mass spectra were analyzed with the Spectrum Mill software package v4.0 beta (Agilent Technologies) according to (Mertins et al., 2013) using the yeast Uniprot database (UniProt.Yeast.completeIsoforms.UP000002311.20151220; strain ATCC 204508 / S288c). For identification, we applied a maximum FDR of 1% separately on the protein and peptide level and proteins were grouped in subgroup specific manner. We required at least 1 spectral count from a unique peptide for protein identification and for protein quantification per replicate measurement. 72 proteins were identified and quantified by one spectral count in each replicate, 231 proteins by one count in one replicate and >1 in the other replicate and 4161 proteins by >1 spectral count in both replicates. Note that the S288C UniProt dataset was used because we are not aware of an equivalently complete protein dataset for SK1, and due to poorer sequencing depth and annotation of this genome relative to the reference, our attempt to create one excluded many proteins. This presumably caused us to miss capture of some proteins for which the quantifiable peptides are not identical in the two strains, but should not cause artifacts in our correlation measurements, because all measurements are relative among timepoints.
Finally, we normalized the Spectrum Mill generated intensities the following way. For the “… total norm” values in Table S3, we normalized the Spectrum Mill generated intensities such that at each condition/time point the TMT intensity values added up to exactly 1,000,000, therefore each protein group value can be regarded as a normalized microshare (we did this separately for each replicate for all proteins that were present in that replicate TMT mix). For the “… MS1 total” values in Table S3, we used these normalized “… total norm” values to assign each protein group of a TMT labeled sample its proportional fraction of the Spectrum Mill generated “total MS1” intensities, based on its labeling channel specific “… total norm” intensity relative to the sum of the “… total norm” intensities of all labeled channels for the corresponding protein group. For the “… MS1 mean” values in Table S3, we used these normalized “… total norm” values to assign each protein group of a TMT labeled sample its proportional fraction of the Spectrum Mill generated “mean MS1” intensities, based on its labeling channel specific “… total norm” intensity relative to the sum of the “… total norm” intensities of all labeled channels for the corresponding protein group.
Note: In order to compare protein group specific intensity values between the TMT quantified meiotic time courses and our control label free quantified (LFQ) meiotic time course (replicate 2 only, missing the “25h spores” time point only), we analyzed the above generated data also with MaxQuant (version 1.6.0.16), as that was the program of choice for our LFQ measurements. The same parameters were applied as for the LFQ data analysis (see below). Each protein group of a TMT labeled sample got its proportional fraction of the MS1 based LFQ intensities based on its labeling channel specific TMT MS2 intensity relative to the sum of TMT MS2 intensities of all labeled channels for the corresponding protein group. Afterwards we normalized these fractional MS1 LFQ intensities such that at each condition/time point these intensity values added up to exactly 1,000,000, therefore each protein group value can be regarded as a normalized microshare. These microshare values were then compared to the normalized microshare LFQ based intensities from our label free meiotic time course samples (Figure S1D, see below).
Control meiotic time course proteomics data generated by Label Free Quantification (LFQ)
In order to validate the TMT-based quantification results, we performed proteomics based LFQ, which does the quantification on the MS1 level, instead of the MS2 level and does not allow multiplexing as is the case for TMT labeling. Therefore, different systematic biases are introduced by LFQ based proteomics than by TMT based proteomics and it serves as a quite stringent test to our deep proteome quantification results obtained by our TMT based approach. We quantified 9 matched samples, all coming from the second replicate of the meiotic time course. The only sample missing was the “25 hours spore” sample.
Proteins were precipitated by adding -20°C cold acetone to the lysate (acetone to eluate ratio 10:1) and overnight incubation at -20°C. The proteins were pelleted by centrifugation at 20000xg for 15min at 4°C. The supernatant was discarded and the pellet was left to dry by evaporation. The protein pellet was reconstituted in 100μl urea buffer (8M Urea, 75mM NaCl, 50mM Tris/HCl pH 8.0, 1mM EDTA) and protein concentrations were determined by BCA assay (Pierce). 20μg of total protein per sample were processed further. Disulfide bonds were reduced with 5mM dithiothreitol and cysteines were subsequently alkylated with 10mM iodoacetamide. Samples were diluted 1:4 with 50mM Tris/HCl (pH 8.0) and sequencing grade modified trypsin (Promega) was added in an enzyme-to-substrate ratio of 1:50. After 16h of digestion, samples were acidified with 1% formic acid (final concentration). Tryptic peptides were desalted on C18 StageTips according to (Rappsilber et al., 2007) and evaporated to dryness in a vacuum concentrator. Desalted peptides were reconstituted in Buffer A (0.2% Formic acid).
LC-MS/MS analysis was performed on a Q-Exactive HF. Each sample was measured twice (a total of 18 mass spec runs). Around 1μg of total peptides were analyzed on an Eksigent nanoLC-415 HPLC system (Sciex) coupled via a 25cm C18 column (inner diameter 100μm packed in-house with 2.4μm ReproSil-Pur C18-AQ medium, Dr. Maisch GmbH) to a benchtop Orbitrap Q Exactive HF mass spectrometer (Thermo Fisher Scientific). Peptides were separated at a flow rate of 200nL/min with a linear 106min gradient from 2% to 25% solvent B (100% acetonitrile, 0.1% formic acid), followed by a linear 5min gradient from 25 to 85% solvent B. Each sample was run for 170min, including sample loading and column equilibration times. Data was acquired in data dependent mode using Xcalibur 2.8 software. MS1 Spectra were measured with a resolution of 60,000, an AGC target of 3e6 and a mass range from 375 to 2000m/z. Up to 15 MS2 spectra per duty cycle were triggered at a resolution of 15,000, an AGC target of 2e5, an isolation window of 1.6 m/z and a normalized collision energy of 27.
All raw data were analyzed with MaxQuant software version 1.6.0.16 (Cox and Mann, 2008) using a UniProt yeast database (release 2014_09, strain ATCC 204508 / S288c), and MS/MS searches were performed with the following parameters: The two replicate runs per sample were grouped together. Oxidation of methionine and protein N-terminal acetylation as variable modifications; carbamidomethylation as fixed modification; Trypsin/P as the digestion enzyme; precursor ion mass tolerances of 20 p.p.m. for the first search (used for nonlinear mass re-calibration) and 4.5 p.p.m. for the main search, and a fragment ion mass tolerance of 20 p.p.m. For identification, we applied a maximum FDR of 1% separately on protein and peptide level. “Match between the runs” was activated, as well as the “LFQ” (at least two ratio counts were necessary to get an LFQ value). We required 1 or more unique/razor peptides for protein identification and a ratio count of 2 or more for label free protein quantification in each of the 9 samples. This gave us LFQ values for a total of 1568 protein groups.
Finally, we normalized the MaxQuant generated LFQ intensities such that at each condition/time point the LFQ intensity values added up to exactly 1,000,000, therefore each protein group value can be regarded as a normalized microshare (we did this separately for each sample for all proteins that were present in that sample).
Ndt80 release proteomics measurements
Proteins were precipitated by adding -20°C cold acetone to the lysate (acetone to eluate ratio 10:1) and overnight incubation at -20°C. The proteins were pelleted by centrifugation at 20000xg for 15min at 4°C. The supernatant was discarded and the pellet was left to dry by evaporation. The protein pellet was reconstituted in 100μl urea buffer (8M Urea, 75mM NaCl, 50mM Tris/HCl pH 8.0, 1mM EDTA) and protein concentrations were determined by BCA assay (Pierce). 15μg of total protein per sample were processed further. Disulfide bonds were reduced with 5mM dithiothreitol and cysteines were subsequently alkylated with 10mM iodoacetamide. Samples were diluted 1:4 with 50mM Tris/HCl (pH 8.0) and sequencing grade modified trypsin (Promega) was added in an enzyme-to-substrate ratio of 1:50. After 16h of digestion, samples were acidified with 1% formic acid (final concentration). Tryptic peptides were desalted on C18 StageTips according to (Rappsilber et al., 2007) and evaporated to dryness in a vacuum concentrator. Desalted peptides were labeled with the TMT10plex mass tag labeling reagent according to the manufacturer’s instructions (Thermo Scientific) with small modifications. Briefly, 0.2units of TMT10plex reagent was used per 15μg of sample. Peptides were dissolved in 30μl of 50mM Hepes pH 8.5 solution and the TMT10plex reagent was added in 12.3μl of MeCN. After 1h incubation the reaction was stopped with 2.5μl 5% Hydroxylamine for 15min at 25°C. Differentially labeled peptides were mixed for each replicate (see mixing scheme in Table S8) and subsequently desalted on C18 StageTips (Rappsilber et al., 2007) and evaporated to dryness in a vacuum concentrator.
The peptide mixtures were fractionated by Strong Cation Exchange (SCX) using StageTips as previously described (Rappsilber et al., 2007) with slight modifications. Briefly, one StageTip was prepared per sample by 3 SCX discs (3M, #2251) topped with 2 C18 discs (3M, #2215). The packed StageTips were first washed with 100μl methanol and then with 100μl 80% acetonitrile and 0.2% formic acid. Afterwards they were equilibrated by 100μl 0.2% formic acid and the sample was loaded onto the discs. The sample was transeluted from the C18 discs to the SCX discs by applying 100μl 80% acetonitrile; 0.2% formic acid, which was followed by 3 stepwise elutions and collections of the peptide mix from the SCX discs. The first fraction was eluted with 50μl 50mM NH4AcO; 20% MeCN (pH ~7.2), the second with 50μl 50mM NH4HCO3; 20% MeCN (pH ~8.5) and the sixth with 50μl 0.1% NH4OH; 20% MeCN (pH ~9.5). 200μl of 0.2% acetic acid was added to each of the 3 fractions and they were subsequently desalted on C18 StageTips as previously described (Rappsilber et al., 2007) and evaporated to dryness in a vacuum concentrator. Peptides were reconstituted in 10μl 0.2% formic acid. Both the unfractionated samples plus the fractionated, less complex samples were afterwards analyzed by LC-MS/MS on a Q-Exactive HF was performed as previously described (Keshishian et al., 2015).
Around 1μg of total peptides were analyzed on an Eksigent nanoLC-415 HPLC system (Sciex) coupled via a 25cm C18 column (inner diameter of 100μm, packed in-house with 2.4μm ReproSil-Pur C18-AQ medium, Dr. Maisch GmbH) to a benchtop Orbitrap Q Exactive HF mass spectrometer (Thermo Fisher Scientific). Peptides were separated at a flow rate of 200nL/min with a linear 106min gradient from 2% to 25% solvent B (100% acetonitrile, 0.1% formic acid), followed by a linear 5min gradient from 25 to 85% solvent B. Each sample was run for 170min, including sample loading and column equilibration times. Data was acquired in data dependent mode using Xcalibur 2.8 software. MS1 Spectra were measured with a resolution of 60,000, an AGC target of 3e6 and a mass range from 375 to 2000m/z. Up to 15 MS2 spectra per duty cycle were triggered at a resolution of 60,000, an AGC target of 2e5, an isolation window of 1.6 m/z and a normalized collision energy of 36.
All raw data were analyzed with MaxQuant software version 1.6.0.16 (Cox and Mann, 2008) using a UniProt yeast database (release 2014_09, strain ATCC 204508 / S288c), and MS/MS searches were performed with the following parameters: The five mass spec runs were grouped together. TMT11plex labeling on the MS2 level, oxidation of methionine and protein N-terminal acetylation as variable modifications; carbamidomethylation as fixed modification; Trypsin/P as the digestion enzyme; precursor ion mass tolerances of 20 p.p.m. for the first search (used for nonlinear mass re-calibration) and 4.5 p.p.m. for the main search, and a fragment ion mass tolerance of 20 p.p.m. For identification, we applied a maximum FDR of 1% separately on protein and peptide level. We required 1 or more unique/razor peptides for protein identification and a ratio count for each of the 10 TMT channels. This gave us a total of 2908 quantified protein groups.
Finally, we normalized the MaxQuant generated corrected TMT intensities such that at each condition/time point the corrected TMT intensity values added up to exactly 1,000,000, therefore each protein group value can be regarded as a normalized microshare (we did this separately for each TMT channel for all proteins that were made our filter cutoff in all the TMT channels).
QUANTIFICATION AND STATISTICAL ANALYSIS
Sequence alignments, data analysis
Sequencing data were analyzed exactly as in (Brar et al., 2012; Ingolia et al., 2012). In short, bowtie2-based alignment (Langmead and Salzberg, 2012) was used and only unique sequences were mapped. Bowtie2-based mapping and subsequent quantification for ribosome profiling data were executed using quality control metrics and scripts written by Nick Ingolia. These quality control metrics include analysis of ribosome footprint length distributions in ribosome profiling samples to confirm periodicity and optimal RNAse I digestion. Gene expression quantification involved summing unique reads over annotated ORFs and adjustment for RPKM (reads per kilobase million) values. Only genes and timepoints with at least 10 raw ribosome footprint or mRNA reads were used for analyses. Mochiview was used for genome browsing and motif analysis, Cluster 3.0 and Treeview were used for cluster analyses and visualization. All correlation measurements used throughout this manuscript are Pearson correlations.
As is true of most genome-wide studies, our measurements are relative, representing the proportional levels of either mRNA, ribosome footprints, or protein in the population. For meiotic timepoints, including and between 1.5 and 8 hours, these values are expected to be quantitatively comparable, as our previous measurements determined no major shifts in bulk mRNA, translation, or protein levels over this timespan. In contrast, major metabolic shifts are expected as cells enter meiosis (from 0 hr to 1.5 hr) and as they complete spore formation, and major metabolic differences are likely to exist between cells in sporulation medium and rich medium. We chose, however, to analyze relative measurements among all timepoints for two reasons. First, our previous attempts to normalize our measurements relative to doped oligos or exogenous mRNAs introduced an additional source of noise to the data that obscured real biological regulation (Brar et al., 2012). Second, we determined based on examination of the patterns of mRNA, translation, and protein for well studied genes, that our measurements mirrored those from our own and others’ published studies and thus seemed reliable despite some expected metabolic shifts. Nonetheless, we generally refrain from making quantitative comparisons between measurements made in rich media and cells in sporulation media, as these comparisons are the most likely to include complicating large bulk effects.
Note that, although full biological replicates were collected and matched extremely well in most instances, the mRNA for the vegetative exponential replicate 2 appeared contaminated. Attempts were made to re-prepare this sample once this was determined, but the issue was not identified and this sample, in particular, looks unlike vegetative exponential samples that our lab has previously prepared. Because the assignment of replicate 1 and 2 for this sample was arbitrary and because the footprint samples collected from the same culture flasks agreed very well (Table S3), we used the replicate 1 data for the vegetative exponential mRNA. This was the only instance in which the samples were not completely matched from identical cells and we believe that it does not affect the results based on comparisons with our previous timecourse and thorough replicate analyses of the ribosome footprints and protein for this sample.
Genome browsing/motif analysis
We used Mochiview (Homann and Johnson, 2010) for all of our genome browser analyses and motif analyses.
Data clustering and visualization
We used Cluster 3.0 (de Hoon et al., 2004) for our hierarchical clustering, using uncentered correlation clustering with the centered setting. We visualized the results using Java Treeview (Saldanha, 2004).
Translation Efficiency measurements
Translation efficiency measurements were calculated for each gene and timepoint from the formula FPRPKM/mRNARPKM, in both cases only using values that resulted from 10 raw reads or more and in each case, summing only over the annotated open reading frame (ORF).
LUTI annotation
We isolated the pool of genes for which we quantified protein in this dataset and had previously identified evidence for meiotic translation of an AUG-initiated uORF. This pool included 914 genes. We then filtered on the mRNA to protein Pearson correlation over all timepoints, choosing a cutoff at 0.4 to represent “poor” correlation, narrowing the pool to 624 genes. We then assayed mRNA-seq data by genome browser, comparing all timepoints and taking forward only genes that showed evidence for an alternate 5′ extended transcript at some point. We also required that these genes show AUG-initiated uORF translation in this dataset by genome browser analysis of ribosome profiling data and that this translation did not mirror translation of the downstream ORF (or was broadly consistent with an inverse relationship between uORF and ORF translation). In cases in which reads for ribosome profiling reads over uORFs were low or noisy, occasionally observed due to the short nature of many of these regions, we alternatively allowed a case to be scored as positive if the TE at the timepoint when the transcript appeared long by genome browser analysis was lower than the TE when the transcript appeared short by genome browser analysis. This determination did not require any fold change cutoff so that the quantitative confirmation in part Fig. 6A would be independent. The results of this approach are summarized in the pie chart. In 59 cases, we could not analyze the locus for evidence of an alternate transcript due to overlap with a neighboring transcript. In 5 cases, we observed regulation that appeared similar to that observed for the SER3/SRG1 locus [see Fig. S7G for example and discussion; (Martens et al., 2004)], with regulated appearance of an alternate overlapping transcript that does not contain the full canonical ORF; in 3 cases the regulation was difficult to categorize for other reasons; and in 177 cases, there was no clear evidence for an alternate transcript. In the remaining 380 cases, there is moderate to strong evidence for LUTI-based regulation. This includes 78 of the 156 cases that we had annotated as showing alternate 5′ leaders in our original mRNA-seq dataset (Brar et al., 2012).
DATA AND SOFTWARE AVAILABILITY
All raw sequencing and mass spectrometry data for use in this manuscript are available through NCBI GEO (https://www.ncbi.nlm.nih.gov/geo/; GSE108778) and the MassIVE platform (http://massive.ucsd.edu; MSV000081874). Processed data used for analyses in this manuscript are included as Tables S3–S6.
Supplementary Material
Figure S1: Meiotic timecourse data were reproducible and showed expected patterns for well- studied genes, Related to Figure 1. A) and B) show counts of DAPI-based DNA morphology for timecourse replicate 1 and 2, respectively. 200 cells were counted per strain per timepoint for presence of a single DNA mass (mononucleate), two separated DNA masses (binucleate), or four separated DNA masses (tetranucleate). C) Full biological replicate measurements agree well for protein, mRNA, and ribosome footprints. In gray, a comparison of TMT10-based protein measurements for timecourse 1 and 2 are shown for each timepoint. In blue are similar plots for ribosome profiling samples, and in green, for mRNA-seq. R-values are to the bottom right of each graph. Each dot represents a single gene, genes are not filtered for any expression threshold. D) Mass spectrometry measurements made by independent label free quantification show high agreement with our original TMT10 measurements. All timepoints (except spores, for which sufficient material was unavailable) were subjected to mass spectrometry and label free quantification. The values for these measurements compared to TMT10 measurements for all genes that were quantified by both (n=1535) are shown in scatter plots. The TMT10 values represented in these plots are TMT based fractions of the total MS1 signal. E) An overview of the timecourse, with z-score normalization for the mRNA-seq (left), ribosome profiling (middle), and mass spectrometry (right). Plot includes all samples that were quantified by all three methods (n=4464 annotated genes). 523 proteins change by at least two-fold between 1.5 hours and 8 hours in sporulation media, a timeframe that contains no broad shift in cellular metabolism. When including all timepoints, including transitions between rich and sporulation media, more regulation is observed, with 2087 proteins that show relative changes of at least two-fold. F) Protein abundance trends for factors involved in homologous recombination and assembly of the synaptonemal complex (SC) confirmed known regulation for proteins that have well characterized regulation (Cahoon and Hawley, 2016; Lynn et al., 2007). SC assembly begins with chromosome axis formation on each new pair of replicated sister chromatids, mediated by Rec8 (as part of the meiotic cohesin complex), Hop1, and Red1. Zip1 next assembles between the axes to stabilize homolog interactions. These assembly steps occur with timing that overlaps the progression of recombination and influences its outcome, with Dmc1 as an important mediator of strand invasion of resected double-strand breaks to allow repair, and MutS proteins, Msh4 and Msh5, forming a heterodimer that is involved in resolving crossovers. The pattern of accumulation of all of these proteins fits well with the relative timing of these known functions, as does their disappearance. Polo kinase, Cdc5, is induced in late prophase, which results in phosphorylation and degradation of Red1 and Zip1 (Prugar et al., 2017; Sourirajan and Lichten, 2008). The rapid loss of Red1 and Zip1 seen in these data, relative to other factors, like Dmc1, is consistent with single-gene studies. G) Sps100, a component of the spore wall, is low at all timepoints except the one representing mature spores (Law and Segall, 1988). Sic1 degradation is required for meiotic DNA replication (Sedgwick et al., 2006). Its timing of protein decline matches the timing of meiotic DNA replication. Sporulation media (Spo) does not contain a fermentable carbon source and thus the oxidative phosphorylation machinery is upregulated. Consistently, mitochondrial proteins, including Cox1 and Cox2 of the electron transport chain, are seen to be high early in meiosis. H) The meiotic cohesin complex consists of Rec8, the heterodimer Smc1/Smc3, and Irr1. It loads onto the chromosomes during meiotic S-phase, and is stabilized by Pds5. We measure all components to have similar patterns of protein accumulation, but Rec8 disappears first, an expected result of protein degradation through the N-end rule pathway and separase-mediated cleavage, to trigger anaphase (Buonomo et al., 2000). I) Sps1 is known to be translated only after MI, despite high prior levels of mRNA, through a mechanism that involves silencing of SPS1 mRNA by its presence in aggregates of Rim4, which are disassembled as a result of phosphorylation by the meiotic CDK, Ime2 (Berchowitz et al., 2013, 2015). The protein level measurements for these factors match this known regulation remarkably well. J) We can identify known instances of translational control by comparison of mRNA and translation levels. In the case of HAC1, whose mRNA is high and constitutive but contains a cytoplasmically retained intron that prevents productive translation in the absence of Unfolded Protein Response activation, we observe translation during late MI and early MII, as we previously reported (Brar et al., 2012; Cox and Walter, 1996). K) Cdc5, or polo kinase, serves as a control, as it is not thought to be regulated translationally, but its transcription is driven by Ndt80 in late prophase. Consistently, we observe overlapping plots for mRNA and translation measurements, suggesting no or minimal translational control and, as also expected, protein measurements come up with similar timing as the other two. Cdc5 protein is known to be actively degraded by Ama1, and consistently, we see the levels decline rapidly after translation ceases (Okaz et al., 2012).
Table S1: Yeastmine Gene Ontology analysis using Holm-Bonferroni settings to search for cellular components enriched in the 2228 annotated genes for which we did not quantify protein levels by mass spectrometry, Related to Figure 1. Column one is GO Category, two is p-value, three lists associated genes, and four is GO identifier.
Table S2: A list of putative LUTIs annotated, Related to Figure 3. The first two columns are the gene name, third column is the Pearson correlation of mRNA (polyA) to protein over the full timecourse, fourth column is confirmation that there is a translated AUG-initiated uORF, fifth column is the category as represented in Fig. S3A, sixth column is the Pearson correlation between mRNA from total RNA seq and protein, seventh column is the status of neighboring transcription as outlined in Figure 6C.
Table S3: Matched mRNA, translation, and protein measurements through meiosis, Related to Figure 1. This spreadsheet includes the mass spectrometry data in L to CC columns. The set used for analyses throughout the manuscript are in columns BJ to BS and are described in detail in the STAR Methods. Matching footprint data is in columns CD to CM, mRNA (polyA selected) in CN to CW, and mRNA from total RNA sequencing in CX to DG. The values for mRNA seq and ribosome profiling are in RPKM and only counts over 10 raw reads are included.
Table S4: mRNA data for Ndt80 induction experiment, Related to Figure 5. mRNA-seq values (RPKM) for the experiment outlined in Fig. 5E and presented in Figs. 5D–5I.
Figure S2: Many genes show a poor mRNA to protein correlation, both generally and among the large set of targets of the transcription factor Ndt80, Related to Figure 2. A) Comparison of label-free protein quantification and mRNA-seq reveals a similar large subpopulation of genes showing anti-correlated trends between mRNA and protein over meiosis as seen when TMT10 data are used instead (compare to Fig. 2A). B) A histogram of the Pearson correlations between mRNA-seq for each timepoint from single round polyA selection and total RNA-seq. Note that the distribution is positive and does not show subpopulations. C) Average expression of mRNA from single round polyA selection versus correlation values from B). D) Average expression of mRNA from total RNA seq versus correlation values from B). E) A global view of transcript abundance in meiotic differentiation. Shown is the result of centroid hierarchical clustering of the ribosome profiling data for all genes (rows) quantified for mRNA abundance at all timepoints (columns). The total signal in each row is normalized to allow comparisons. The discrete cluster of genes that are thought to be Ndt80 targets are highlighted by a gray box at right. F, G) Promoters of genes identified as being Ndt80 targets based on mRNA abundance patterns are enriched for the Ndt80 binding site, or Middle Sporulation Element (MSE), regardless of protein concordance. F) Mochiview quantification of Ndt80 binding site cumulative enrichment upstream of Ndt80 targets identified from mRNA abundance patterns, genes in the aberrant clusters (noted in Fig. 2A), all Ndt80 targets, and a background set is shown. Note no enrichment in the aberrant Clusters for an unrelated meiotic transcription factor, Ime1. In both plots, p-values for difference of each query set from the background set are shown as dotted lines that depend on the motif score cutoff chosen. G) An unbiased motif search using Mochiview motif finder for upstream regions of Ndt80 targets (Fig. S2E; Fig. 2C) identified from mRNA abundance patterns revealed degenerate AT rich motifs, characteristic of intergenic regions, but only one other, specific motif, which closely matched the MSE. H) A histogram of Pearson correlation coefficients are plotted over all timepoints for the set of genes shown in Fig. 2C and 2D. Black bars represent the correlation coefficients for protein and mRNA for a given gene. Gray bars represent the correlation coefficients for mRNA of a given gene compared to mRNA for NDT80. I) The mean protein and mRNA levels over all timepoints are plotted for each gene, versus correlation coefficients (mRNA:protein) as shown in H. Colored dots represent known, well characterized targets of Ndt80. J) Known, robust translational regulation of SPS1 is subtle with the resolution of our timepoints. mRNA and ribosome profiling measurements are plotted relative to max values to allow comparison. SPS1 message is known to be translationally repressed for at least 1 hour after accumulation and a delay in the translation peak relative to the mRNA peak can be seen, but because timepoints are 1.5 hr-2hr apart, this effect appears more subtle than in previous studies with higher resolution timepoints.
Figure S3: Pipeline for identification of LUTI-based regulation reveals 380 robust cases, Related to Figure 3. A) A more detailed outline of approach in Fig. 3D. See STAR Methods for detailed description. B) TMT10 protein measurements for the 380 genes identified in the approach outlined in Fig. 3D as showing protein levels that are regulated by transcript toggling are shown, with hierarchical clustering performed on timecourse replicate 2 (left) and values from timecourse replicate 1 shown with rows matched at right. C) mRNA seq and ribosome profiling from the two timecourse replicates for four meiotic timepoints each were performed and comparison of these values in scatter plots is shown for each case for the 380 LUTI candidates. D) LUTI candidates show protein measurements with similar trends whether measurements are done by TMT10 or label free quantification. At left, the TMT10 values for timecourse replicate 2 are shown following hierarchical clustering of the 114/380 LUTI candidates that were quantified by both TMT10 and label free quantification over timecourse. At the right are values as measured by label free quantification.
Figure S4: New LUTI cases can be confirmed by robust alternate approaches, Related to Figures 4 and 6. A-H) Shown are independent meiotic timcourse replicates showing similar patterns for short and long transcripts detected in main Figs. 4 and 6. ORFs probed are: A) MED7 B) RRD2 C) POP4 D) RAD16 E) SHS1 F) POP7 G) RAD53 H) ORC3. Only one replicate is shown for ORC3, as the other is in Fig. S4O. ORC3 and POP7 replicates were run on the same gel and therefore methylene blue stain image is identical. Note that RAD53 replicate blots are from a different set of timecourses, using strains 14057 and 14407 and RNA from the experiment staged in P and V. I, J) Staging of additional replicate timecourses for Northern blotting. Categorization of DAPI morphology into either mononucleate, binucleate, or tetranucleate was performed for 200 cells at each timepoint. I) DAPI counting reflecting synchronous meiotic progression is shown for timecourse “red” and J) “blue”, used for blotting in Figure S2A–F, H. K–O) Northern blot confirmation of additional LUTI candidates highlighted in Fig. 4C. K) Comparison of levels and timing between Northern blots for the translocon component-encoding SSH1 ORF and the TE in matched samples shows evidence for a poorly translated long transcript as predicted by the mechanism in Figure 7. A similar analysis for L) UBC13, encoding an E2 ubiquitin-conjugating enzyme, M) YGP1, encoding a cell wall glycoprotein, N) CYC8, a general transcriptional repressor. O) ORC3, a component of the origin recognition complex. Note that due to limiting extract from the original timecourse, the ORC3 Northern blot was performed on extract from replicate “timecourse red”, staged in Fig. S2I. Meiotic progression, as judged by DAPI mass morphology, is shown for experiments presented in Fig. 4G, 4I, 4K, 4L, S4G. P) pPOP4-eGFP cells (14057) R) pRAD16-eGFP (14058) T) pSHS1-eGFP (14060) U) pSHS1∆prox-eGFP (14217) V) WT (14407) Q) Quantification of pPOP4-eGFP Western blot in Fig. 4G. S) Quantification of pRAD16-eGFP Western blot in Fig. 4I.
Figure S5: Ndt80 induces long, translationally inactive isoforms of POP7, MED7, and ORC3 and canonical transcript isoforms of CDC5, HRR25, and CYC8, Related to Figure 5. Staging for experiment shown in Fig. 5C-I by DAPI morphology without and with Ndt80 induction in A) and C), respectively and for spindle morphology by tubulin immunofluorescence in B) and D), respectively. Arrow indicates time of Ndt80 induction by addition of β-estradiol. E) Plots of log2(TE) for transcripts induced by Ndt80 in original timecourse data. Approximate time of Ndt80 activation is indicated by arrow. Note that canonical transcripts show stable or increased TE, while long undecodable isoforms show a drop in TE despite an increase in overall transcript level. F) This figure is the same as Fig. 5D, but with only the genes shown in G-L to allow direct comparison. Induction of Ndt80 results in increased mRNA abundance for canonical and non- canonical targets. Arrow indicates time of Ndt80 induction by addition of β-estradiol. Note that, although levels of transcript accumulation vary, both positive (canonical) and negative (LUTI- like) targets are induced with similar timing. Note that accumulation is dependent on Ndt80. G) Rapid induction of NDT80 mRNA can be seen within 15 minutes of addition of β-estradiol. H) CDC5, a canonical target is induced in an Ndt80-dependent manner within 30 minutes of addition of β-estradiol. I) A short (canonical) version of CYC8 is induced in an Ndt80-dependent manner. Note Ndt80-dependent TSS is at arrowhead and masked somewhat by longer transcript. Compare to Northern blot in Figs. 5A and 5C. J-L) Long uORF containing transcripts defined as LUTI-regulated by approach in Fig. 3D are induced between 30 minutes and 1 hour after addition of β-estradiol in an Ndt80 dependent manner. Compare to Northern blots in Figs. 5A and 5C.
Figure S6: A variety of neighboring transcript associations with LUTIs can be seen, Related to Figure 6. A) mRNA-seq data is shown for the BDF2/YET3 locus, revealing apparently coordinated divergent adjacent LUTIs. B) mRNA-seq data is shown for the PCM1/SOM1 locus, revealing apparently divergent adjacent LUTIs that show mutually exclusive LUTI transcription timing. C) mRNA-seq data is shown for the ORC1/SMA2 locus, highlighting LUTI regulation that is coordinated with transcription of a neighboring canonical transcript. D) mRNA-seq data is shown for the RPO41 locus, revealing apparently coordinated transcription of a divergent unannotated transcript. E) mRNA-seq data is shown for the YCL021W-A locus, revealing apparently coordinated transcription of a divergent unannotated transcript. F) mRNA-seq data is shown for the CFT2/AVL9 locus, revealing apparently coordinated divergent adjacent long transcripts. CFT2 shows hallmarks of LUTI-based regulation, including a poor correlation between protein and mRNA, while AVL9 shows an alternate transcript but no clear evidence that this affects translation of the AVL9 ORF. G-I) Trancription of meiosis-specific genes with spatio- temporal association with neighbors. G) Associated transcription between the MBA1 LUTI and canonical PCH2 transcript can be seen by mRNA-seq analysis. H) Associated transcription between the LIN1 LUTI and canonical REC104 transcript can be seen by mRNA-seq analysis. I) The Ndt80-induced PES4 transcript increases with timing and TSS position closely mirroring an unannotated transcript on the minus strand. An MSE is positioned at the point at which the two transcript 5’ ends meet.
Fig. S7: Additional LUTIs are likely to exist that were missed in our annotations due to poorly annotated AUG-initiated uORFs, Related to Figures 3 and 6. A) ADH1 shows a poor protein:mRNA correlation and Northern blotting reveals two transcripts, the longer of which is associated with a lower TE. B) An inverse correlation between upstream translation of a misannotated AUG-initiated uORF and ADH1 ORF translation can be seen from ribosome footprint data at this locus. Matching mRNA-seq data are above C) CTT1 shows a poor protein:mRNA correlation and Northern blotting reveals two transcripts, the longer of which is associated with a lower TE. D) mRNA seq data at the CTT1 locus is ambiguous due to low expression levels. It would be difficult from mRNA-seq alone to have predicted the short vegetative transcript or the mixed transcript pool at 8 hours. Matching ribosome profiling data are below. E) YOP1 shows a long alternate transcript with translated AUG uORFs, but it is not a LUTI. Northern blotting of YOP1 confirms a longer alternate transcript at this locus of the size predicted from mRNA-seq data, but we do not find a clear association between the relative ratios of the two YOP1 transcripts and the TE at this locus (above). Consistently, the correlation between mRNA and protein for YOP1 is strongly positive (below graph). F) mRNA-seq and ribosome footprint data at this locus suggest no negative association between translation of the AUG uORFs on the log transcript and the translation of the YOP1 ORF. G) Putative new cases of the type of regulation reported for SER3/SRG1. Positive strand mRNA-seq data for the LAS17 locus are shown. Here it appears that the transcript that is initiated distally terminates and therefore does not contain the LAS17 ORF. This type of regulation has been shown to result in decreased transcription from the one canonical TSS (Martens et al., 2004), but would not produce a LUTI transcript.
Table S5: TMT10 protein data for Ndt80 induction experiment, Related to Figure 5. TMT10 protein measurements for the experiment outlined in Fig. 5E and presented in Figs. 5F–5I.
Table S6: Label free quantification of matched extract to TMT10 experiment, Related to Figure 1. Analysis is included in Figures S1 and S3. Methodology for generating data is described in detail in the STAR Methods.
Table S7: Oligos used to synthesize Northern blotting probles. Related to Key Resources Table.
Table S8: TMT10 mixing scheme for main experimental replicates and Ndt80 experiment. Related to Tables S3, S5 and STAR Methods.
Highlights.
Parallel global measurements in meiosis reveal discordant mRNA and protein patterns
Toggling between mRNA isoforms due to alternate TSSes drives meiotic protein levels
Regulation of transcription and translation can be integrated rather than sequential
A single transcription factor can coordinately activate and repress gene expression
A single transcription factor can coordinate control of both up- and down-regulation of gene products through generation of alternative transcripts.
Acknowledgments
We thank A. Regev for generous support. We thank M. Rape, N. Ingolia, A. Amon, M. Eisen, E. Ünal, L. Chan, and C. Mugler for critical reading of this manuscript and members of the Brar and Ünal labs for helpful suggestions. We thank the Ünal and Van Werven labs for sharing data prior to publication and the Vincent Coates GSL for their help in sequencing. This work was supported by NIH funding to GAB (DP2-GM-119138), investigator awards from the Alfred P. Sloan Foundation and Pew Charitable Trusts and UC-Berkeley start-up funding to GAB. GMO is supported by an NIH training grant (GM0007232) to UCB. ENP is supported by an NSF predoctoral fellowship. MJ was supported by the Marie Sklodowska-Curie IOF and he and AK are supported by Columbia start-up funding. Additionally, work at the Broad Institute was supported by NIHGRI CEGS P50 HG006193, the Klarman Cell Observatory, and HHMI (to A. Regev). We apologize for limited citations due to space constraints.
Footnotes
Author Contributions:
G.A.B. and M.J. conceived most aspects of the study. Sequencing experiments were performed by ZC and GAB. Northern blotting and other experiments were performed by GMO and ENP. PM, SAC, AK, and MJ performed the protein mass spectrometry. Data analysis was performed by ZC, MJ, and GAB. Manuscript writing and editing was performed by ZC, GMO, MJ, and GAB.
Declaration of Interests:
The authors declare no competing interests.
Publisher's Disclaimer: This is a PDF file of an unedited manuscript that has been accepted for publication. As a service to our customers we are providing this early version of the manuscript. The manuscript will undergo copyediting, typesetting, and review of the resulting proof before it is published in its final citable form. Please note that during the production process errors may be discovered which could affect the content, and all legal disclaimers that apply to the journal pertain.
References
- Aanes H, Ostrup O, Andersen IS, Moen LF, Mathavan S, Collas P, Alestrom P. Differential transcript isoform usage pre- and post-zygotic genome activation in zebrafish. BMC Genomics. 2013;14:331. doi: 10.1186/1471-2164-14-331. [DOI] [PMC free article] [PubMed] [Google Scholar]
- Berchowitz LE, Gajadhar AS, van Werven FJ, De Rosa AA, Samoylova ML, Brar GA, Xu Y, Xiao C, Futcher B, Weissman JS, et al. A developmentally regulated translational control pathway establishes the meiotic chromosome segregation pattern. Genes Dev. 2013;27:2147–2163. doi: 10.1101/gad.224253.113. [DOI] [PMC free article] [PubMed] [Google Scholar]
- Berchowitz LE, Kabachinski G, Walker MR, Carlile TM, Gilbert WV, Schwartz TU, Amon A. Regulated Formation of an Amyloid-like Translational Repressor Governs Gametogenesis. Cell. 2015;163:406–418. doi: 10.1016/j.cell.2015.08.060. [DOI] [PMC free article] [PubMed] [Google Scholar]
- Blank HM, Perez R, He C, Maitra N, Metz R, Hill J, Lin Y, Johnson CD, Bankaitis VA, Kennedy BK, et al. Translational control of lipogenic enzymes in the cell cycle of synchronous, growing yeast cells. EMBO J. 2017;36:487–502. doi: 10.15252/embj.201695050. [DOI] [PMC free article] [PubMed] [Google Scholar]
- Brar GA, Yassour M, Friedman N, Regev A, Ingolia NT, Weissman JS. High-resolution view of the yeast meiotic program revealed by ribosome profiling. Science. 2012;335:552–557. doi: 10.1126/science.1215110. [DOI] [PMC free article] [PubMed] [Google Scholar]
- Buonomo SB, Clyne RK, Fuchs J, Loidl J, Uhlmann F, Nasmyth K. Disjunction of homologous chromosomes in meiosis I depends on proteolytic cleavage of the meiotic cohesin Rec8 by separin. Cell. 2000;103:387–398. doi: 10.1016/s0092-8674(00)00131-8. [DOI] [PubMed] [Google Scholar]
- Bussemaker HJ, Li H, Siggia ED. Regulatory element detection using correlation with expression. Nat Genet. 2001;27:167–171. doi: 10.1038/84792. [DOI] [PubMed] [Google Scholar]
- Cahoon CK, Hawley RS. Regulating the construction and demolition of the synaptonemal complex. Nat Struct Mol Biol. 2016;23:369–377. doi: 10.1038/nsmb.3208. [DOI] [PubMed] [Google Scholar]
- Carlile TM, Amon A. Meiosis I is established through division-specific translational control of a cyclin. Cell. 2008;133:280–291. doi: 10.1016/j.cell.2008.02.032. [DOI] [PMC free article] [PubMed] [Google Scholar]
- Chen J, Tresenrider A, Chia M, McSwiggen DT, Spedale G, Jorgensen V, Liao H, van Werven FJ, Unal E. Kinetochore inactivation by expression of a repressive mRNA. ELife. 2017;6 doi: 10.7554/eLife.27417. [DOI] [PMC free article] [PubMed] [Google Scholar]
- Chia M, Tresenrider A, Chen J, Spedale G, Jorgensen V, Unal E, van Werven FJ. Transcription of a 5′ extended mRNA isoform directs dynamic chromatin changes and interference of a downstream promoter. ELife. 2017;6 doi: 10.7554/eLife.27420. [DOI] [PMC free article] [PubMed] [Google Scholar]
- Chu S, Herskowitz I. Gametogenesis in Yeast Is Regulated by a Transcriptional Cascade Dependent on Ndt80. Mol Cell. 1998;1:685–696. doi: 10.1016/s1097-2765(00)80068-4. [DOI] [PubMed] [Google Scholar]
- Cox J, Mann M. MaxQuant enables high peptide identification rates, individualized p. p.b.-range mass accuracies and proteome-wide protein quantification. Nat Biotechnol. 2008;26:1367–1372. doi: 10.1038/nbt.1511. [DOI] [PubMed] [Google Scholar]
- Cox JS, Walter P. A novel mechanism for regulating activity of a transcription factor that controls the unfolded protein response. Cell. 1996;87:391–404. doi: 10.1016/s0092-8674(00)81360-4. [DOI] [PubMed] [Google Scholar]
- Duncan CDS, Mata J. The translational landscape of fission-yeast meiosis and sporulation. Nat Struct Mol Biol. 2014;21:641–647. doi: 10.1038/nsmb.2843. [DOI] [PMC free article] [PubMed] [Google Scholar]
- Floor SN, Doudna JA. Tunable protein synthesis by transcript isoforms in human cells. ELife. 2016;5 doi: 10.7554/eLife.10921. [DOI] [PMC free article] [PubMed] [Google Scholar]
- Hinnebusch AG. Gene-specific translational control of the yeast GCN4 gene by phosphorylation of eukaryotic initiation factor 2. Mol Microbiol. 1993;10:215–223. doi: 10.1111/j.1365-2958.1993.tb01947.x. [DOI] [PubMed] [Google Scholar]
- Hinnebusch AG, Ivanov IP, Sonenberg N. Translational control by 5′-untranslated regions of eukaryotic mRNAs. Science. 2016;352:1413–1416. doi: 10.1126/science.aad9868. [DOI] [PMC free article] [PubMed] [Google Scholar]
- Homann OR, Johnson AD. MochiView: versatile software for genome browsing and DNA motif analysis. BMC Biol. 2010;8:49. doi: 10.1186/1741-7007-8-49. [DOI] [PMC free article] [PubMed] [Google Scholar]
- de Hoon MJL, Imoto S, Nolan J, Miyano S. Open source clustering software. Bioinforma Oxf Engl. 2004;20:1453–1454. doi: 10.1093/bioinformatics/bth078. [DOI] [PubMed] [Google Scholar]
- Ingolia NT, Brar GA, Rouskin S, McGeachy AM, Weissman JS. The ribosome profiling strategy for monitoring translation in vivo by deep sequencing of ribosome-protected mRNA fragments. Nat Protoc. 2012;7:1534–1550. doi: 10.1038/nprot.2012.086. [DOI] [PMC free article] [PubMed] [Google Scholar]
- Ingolia NT, Brar GA, Stern-Ginossar N, Harris MS, Talhouarne GJS, Jackson SE, Wills MR, Weissman JS. Ribosome profiling reveals pervasive translation outside of annotated protein-coding genes. Cell Rep. 2014;8:1365–1379. doi: 10.1016/j.celrep.2014.07.045. [DOI] [PMC free article] [PubMed] [Google Scholar]
- Jovanovic M, Rooney MS, Mertins P, Przybylski D, Chevrier N, Satija R, Rodriguez EH, Fields AP, Schwartz S, Raychowdhury R, et al. Dynamic profiling of the protein life cycle in response to pathogens. Science. 2015;347:1259038–1259038. doi: 10.1126/science.1259038. [DOI] [PMC free article] [PubMed] [Google Scholar]
- Keshishian H, Burgess MW, Gillette MA, Mertins P, Clauser KR, Mani DR, Kuhn EW, Farrell LA, Gerszten RE, Carr SA. Multiplexed, Quantitative Workflow for Sensitive Biomarker Discovery in Plasma Yields Novel Candidates for Early Myocardial Injury. Mol Cell Proteomics MCP. 2015;14:2375–2393. doi: 10.1074/mcp.M114.046813. [DOI] [PMC free article] [PubMed] [Google Scholar]
- Kronja I, Yuan B, Eichhorn SW, Dzeyk K, Krijgsveld J, Bartel DP, Orr-Weaver TL. Widespread Changes in the Posttranscriptional Landscape at the Drosophila Oocyte-to-Embryo Transition. Cell Rep. 2014;7:1495–1508. doi: 10.1016/j.celrep.2014.05.002. [DOI] [PMC free article] [PubMed] [Google Scholar]
- Langmead B, Salzberg SL. Fast gapped-read alignment with Bowtie 2. Nat Methods. 2012;9:357–359. doi: 10.1038/nmeth.1923. [DOI] [PMC free article] [PubMed] [Google Scholar]
- Law DT, Segall J. The SPS100 gene of Saccharomyces cerevisiae is activated late in the sporulation process and contributes to spore wall maturation. Mol Cell Biol. 1988;8:912–922. doi: 10.1128/mcb.8.2.912. [DOI] [PMC free article] [PubMed] [Google Scholar]
- Law GL, Bickel KS, MacKay VL, Morris DR. The undertranslated transcriptome reveals widespread translational silencing by alternative 5′ transcript leaders. Genome Biol. 2005;6:R111. doi: 10.1186/gb-2005-6-13-r111. [DOI] [PMC free article] [PubMed] [Google Scholar]
- Liu Y, Beyer A, Aebersold R. On the Dependency of Cellular Protein Levels on mRNA Abundance. Cell. 2016;165:535–550. doi: 10.1016/j.cell.2016.03.014. [DOI] [PubMed] [Google Scholar]
- Lynn A, Soucek R, Borner GV. ZMM proteins during meiosis: Crossover artists at work. Chromosome Res. 2007;15:591–605. doi: 10.1007/s10577-007-1150-1. [DOI] [PubMed] [Google Scholar]
- Martens JA, Laprade L, Winston F. Intergenic transcription is required to repress the Saccharomyces cerevisiae SER3 gene. Nature. 2004;429:571–574. doi: 10.1038/nature02538. [DOI] [PubMed] [Google Scholar]
- Mertins P, Qiao JW, Patel J, Udeshi ND, Clauser KR, Mani DR, Burgess MW, Gillette MA, Jaffe JD, Carr SA. Integrated proteomic analysis of post-translational modifications by serial enrichment. Nat Methods. 2013;10:634–637. doi: 10.1038/nmeth.2518. [DOI] [PMC free article] [PubMed] [Google Scholar]
- Okaz E, Arguello-Miranda O, Bogdanova A, Vinod PK, Lipp JJ, Markova Z, Zagoriy I, Novak B, Zachariae W. Meiotic prophase requires proteolysis of M phase regulators mediated by the meiosis-specific APC/CAma1. Cell. 2012;151:603–618. doi: 10.1016/j.cell.2012.08.044. [DOI] [PubMed] [Google Scholar]
- Palam LR, Baird TD, Wek RC. Phosphorylation of eIF2 facilitates ribosomal bypass of an inhibitory upstream ORF to enhance CHOP translation. J Biol Chem. 2011;286:10939–10949. doi: 10.1074/jbc.M110.216093. [DOI] [PMC free article] [PubMed] [Google Scholar]
- Pelechano V, Wei W, Steinmetz LM. Extensive transcriptional heterogeneity revealed by isoform profiling. Nature. 2013;497:127–131. doi: 10.1038/nature12121. [DOI] [PMC free article] [PubMed] [Google Scholar]
- Peshkin L, Wuhr M, Pearl E, Haas W, Freeman RM, Gerhart JC, Klein AM, Horb M, Gygi SP, Kirschner MW. On the Relationship of Protein and mRNA Dynamics in Vertebrate Embryonic Development. Dev Cell. 2015;35:383–394. doi: 10.1016/j.devcel.2015.10.010. [DOI] [PMC free article] [PubMed] [Google Scholar]
- Prugar E, Burnett C, Chen X, Hollingsworth NM. Coordination of Double Strand Break Repair and Meiotic Progression in Yeast by a Mek1-Ndt80 Negative Feedback Loop. Genetics. 2017;206:497–512. doi: 10.1534/genetics.117.199703. [DOI] [PMC free article] [PubMed] [Google Scholar]
- Rappsilber J, Mann M, Ishihama Y. Protocol for micro-purification, enrichment, pre-fractionation and storage of peptides for proteomics using StageTips. Nat Protoc. 2007;2:1896–1906. doi: 10.1038/nprot.2007.261. [DOI] [PubMed] [Google Scholar]
- Rojas-Duran MF, Gilbert WV. Alternative transcription start site selection leads to large differences in translation activity in yeast. RNA N Y N. 2012;18:2299–2305. doi: 10.1261/rna.035865.112. [DOI] [PMC free article] [PubMed] [Google Scholar]
- Saldanha AJ. Java Treeview--extensible visualization of microarray data. Bioinforma Oxf Engl. 2004;20:3246–3248. doi: 10.1093/bioinformatics/bth349. [DOI] [PubMed] [Google Scholar]
- Sedgwick C, Rawluk M, Decesare J, Raithatha S, Wohlschlegel J, Semchuk P, Ellison M, Yates J, Stuart D. Saccharomyces cerevisiae Ime2 phosphorylates Sic1 at multiple PXS/T sites but is insufficient to trigger Sic1 degradation. Biochem J. 2006;399:151–160. doi: 10.1042/BJ20060363. [DOI] [PMC free article] [PubMed] [Google Scholar]
- Sourirajan A, Lichten M. Polo-like kinase Cdc5 drives exit from pachytene during budding yeast meiosis. Genes Dev. 2008;22:2627–2632. doi: 10.1101/gad.1711408. [DOI] [PMC free article] [PubMed] [Google Scholar]
- Subtelny AO, Eichhorn SW, Chen GR, Sive H, Bartel DP. Poly(A)-tail profiling reveals an embryonic switch in translational control. Nature. 2014;508:66–71. doi: 10.1038/nature13007. [DOI] [PMC free article] [PubMed] [Google Scholar]
- Tanenbaum ME, Stern-Ginossar N, Weissman JS, Vale RD. Regulation of mRNA translation during mitosis. ELife. 2015;4 doi: 10.7554/eLife.07957. [DOI] [PMC free article] [PubMed] [Google Scholar]
- Wang X, Hou J, Quedenau C, Chen W. Pervasive isoform-specific translational regulation via alternative transcription start sites in mammals. Mol Syst Biol. 2016;12:875. doi: 10.15252/msb.20166941. [DOI] [PMC free article] [PubMed] [Google Scholar]
- van Werven FJ, Neuert G, Hendrick N, Lardenois A, Buratowski S, van Oudenaarden A, Primig M, Amon A. Transcription of two long noncoding RNAs mediates mating-type control of gametogenesis in budding yeast. Cell. 2012;150:1170–1181. doi: 10.1016/j.cell.2012.06.049. [DOI] [PMC free article] [PubMed] [Google Scholar]
- Xie B, Horecka J, Chu A, Davis RW, Becker E, Primig M. Ndt80 activates the meiotic ORC1 transcript isoform and SMA2 via a bi-directional middle sporulation element in Saccharomyces cerevisiae. RNA Biol. 2016;13:772–782. doi: 10.1080/15476286.2016.1191738. [DOI] [PMC free article] [PubMed] [Google Scholar]
- Xu L, Ajimura M, Padmore R, Klein C, Kleckner N. NDT80, a meiosis-specific gene required for exit from pachytene in Saccharomyces cerevisiae. Mol Cell Biol. 1995;15:6572–6581. doi: 10.1128/mcb.15.12.6572. [DOI] [PMC free article] [PubMed] [Google Scholar]
- Zaslaver A, Mayo AE, Rosenberg R, Bashkin P, Sberro H, Tsalyuk M, Surette MG, Alon U. Just-in-time transcription program in metabolic pathways. Nat Genet. 2004;36:486–491. doi: 10.1038/ng1348. [DOI] [PubMed] [Google Scholar]
Associated Data
This section collects any data citations, data availability statements, or supplementary materials included in this article.
Supplementary Materials
Figure S1: Meiotic timecourse data were reproducible and showed expected patterns for well- studied genes, Related to Figure 1. A) and B) show counts of DAPI-based DNA morphology for timecourse replicate 1 and 2, respectively. 200 cells were counted per strain per timepoint for presence of a single DNA mass (mononucleate), two separated DNA masses (binucleate), or four separated DNA masses (tetranucleate). C) Full biological replicate measurements agree well for protein, mRNA, and ribosome footprints. In gray, a comparison of TMT10-based protein measurements for timecourse 1 and 2 are shown for each timepoint. In blue are similar plots for ribosome profiling samples, and in green, for mRNA-seq. R-values are to the bottom right of each graph. Each dot represents a single gene, genes are not filtered for any expression threshold. D) Mass spectrometry measurements made by independent label free quantification show high agreement with our original TMT10 measurements. All timepoints (except spores, for which sufficient material was unavailable) were subjected to mass spectrometry and label free quantification. The values for these measurements compared to TMT10 measurements for all genes that were quantified by both (n=1535) are shown in scatter plots. The TMT10 values represented in these plots are TMT based fractions of the total MS1 signal. E) An overview of the timecourse, with z-score normalization for the mRNA-seq (left), ribosome profiling (middle), and mass spectrometry (right). Plot includes all samples that were quantified by all three methods (n=4464 annotated genes). 523 proteins change by at least two-fold between 1.5 hours and 8 hours in sporulation media, a timeframe that contains no broad shift in cellular metabolism. When including all timepoints, including transitions between rich and sporulation media, more regulation is observed, with 2087 proteins that show relative changes of at least two-fold. F) Protein abundance trends for factors involved in homologous recombination and assembly of the synaptonemal complex (SC) confirmed known regulation for proteins that have well characterized regulation (Cahoon and Hawley, 2016; Lynn et al., 2007). SC assembly begins with chromosome axis formation on each new pair of replicated sister chromatids, mediated by Rec8 (as part of the meiotic cohesin complex), Hop1, and Red1. Zip1 next assembles between the axes to stabilize homolog interactions. These assembly steps occur with timing that overlaps the progression of recombination and influences its outcome, with Dmc1 as an important mediator of strand invasion of resected double-strand breaks to allow repair, and MutS proteins, Msh4 and Msh5, forming a heterodimer that is involved in resolving crossovers. The pattern of accumulation of all of these proteins fits well with the relative timing of these known functions, as does their disappearance. Polo kinase, Cdc5, is induced in late prophase, which results in phosphorylation and degradation of Red1 and Zip1 (Prugar et al., 2017; Sourirajan and Lichten, 2008). The rapid loss of Red1 and Zip1 seen in these data, relative to other factors, like Dmc1, is consistent with single-gene studies. G) Sps100, a component of the spore wall, is low at all timepoints except the one representing mature spores (Law and Segall, 1988). Sic1 degradation is required for meiotic DNA replication (Sedgwick et al., 2006). Its timing of protein decline matches the timing of meiotic DNA replication. Sporulation media (Spo) does not contain a fermentable carbon source and thus the oxidative phosphorylation machinery is upregulated. Consistently, mitochondrial proteins, including Cox1 and Cox2 of the electron transport chain, are seen to be high early in meiosis. H) The meiotic cohesin complex consists of Rec8, the heterodimer Smc1/Smc3, and Irr1. It loads onto the chromosomes during meiotic S-phase, and is stabilized by Pds5. We measure all components to have similar patterns of protein accumulation, but Rec8 disappears first, an expected result of protein degradation through the N-end rule pathway and separase-mediated cleavage, to trigger anaphase (Buonomo et al., 2000). I) Sps1 is known to be translated only after MI, despite high prior levels of mRNA, through a mechanism that involves silencing of SPS1 mRNA by its presence in aggregates of Rim4, which are disassembled as a result of phosphorylation by the meiotic CDK, Ime2 (Berchowitz et al., 2013, 2015). The protein level measurements for these factors match this known regulation remarkably well. J) We can identify known instances of translational control by comparison of mRNA and translation levels. In the case of HAC1, whose mRNA is high and constitutive but contains a cytoplasmically retained intron that prevents productive translation in the absence of Unfolded Protein Response activation, we observe translation during late MI and early MII, as we previously reported (Brar et al., 2012; Cox and Walter, 1996). K) Cdc5, or polo kinase, serves as a control, as it is not thought to be regulated translationally, but its transcription is driven by Ndt80 in late prophase. Consistently, we observe overlapping plots for mRNA and translation measurements, suggesting no or minimal translational control and, as also expected, protein measurements come up with similar timing as the other two. Cdc5 protein is known to be actively degraded by Ama1, and consistently, we see the levels decline rapidly after translation ceases (Okaz et al., 2012).
Table S1: Yeastmine Gene Ontology analysis using Holm-Bonferroni settings to search for cellular components enriched in the 2228 annotated genes for which we did not quantify protein levels by mass spectrometry, Related to Figure 1. Column one is GO Category, two is p-value, three lists associated genes, and four is GO identifier.
Table S2: A list of putative LUTIs annotated, Related to Figure 3. The first two columns are the gene name, third column is the Pearson correlation of mRNA (polyA) to protein over the full timecourse, fourth column is confirmation that there is a translated AUG-initiated uORF, fifth column is the category as represented in Fig. S3A, sixth column is the Pearson correlation between mRNA from total RNA seq and protein, seventh column is the status of neighboring transcription as outlined in Figure 6C.
Table S3: Matched mRNA, translation, and protein measurements through meiosis, Related to Figure 1. This spreadsheet includes the mass spectrometry data in L to CC columns. The set used for analyses throughout the manuscript are in columns BJ to BS and are described in detail in the STAR Methods. Matching footprint data is in columns CD to CM, mRNA (polyA selected) in CN to CW, and mRNA from total RNA sequencing in CX to DG. The values for mRNA seq and ribosome profiling are in RPKM and only counts over 10 raw reads are included.
Table S4: mRNA data for Ndt80 induction experiment, Related to Figure 5. mRNA-seq values (RPKM) for the experiment outlined in Fig. 5E and presented in Figs. 5D–5I.
Figure S2: Many genes show a poor mRNA to protein correlation, both generally and among the large set of targets of the transcription factor Ndt80, Related to Figure 2. A) Comparison of label-free protein quantification and mRNA-seq reveals a similar large subpopulation of genes showing anti-correlated trends between mRNA and protein over meiosis as seen when TMT10 data are used instead (compare to Fig. 2A). B) A histogram of the Pearson correlations between mRNA-seq for each timepoint from single round polyA selection and total RNA-seq. Note that the distribution is positive and does not show subpopulations. C) Average expression of mRNA from single round polyA selection versus correlation values from B). D) Average expression of mRNA from total RNA seq versus correlation values from B). E) A global view of transcript abundance in meiotic differentiation. Shown is the result of centroid hierarchical clustering of the ribosome profiling data for all genes (rows) quantified for mRNA abundance at all timepoints (columns). The total signal in each row is normalized to allow comparisons. The discrete cluster of genes that are thought to be Ndt80 targets are highlighted by a gray box at right. F, G) Promoters of genes identified as being Ndt80 targets based on mRNA abundance patterns are enriched for the Ndt80 binding site, or Middle Sporulation Element (MSE), regardless of protein concordance. F) Mochiview quantification of Ndt80 binding site cumulative enrichment upstream of Ndt80 targets identified from mRNA abundance patterns, genes in the aberrant clusters (noted in Fig. 2A), all Ndt80 targets, and a background set is shown. Note no enrichment in the aberrant Clusters for an unrelated meiotic transcription factor, Ime1. In both plots, p-values for difference of each query set from the background set are shown as dotted lines that depend on the motif score cutoff chosen. G) An unbiased motif search using Mochiview motif finder for upstream regions of Ndt80 targets (Fig. S2E; Fig. 2C) identified from mRNA abundance patterns revealed degenerate AT rich motifs, characteristic of intergenic regions, but only one other, specific motif, which closely matched the MSE. H) A histogram of Pearson correlation coefficients are plotted over all timepoints for the set of genes shown in Fig. 2C and 2D. Black bars represent the correlation coefficients for protein and mRNA for a given gene. Gray bars represent the correlation coefficients for mRNA of a given gene compared to mRNA for NDT80. I) The mean protein and mRNA levels over all timepoints are plotted for each gene, versus correlation coefficients (mRNA:protein) as shown in H. Colored dots represent known, well characterized targets of Ndt80. J) Known, robust translational regulation of SPS1 is subtle with the resolution of our timepoints. mRNA and ribosome profiling measurements are plotted relative to max values to allow comparison. SPS1 message is known to be translationally repressed for at least 1 hour after accumulation and a delay in the translation peak relative to the mRNA peak can be seen, but because timepoints are 1.5 hr-2hr apart, this effect appears more subtle than in previous studies with higher resolution timepoints.
Figure S3: Pipeline for identification of LUTI-based regulation reveals 380 robust cases, Related to Figure 3. A) A more detailed outline of approach in Fig. 3D. See STAR Methods for detailed description. B) TMT10 protein measurements for the 380 genes identified in the approach outlined in Fig. 3D as showing protein levels that are regulated by transcript toggling are shown, with hierarchical clustering performed on timecourse replicate 2 (left) and values from timecourse replicate 1 shown with rows matched at right. C) mRNA seq and ribosome profiling from the two timecourse replicates for four meiotic timepoints each were performed and comparison of these values in scatter plots is shown for each case for the 380 LUTI candidates. D) LUTI candidates show protein measurements with similar trends whether measurements are done by TMT10 or label free quantification. At left, the TMT10 values for timecourse replicate 2 are shown following hierarchical clustering of the 114/380 LUTI candidates that were quantified by both TMT10 and label free quantification over timecourse. At the right are values as measured by label free quantification.
Figure S4: New LUTI cases can be confirmed by robust alternate approaches, Related to Figures 4 and 6. A-H) Shown are independent meiotic timcourse replicates showing similar patterns for short and long transcripts detected in main Figs. 4 and 6. ORFs probed are: A) MED7 B) RRD2 C) POP4 D) RAD16 E) SHS1 F) POP7 G) RAD53 H) ORC3. Only one replicate is shown for ORC3, as the other is in Fig. S4O. ORC3 and POP7 replicates were run on the same gel and therefore methylene blue stain image is identical. Note that RAD53 replicate blots are from a different set of timecourses, using strains 14057 and 14407 and RNA from the experiment staged in P and V. I, J) Staging of additional replicate timecourses for Northern blotting. Categorization of DAPI morphology into either mononucleate, binucleate, or tetranucleate was performed for 200 cells at each timepoint. I) DAPI counting reflecting synchronous meiotic progression is shown for timecourse “red” and J) “blue”, used for blotting in Figure S2A–F, H. K–O) Northern blot confirmation of additional LUTI candidates highlighted in Fig. 4C. K) Comparison of levels and timing between Northern blots for the translocon component-encoding SSH1 ORF and the TE in matched samples shows evidence for a poorly translated long transcript as predicted by the mechanism in Figure 7. A similar analysis for L) UBC13, encoding an E2 ubiquitin-conjugating enzyme, M) YGP1, encoding a cell wall glycoprotein, N) CYC8, a general transcriptional repressor. O) ORC3, a component of the origin recognition complex. Note that due to limiting extract from the original timecourse, the ORC3 Northern blot was performed on extract from replicate “timecourse red”, staged in Fig. S2I. Meiotic progression, as judged by DAPI mass morphology, is shown for experiments presented in Fig. 4G, 4I, 4K, 4L, S4G. P) pPOP4-eGFP cells (14057) R) pRAD16-eGFP (14058) T) pSHS1-eGFP (14060) U) pSHS1∆prox-eGFP (14217) V) WT (14407) Q) Quantification of pPOP4-eGFP Western blot in Fig. 4G. S) Quantification of pRAD16-eGFP Western blot in Fig. 4I.
Figure S5: Ndt80 induces long, translationally inactive isoforms of POP7, MED7, and ORC3 and canonical transcript isoforms of CDC5, HRR25, and CYC8, Related to Figure 5. Staging for experiment shown in Fig. 5C-I by DAPI morphology without and with Ndt80 induction in A) and C), respectively and for spindle morphology by tubulin immunofluorescence in B) and D), respectively. Arrow indicates time of Ndt80 induction by addition of β-estradiol. E) Plots of log2(TE) for transcripts induced by Ndt80 in original timecourse data. Approximate time of Ndt80 activation is indicated by arrow. Note that canonical transcripts show stable or increased TE, while long undecodable isoforms show a drop in TE despite an increase in overall transcript level. F) This figure is the same as Fig. 5D, but with only the genes shown in G-L to allow direct comparison. Induction of Ndt80 results in increased mRNA abundance for canonical and non- canonical targets. Arrow indicates time of Ndt80 induction by addition of β-estradiol. Note that, although levels of transcript accumulation vary, both positive (canonical) and negative (LUTI- like) targets are induced with similar timing. Note that accumulation is dependent on Ndt80. G) Rapid induction of NDT80 mRNA can be seen within 15 minutes of addition of β-estradiol. H) CDC5, a canonical target is induced in an Ndt80-dependent manner within 30 minutes of addition of β-estradiol. I) A short (canonical) version of CYC8 is induced in an Ndt80-dependent manner. Note Ndt80-dependent TSS is at arrowhead and masked somewhat by longer transcript. Compare to Northern blot in Figs. 5A and 5C. J-L) Long uORF containing transcripts defined as LUTI-regulated by approach in Fig. 3D are induced between 30 minutes and 1 hour after addition of β-estradiol in an Ndt80 dependent manner. Compare to Northern blots in Figs. 5A and 5C.
Figure S6: A variety of neighboring transcript associations with LUTIs can be seen, Related to Figure 6. A) mRNA-seq data is shown for the BDF2/YET3 locus, revealing apparently coordinated divergent adjacent LUTIs. B) mRNA-seq data is shown for the PCM1/SOM1 locus, revealing apparently divergent adjacent LUTIs that show mutually exclusive LUTI transcription timing. C) mRNA-seq data is shown for the ORC1/SMA2 locus, highlighting LUTI regulation that is coordinated with transcription of a neighboring canonical transcript. D) mRNA-seq data is shown for the RPO41 locus, revealing apparently coordinated transcription of a divergent unannotated transcript. E) mRNA-seq data is shown for the YCL021W-A locus, revealing apparently coordinated transcription of a divergent unannotated transcript. F) mRNA-seq data is shown for the CFT2/AVL9 locus, revealing apparently coordinated divergent adjacent long transcripts. CFT2 shows hallmarks of LUTI-based regulation, including a poor correlation between protein and mRNA, while AVL9 shows an alternate transcript but no clear evidence that this affects translation of the AVL9 ORF. G-I) Trancription of meiosis-specific genes with spatio- temporal association with neighbors. G) Associated transcription between the MBA1 LUTI and canonical PCH2 transcript can be seen by mRNA-seq analysis. H) Associated transcription between the LIN1 LUTI and canonical REC104 transcript can be seen by mRNA-seq analysis. I) The Ndt80-induced PES4 transcript increases with timing and TSS position closely mirroring an unannotated transcript on the minus strand. An MSE is positioned at the point at which the two transcript 5’ ends meet.
Fig. S7: Additional LUTIs are likely to exist that were missed in our annotations due to poorly annotated AUG-initiated uORFs, Related to Figures 3 and 6. A) ADH1 shows a poor protein:mRNA correlation and Northern blotting reveals two transcripts, the longer of which is associated with a lower TE. B) An inverse correlation between upstream translation of a misannotated AUG-initiated uORF and ADH1 ORF translation can be seen from ribosome footprint data at this locus. Matching mRNA-seq data are above C) CTT1 shows a poor protein:mRNA correlation and Northern blotting reveals two transcripts, the longer of which is associated with a lower TE. D) mRNA seq data at the CTT1 locus is ambiguous due to low expression levels. It would be difficult from mRNA-seq alone to have predicted the short vegetative transcript or the mixed transcript pool at 8 hours. Matching ribosome profiling data are below. E) YOP1 shows a long alternate transcript with translated AUG uORFs, but it is not a LUTI. Northern blotting of YOP1 confirms a longer alternate transcript at this locus of the size predicted from mRNA-seq data, but we do not find a clear association between the relative ratios of the two YOP1 transcripts and the TE at this locus (above). Consistently, the correlation between mRNA and protein for YOP1 is strongly positive (below graph). F) mRNA-seq and ribosome footprint data at this locus suggest no negative association between translation of the AUG uORFs on the log transcript and the translation of the YOP1 ORF. G) Putative new cases of the type of regulation reported for SER3/SRG1. Positive strand mRNA-seq data for the LAS17 locus are shown. Here it appears that the transcript that is initiated distally terminates and therefore does not contain the LAS17 ORF. This type of regulation has been shown to result in decreased transcription from the one canonical TSS (Martens et al., 2004), but would not produce a LUTI transcript.
Table S5: TMT10 protein data for Ndt80 induction experiment, Related to Figure 5. TMT10 protein measurements for the experiment outlined in Fig. 5E and presented in Figs. 5F–5I.
Table S6: Label free quantification of matched extract to TMT10 experiment, Related to Figure 1. Analysis is included in Figures S1 and S3. Methodology for generating data is described in detail in the STAR Methods.
Table S7: Oligos used to synthesize Northern blotting probles. Related to Key Resources Table.
Table S8: TMT10 mixing scheme for main experimental replicates and Ndt80 experiment. Related to Tables S3, S5 and STAR Methods.