Abstract
Nanophosphors are promising contrast agents for deep tissue optical imaging applications because they can be excited by X-ray and near infrared light that penetrates deeply through tissue and generates almost no autofluorescence background in the tissue. For these bioimaging applications, the nanophosophors should ideally be small, monodispersed and brightly luminescent. However, most methods used to improve luminescence yield by annealing the particles to reduce crystal and surface defects (e.g. using flux or sintering agents) also cause particle fusion or require multiple component core-shell structures. Here, we report a novel method to prepare bright, uniformly sized X-ray nanophosphors (Gd2O2S:Eu or Tb) and upconversion nanophosphors (Y2O2S: Yb/Er, or Yb/Tm) with large crystal domain size without causing aggregation. A core-shell nanoparticle is formed, with NaF only in the core. We observe that increasing the NaF sintering agent concentration up to 7.6 mol% increases both crystal domain size and luminescence intensity (up to 40% of commercial microphosphors) without affecting the physical particticle diameter. Above 7.6 mol%, particle fusion is observed. The annealing is insensitive to the cation (Na+ or K+) but varies strongly with anion, with F−>Cl−>CO32−>Br−>I−. The luminescence depends strongly on crystal domain size. The data agree reasonably well with a simple domain surface quenching model, although the size-dependence suggests additional quenching mechanisms within small domains. The prepared bright nanophosphors were subsequently functionalized with PEG-folic acid to target MCF-7 breast cancer cells which overexpress folic acid receptors. Both X-ray and upconversion nanophosphors provided low background and bright luminescence which was imaged through 1 cm chicken breast tissue at a low dose of nanophosphors 200 µL (0.1 mg/mL). We anticipate these highly monodispersed and bright X-ray and upconversion nanophosphors will have significant potential for tumor targeted imaging.
Graphical abstract
Introduction
Non-invasively detecting optical labels and sensors through tissue is a challenge because tissue absorption and scattering attenuate the probe signal, while autofluorescence background from tissue can obscure the signal. To address these issues, several types of nanoparticle labels have been developed that generate relatively deeply penetrating optical signals with low tissue backgrounds, including: red and near infrared-exciting fluorescent quantum dots,1, 2 chemiluminescence sensors,3 surface enhanced spatially offset Raman spectroscopy (SESORS) with near infrared lasers,4 photoacoustic “sonophores,”5 radioluminescence from scintillation proximity assays,6 near infrared excited upconversion phosphors,7–13 and X-ray excited nanophosphors.14–16 Each approach had advantages and limitations. In general, X-ray scintillators are advantageous for high resolution imaging because they can be localized in the tissue using a narrow X-ray beam to excite only the phosphors within the beam.16–25 The optical signal acquired through tissue depends upon X-ray dose, voxel size, transmittance of X-ray and visible/near infrared light through the tissue, optical collection efficiency, nanoparticle concentration and quantum efficiency; Compared to micro-computed tomography (CT), lower doses usually are needed for the same S/N through up to a few centimetres of tissue because the scintillators provide a positive signal against a low background instead of small signal loss against a bright background in CT.18, 26–28 Upconversion nanophosphors have the advantage of using non-ionizing near-infrared light so they can generate bright luminescence signals over a long time without harming the tissue, but can only be imaged at diffraction-limited resolution through superficial layers of tissue <~1 mm where ballistic photons can propagate29; through thicker tissue, diffuse photon scattering reduces the resolution to approximately the depth of the sample in the tissue.30, 31 Both types of nanophosphors are hindered by low quantum yields compared to bulk material due to quenching from surfaces and crystal defects.32–34
Gadolinium oxysufide (GOS)-based X-ray phosphors and ytterbium oxysufide (YOS)-based up-conversion phosphors are widely used for radioluminesence and upconverison luminescence, respectively, due to their intense luminescence (60,000 photos/MeV X-ray in bulk GOS),18 the large optical penetration depth of their excitation and red/near infrared emission, and the low tissue autofluorescence background generated by X-ray irradiation and near infrared excitation, respectively. These phosphors are also useful for fluorescence microscopy due to their narrow and distinct excitation and emission peaks, excellent photostability, and low toxicity.14, 16–18, 35, 36 When relatively large and bright phosphors are needed, e.g. for X-ray scintillator screens and electroluminescent lighting applications, GOS and YOS microparticles are usually synthesized using a solid state flux fusion method which requires calcination of gadolinium oxide or ytterbium oxide with doping materials, sulphur powder, and a flux material (e.g., Na2CO3 or boric acid) under inert atmosphere (e.g., N2 or Ar), typically at over 1400 °C.35–37 The flux materials serve as a solvent for crystal growth, dissolving and re-precipitating ions on the surface of the crystal to increase the crystal domain size and decrease the density of surface defects in the particles. However, this traditional method usually produces micrometer or larger phosphors35–37, which are too large for many bio-imaging applications. Alternatively, phosphor particles can be sintered at lower temperatures, especially with aid of sintering agents, which causes the particles to fuse by diffusion of ions on the surface, and also increases brightness by annealing the crystal domains.38, 39 Surfactants cannot keep the particles apart because they decompose or combust at high temperature. Unfortunately, large fused particles are inappropriate for many biomedical applications.
Smaller GOS and YOS nanophosphors, appropriate for biomedical applications can be produced via precipitation of Gd3+ or Y3+ in aqueous solution by decomposition of urea; the obtained precursor is then calcined and subsequently reacts with sulphur.14, 40 This method generates nanophosphors with well-controlled sizes. However, these nanophosphors are less bright than phosphors fabricated by sintering methods (more details below). Although the addition of a sintering agent can increase the luminescence intensity of the nanophosphors, it also causes the nanophosphors to aggregate and fuse into irregularly shaped microparticles. Nanophosphor luminescence can also be increased by encapsulating the nanoparticle within a shell material with closely matching lattice constant such as CaF2 over NaYF4 in order to passivate the surface defects.41, 42 However, such multicomponent materials can be complex to characterize, especially in biological systems and CaF2 can be difficult to functionalize without additional shells.43 Thus, the synthesis of brighter X-ray and up-conversion nanophosphors remains a significant challenge.
In this paper, we designed a protective shell for preparing X-ray and upconversion nanophosphors. This protective shell confines the sintering agents within the particle core to improve the crystal domain size and luminescence intensity of nanophosphors without causing particle aggregation and fusion. This strategy dramatically enhances the luminescence (> 10 times) for both X-ray and up-conversion phosphors without any aggregation. In contrast to traditional method requiring high temperatures (~1400 °C), only moderate reaction temperatures of calcination (600 °C) and sulfidation (700 °C) are necessary for the nanophosphor preparation. To show the advantages of the nanophosphors prepared with protective shell over nanophosphors traditionally prepared, these bright nanophosphors were subsequently functionalized with PEG-folic acid to target MCF-7 breast cancer cells. Both X-ray and upconversion nanophosphors provided low background and bright luminescence which was imaged through 1 cm chicken breast tissue with a low dose of 200 µL (0.1 mg/mL).
Results and discussion
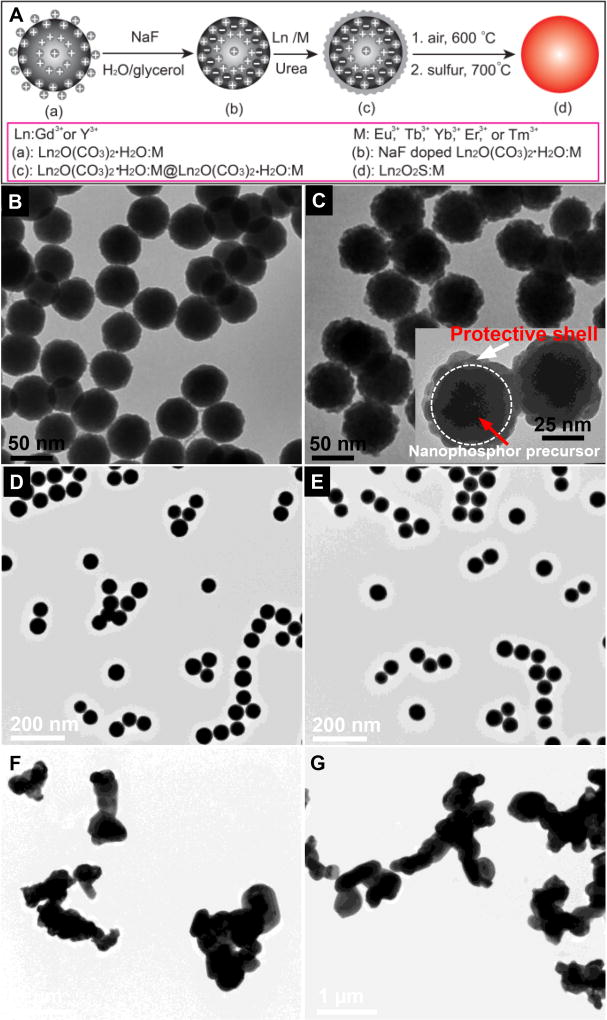
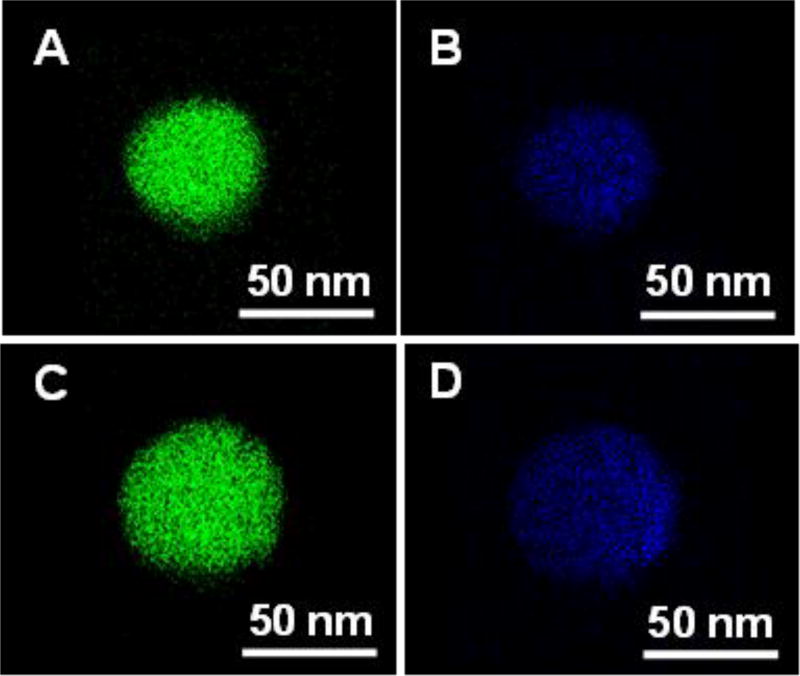
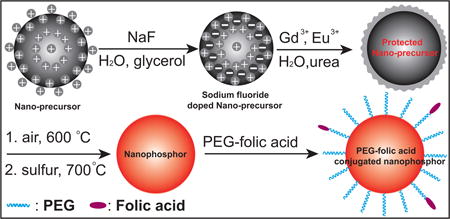
In order to synthesize the GOS X-ray nanophosphors, a monodispersed nanophosphor precursor (Gd2O(CO3)2•H2O:Eu) was first prepared in aqueous solution through co-precipitation of gadolinium and europium nitrate during decomposition of urea at 80 °C (Figure 1A); more details are given in the Experimental Section. NaF was encapsulated in the crystalized precursor to serve as a sintering agent by mixing NaF into the nanophosphor colloid in water/glycerol (v/v=1:2) solution, and heating to remove the water, incorporate the NaF, and crystalize the particles. The particles were then collected by centrifugation at 10,000 rpm (RCF = 15,316 × g) and washed in distilled water to remove the glycerol and free NaF. The NaF-encapsulated phosphor precursor nanoparticles were monodispersed and approximately spherical (see TEM image 1A), and had a mean diameter of 55±5 nm. High resolution EDX elemental analysis showed that fluorine from NaF was uniformly distributed through the phosphor precursor (Figure 2A, 2B). The XRD spectra of the NaF-encapsulated and unmodified precursors indicate the material has the crystal phase of Gd2O(CO3)2•H2O:Eu44 with no significant differences in crystal structure or peak widths (Figure S1, ESI). The X-ray diffraction (XRD) peak widths indicate essentially unchanged crystal domain size with and without NaF (43 nm and 44 nm, respectively) according to the Scherrer equation. However, the NaF significantly reduced the surface charge: The zeta potential of the precursor decreased from +102 mV before NaF encapsulation to +7 mV. The large positive initial surface charge is expected to inhibit particle aggregation and fusion, while encapsulation of NaF shields the surface charge and is expected to increase ion diffusion rates, especially at the surface. Indeed, during calcination at 600 °C and sulfidation with sulfur gas at 700 °C, the NaF-encapsulated particles aggregated and fused into larger irregular crystalline microparticles (Figure 1F and 1G). Although this NaF treatment increased the phosphor luminescence intensity, the resulting fused microparticles would be too large for most biological sensing and imaging applications.
Figure 1.
(A) Schematic showing the synthesis route for bright X-ray and up-conversion nanophosphors with NaF sintering agent in a protective shell, (B) TEM image of NaF-encapsulated Gd2O(CO3)2•H2O:Eu, (C) TEM image of 10 nm thick protective shell consisting of Gd2O(CO3)2•H2O:Eu on NaF-encapsulated nanophosphor precursor (Gd2O(CO3)2•H2O:Eu) (i.e. NaF-doped Gd2O(CO3)2•H2O:Eu@Gd2O(CO3)2•H2O:Eu). Inset figure: magnified TEM image; white dashed line indicates interface between calcined nanophosphor precursor and new protective shell, (D) TEM image of NaF-encapsulated Gd2O2S:Eu nanophosphors within protective shells, (E) TEM image of NaF-encapsulated Y2O2S:Yb/Er nanophosphors within protective shells, (F) TEM image of NaF-doped Gd2O2S:Eu without protective shells, (G) TEM image of NaF-doped Y2O2S:Yb/Er without protective shells.
Figure 2.
High resolution EDX elemental analysis of gadolinium and fluorine distribution in Gd2O(CO3)2•H2O nanophosphor precursors and Gd2O2S:Eu nanophosphors. (A) Gadolinium distribution in NaF-doped Gd2O(CO3)2•H2O:Eu, (B) Fluorine distribution in NaF-doped Gd2O(CO3)2•H2O:Eu, (C) Gadolinium distribution in NaF-doped Gd2O2S:Eu, (D) Fluorine distribution in NaF-doped Gd2O2S:Eu.
To prevent this nanophosphor aggregation and fusion, a protective shell consisting of a ~10 nm thick amorphous precursor (Gd2O(CO3)2•H2O:Eu) was coated on the smooth surface of the NaF-doped precursor. The rough protective shell is evident in the TEM image (Figure 1C including magnified inset), and appears different from the core (less dense and rougher) because unlike the core it was not calcined at 150 °C. After coating by the protective shell, the particle diameter increased from 55±5 nm to 75±6 nm and the zeta potential of the precursor rose from +7 mV to +90 mV. After calcination and sulfidation, the resulting Gd2O2S:Eu nanoparticles were smooth, spherical, and relatively monodispersed (TEM image in Figure 1D and higher magnification images in Figure S2, ESI). Although the particles size shrunk from 75± 5 nm to 61± 5 nm during calcination and sulfidation the particle did not fuse (Figure 2C, 2D). The protective shell itself cannot be distinguished from the core by either TEM image (Figure 1D, 1E) or X-ray powder diffraction spectra (Figure 7B, 7D) which indicates that the particles have a homogeneous material composition. The approach is highly flexible: by changing the doping ions and host material, but otherwise following the same synthesis route, monodispersed X-ray nanophosphors with red emission (Gd2O2S:Eu) and green emission (Gd2O2S:Tb), as well as up-conversion nanophosphors with red (Y2O2S:Yb/Er) and near IR (Y2O2S:Yb/Tm) emission can be obtained (Figure 1D, 1E, and Figure S2, ESI).
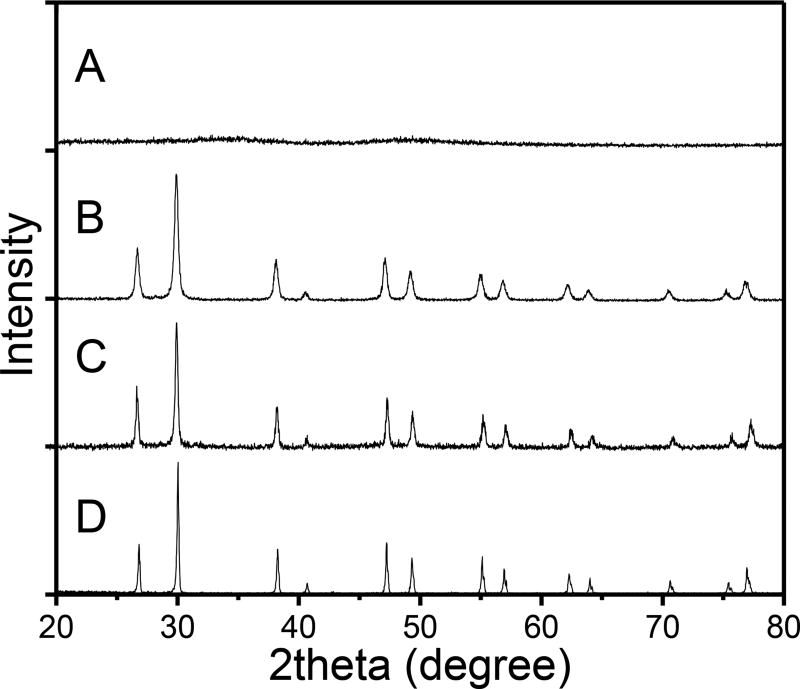
Figure 7.
XRD powder patterns of: (A) amorphous Gd2O(CO3)2•H2O:Euprecursor of the X-ray phosphors; (B) Gd2O2S:Eu; (C) 7.6 mol% NaBr-doped Gd2O2S:Eu, (D) 7.6 mol% NaF-doped Gd2O2S:Eu.
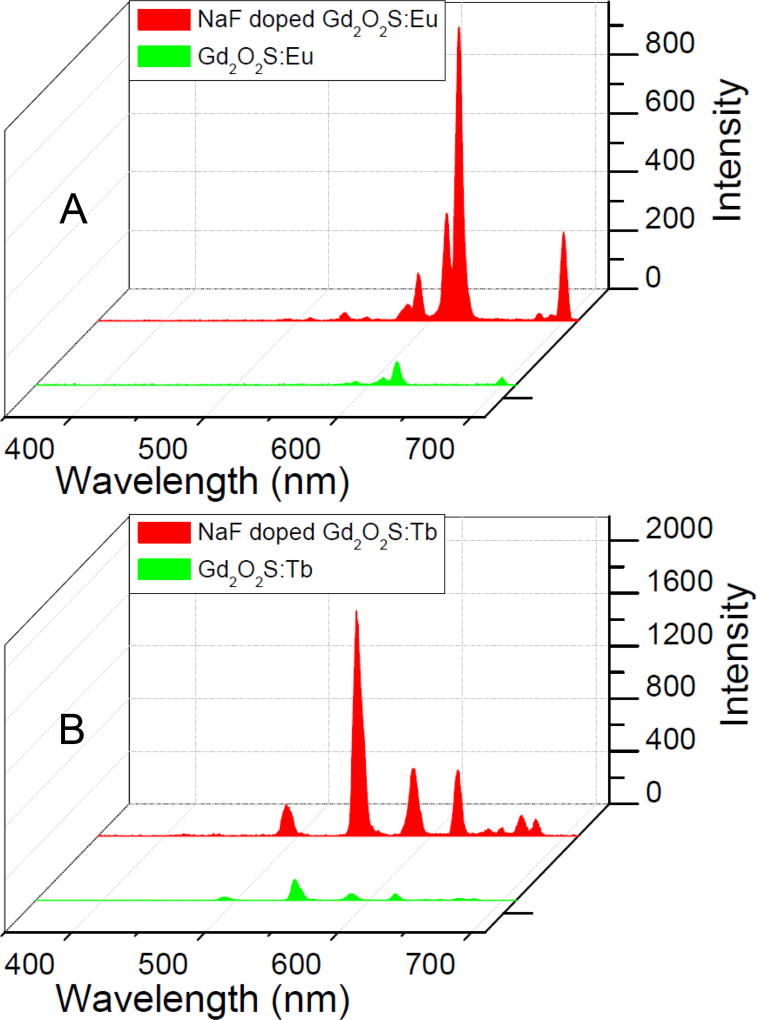
Figure 3 shows the X-ray excited optical luminescence spectra of 7.6 mol% NaF doped Gd2O2S:Eu and Gd2O2S:Tb as well as controls without NaF doping. The mechanism of radioluminescence involves the generation of electron-hole pairs in the host lattice following X-ray absorption. These electron-hole pairs then excite Eu3+ and Tb3+ centers which emit visible and near infrared light. The narrow luminescent peaks of Gd2O2S:Eu are attributed to the transitions 5D0,1→7FJ (J=0, 1, 2, 4) of the Eu3+ ions generate the intense peak at 590, 612, 620, 720 nm. The strongest red emission which splits into two peaks at 621 and 612 nm arises from the forced electric-dipole 5D0→7F2 transitions of the Eu3+ ions. The strong luminescence peaks in the Tb-doped nanophosphors are attributed from the 5D4 excited-state to the 7FJ (J=6, 5, 4, 3, 2, 1, 0) ground states of the Tb3+ ion. The 5D4→7F5 transition at 544 nm is the most prominent group. The spectral shape is similar for both NaF-doped and undoped particles, but the NaF doping increases the intensity for the most intense peak (620 nm for Gd2O2S:Eu, and 544 nm for Gd2O2S:Tb) by a factor 12.5 and 11, respectively. Compared to commercial X-ray microphosphors from Phosphor Technologies Ltd with a photon yeild reported to be similar to the bulk value of 60,000 photons/MeV X-ray,45 the NaF-doped nanophosphors produce about a third as much light at equal concentrations, although they are ~150 fold smaller in diameter (Figure S3, Supporting Information).
Figure 3.
X-ray excited luminescence spectra of (A) Gd2O2S:Eu (1 mg/mL) with and without 7.6 mol% NaF, (B) Gd2O2S:Tb (1 mg/mL) with and without 7.6 mol% NaF. Note: all nanophosphors shown contain identical activator concentration (i.e., 2.5 mol % of either Eu3+ or Tb3+).
Under blue excitation (460–495 nm) the nanophosphors fluoresce with an emission spectrum similar to the X-ray excited optical luminescence. Doping with NaF increases the fluorescence intensity by a factor of 2.0 for Gd2O2S:Eu and 2.1 times for Gd2O2S:Tb. Compared to X-ray excitation, blue light does not penetrate as deeply into tissue, and unlike X-rays, does not stay collimated or focused which dramatically reduces image resolution. The luminescence enhancement is greater in X-ray and upconversion luminescence than in fluorescence, likely because crystal defects affect the non-radiative decay rate of several intermediate excited states in these multiphoton down-conversion and upconversion processes.
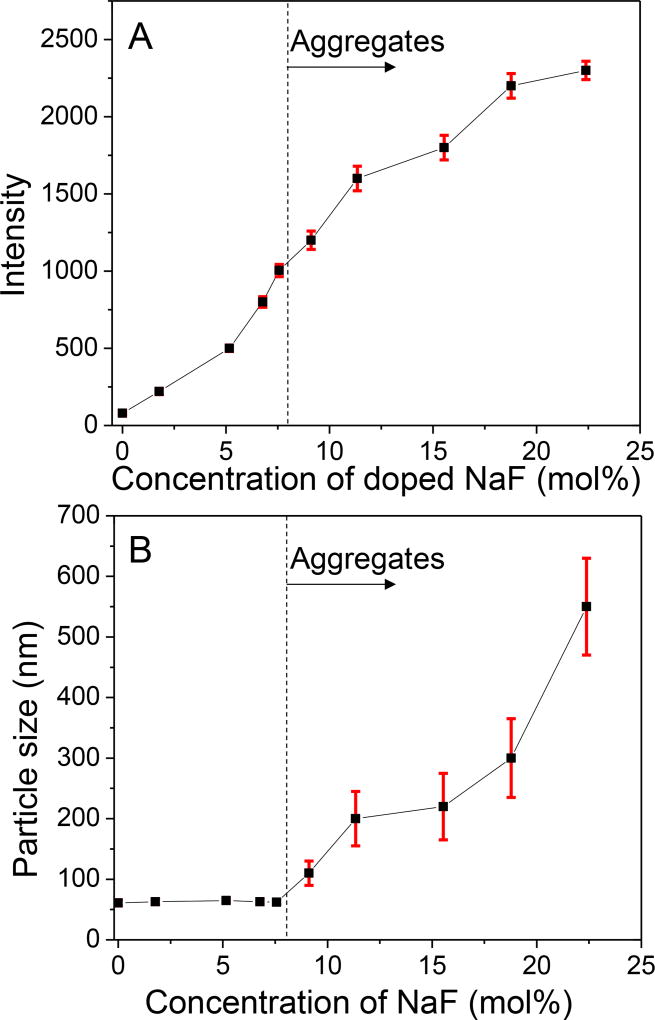
We next studied how the concentration of NaF in the protective shell affected the luminescence intensity, particle size measured by TEM, and crystal domain size. The NaF concentration was determined by dissolving the final product in HNO3 and measuring the fluoride concentration with a fluoride electrode using standard addition. Figure 4A shows how luminescence of Gd2O2S:Eu nanophosphors at 620 nm increased with NaF concentration (0–22 mol%). The luminescence enhancement reached a maximum when 22 mol% NaF was doped into the phosphors (~30 fold brighter than without any NaF). Above this concentration, luminescence decreased with increasing NaF concentration (Figure S5, ESI). As shown in Figure 4B, the NaF doping concentration strongly affects the particle size. Within a range of 0─7.6 mol% NaF doping, the protective shell consisting of 10 nm phosphor shell around the phosphors effectively prevented aggregation. However, phosphor aggregation was observed when the NaF-doping concentration increased to over 7.6 mol%. This aggregation at high concentrations of NaF was also observed in the phosphors with Y2O2S as the host material, which suggested the 10 nm thick protective shell cannot maintain the particle size under high concentration of sintering agents. The maximum NaF concentration which avoids aggregation depends upon the coating thickness. We found that by increasing the protective shell thickness from 10 nm to 20 nm protected particles from aggregating for NaF doping concentration as high as 18.8 mol%. However, increasing the protective shell thickness also increased the overall particle diameter. To enhance luminescence without causing aggregation and obtain nanophosphors with minimal overall size, we therefore set 7.6 mol% NaF in 10 nm thick protective shell to prepare Gd2O2S and Y2O2S based nanophosphors.
Figure 4.
(A) Effect of NaF-doping concentration on X-ray excited optical luminescence intensity at 620 nm for Gd2O2S:Eu nanophosphors. (B) Effect of NaF-doping concentration on particle size. Luminescence intensity increases with NaF concentration up to 22 mol%, while the TEM-indicated particle size is constant up to 7.6 mol% and then increases due to particle aggregation and fusion.
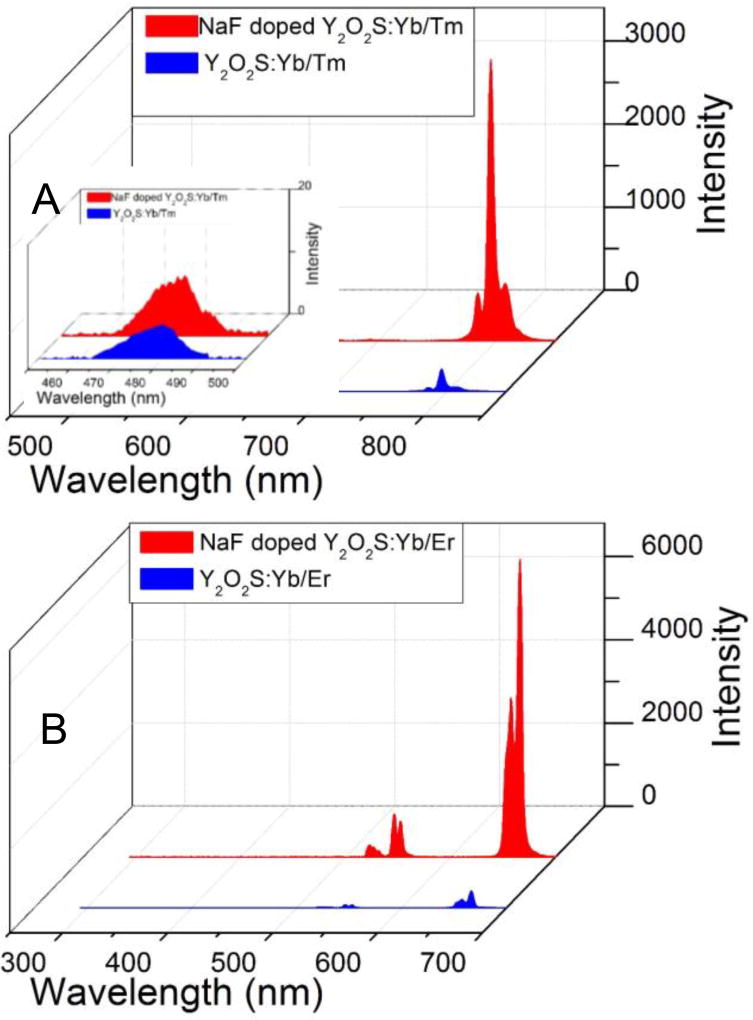
In addition to radioluminescent GOS-based phosphors, we also synthesized upconvertion YOS-based phosphors using NaF doping in a 10 nm thick protective shell. The method was the same except for replacing the Gd(NO3)3 with Y(NO3)3, and using Yb/Er as upconversion sensitizers and activators, respectively. The YOS upconversion nanophosphors emit intense light at excitation of 980 nm under 500 mW (Figure 5). The main emission peaks of the 7.6 mol% NaF-doped Y2O2S:Yb/Er were found at 537 and 654 nm, which were assigned to the transition 4S3/2→4I15/2 and 4F9/2→4I15/2 of Er3+, respectively. The Yb/Tm doped nanophosphors (Y2O2S:Yb/Tm) displayed a weak peak at 478 nm corresponding to 1G4→3H6 and very bright light at 800 nm which was corresponded to the 3H4→3H6 transition of Tm3+. The spectral shape is similar for both NaF doped and undoped nanophosphors, but the NaF doping increases the intensity for the most intense peak (654 nm for Y2O2S:Yb/Er, and 800 nm for Y2O2S:Yb/Tm) increased by a factor 19 and 12, respectively. The enhanced upconversion luminescence intensity is also close to (a third of) that of the ~70 fold larger commercial upconversion microphosphors at equal concentrations (Figure S6, Supporting Information).
Figure 5.
Upconversion luminescence spectra (980 nm excitation) for (A) Y2O2S:Yb/Er (0.25 mg/mL) with and without doping 7.6 mol% NaF; the inserted figure shows the upconversion luminescence spectra at 478 nm. (B) Y2O2S:Yb/Er (0.25 mg/mL) with and without doping 7.6 mol% NaF.
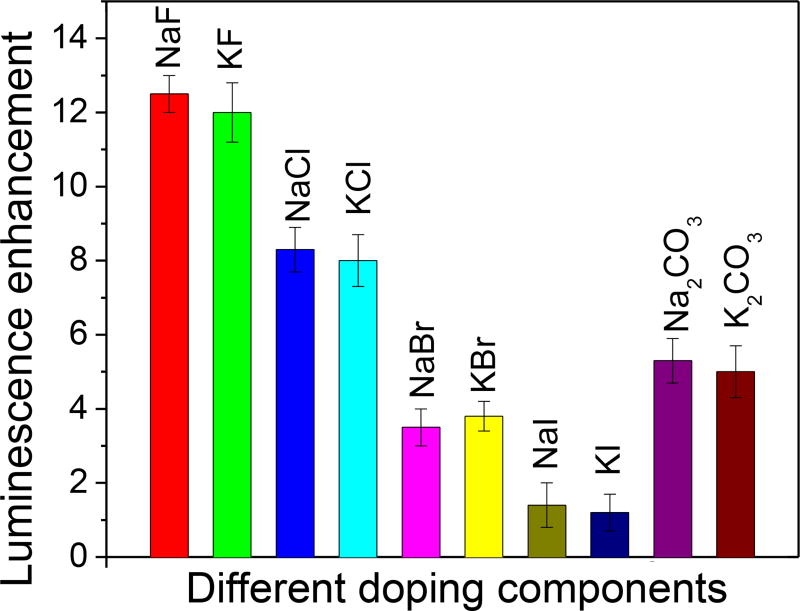
To clarify the role of doping on the nanophosphor luminescence enhancement, several types of sintering agent with different anions and cations were doped into Gd2O2S:Eu nanophosphors (Figure 6). The luminescence enhancement strongly depended on the sintering agent anions (i.e., F− > Cl− > CO32−> Br− > I−). These results were consistent with Nakamura and co-workers data on the effect of halides on Gd2O2S:Pr particles sintered into a plate under pressure and at 1300 °C.46 We observed no significant difference between K+ and Na+ cations, regardless of which anion was used. Among the different sintering agents, NaF and KF generated the largest crystal domains (44–45 nm) and greatest luminescence enhancement (~12), see Table S1 in ESI. There is a strong correlation between the luminescence enhancement and crystal domain size (measured by the XRD peak width, see below). This is consistent with other work showing that nanophosphors with larger crystal domains are brighter due to less quenching from surface defects and reduced point defect density during annealing processes that grow crystal domains.47–49 Fluoride ions may be most effective at increasing crystal domain size because of their small size (ion radius 1.33 Å) and similarity to the oxygen ion radius (ion radius 1.32 Å), which can be substitutional ions for oxygen ions to compensate the defects in the nanocrystals. 46
Figure 6.
Effect of sintering material on X-ray excited optical luminescence intensity at 620 nm for Gd2O2S:Eu doped with different sintering agents at a molar concentration of 7.6 mol% for NaF, KF, NaCl, NaBr, KBr, NaI, KI, and 9.3 mol% for Na2CO3, and K2CO3. Luminescence enhancement is defined as intensity at 620 nm for the given sintering agent divided by the intensity with no sintering agent.
Since luminescence in nanophosphors is quenched by crystal surface defects in domain boundaries, we next studied how NaF doping concentration affects crystal domain size. Figure 7 shows the XRD pattern for the Gd2O2S:Eu nanophosphors with 7.6 mol% NaBr (Figure 7C), 7.6 mol% NaF (Figure 7D) doping and without any sintering agent doping (Figure 7B), as well as the amorphous Gd2O(CO3)2 precursor particles with no diffraction peaks (Figure 7A). The (Gd2O2S:Eu) spectra are well indexed to the pure hexagonal phase crystals, and the peak width clearly narrows after doping. The mean size of the crystalline domains of obtained nanophosphors can be calculated by Scherrer equation:
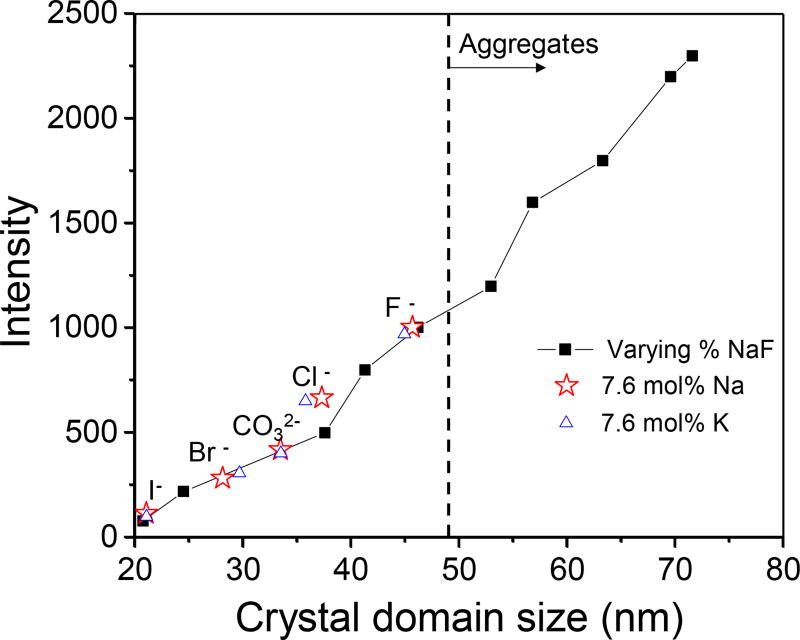
Where D is the mean size of the crystalline domains, K is a dimensionless shape factor, this shape factor has a typical value of about 0.90, λ is X-ray wavelength (0.154 nm), β1 is the line broadening, full width at half the maximum intensity (FWHM), due to finite grain size, β2 is the FWHM broadening due to instrumental effects and dispersion of Cu Kα1 and K α2 lines (0.10 degrees in our case), and θ is the Bragg angle. Figure 8 shows how nanophosphor luminescence intensity relates to crystal domain size for particles formed with different NaF concentrations (0–22 mol%). Although the intensity increases with domain size, at >7.6 mol% NaF (46 nm domain size), the particles aggregated and fused (see Figure 4).
Figure 8.
Comparison of crystal domain f to X-ray excited optical luminescence intensity at 620 nm for Gd2O2S:Eu nanophosphors. The crystal domain size was varied by controlling NaF concentration (diamonds) or using 7.6 mol% but varying the cation (Na or K) and anion (I−, Br−, Cl−, F−, or CO32−).
The mean nanophosphor physical diameter (measured by TEM) and size of the crystalline domains (measured by XRD) of X-ray and up-conversion nanophosphors are listed in Table 1. The mean physical diameter was highly consistent between these different nanophosphor syntheses (61.1 nm ±1.7 nm). However, doping 7.6 mol% NaF into the nanophosphors increased the crystal domain size by a factor of ~2.2, from 21±2 nm to 46±5 nm. The NaF-doping within a protective shell increases the crystal domain size, which dramatically enhances the luminescence of the X-ray or up-conversion nanophosphors. No obvious change of percentage of crystallinity was found after the NaF doping. Both the doped and undoped nanocrystals have over 90% crystallinity. We also replotted the data for different dopant materials (Figure 8) on the same plot, and noted that crystal domain size can account for most of the observed differences in luminescence.
Table 1.
Domain size for different types of nanophosphors with and without NaF doping
| Particles | NaF (mol%) |
TEM diameter (nm) |
XRD Domain size (nm) |
|
|---|---|---|---|---|
| X-ray | Gd2O2S:Eu | 0 | 61±5 | 21±2 |
|
| ||||
| 7.6 | 60±6 | 46±5 | ||
|
| ||||
| Gd2O2S:Tb | 0 | 63±5 | 20±2 | |
|
| ||||
| 7.6 | 60±5 | 44±3 | ||
|
| ||||
| UC | Y2O2S:Yb/Er | 0 | 62±6 | 20 ±2 |
|
| ||||
| 7.6 | 64±5 | 38±4 | ||
|
| ||||
| Y2O2S:Yb/Tm | 0 | 60±5 | 17±2 | |
|
| ||||
| 7.6 | 59±5 | 40±2 | ||
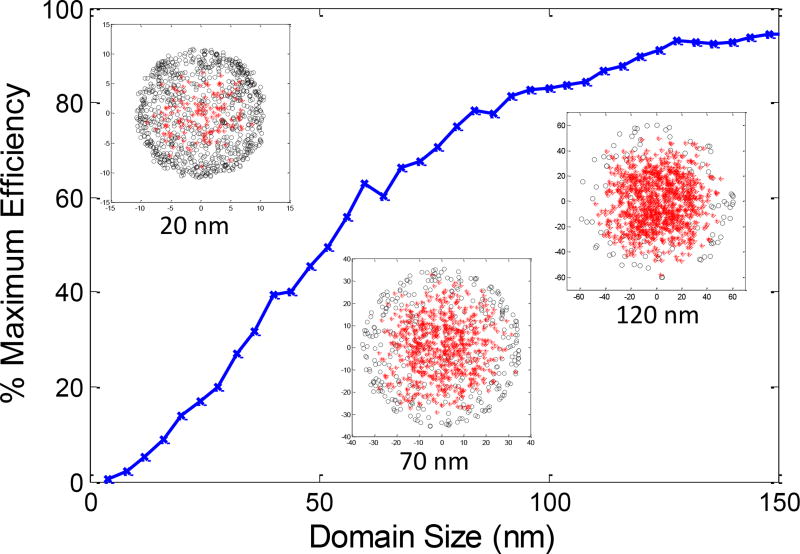
Crystal defects, domain boundaries, and surface sites can quench phosphor luminescence. To see whether a domain boundary quenching model generally agrees with the observed relationship between luminescence and crystal domain-size, we ran a crude Monte Carlos computer simulation. An electron-hole pair was randomly placed within a spherical crystal domain and at each time step, it diffused 1 nm in a random direction within the domain. The electron hole pair eventually decays by either intrinsic radiative/non-radiative decay processes within the crystal (a constant probability for decay at each step with an overall 14 nm ambipolar diffusion length,50 or by recombination (surface quenching) if it reaches the domain surface. The ambipolar diffusion length depends on both the total decay from both radiative and non-radiative processes in the bulk and is shorter when radiative decay is higher due to high activator concentration. For example, Benetez and co-workers experimentally measured the diffusion length to be 21 nm for Gd2O2S:Tb with 0.3% Tb and 14 nm for 0.8% Tb.50 One thousand electron-hole pairs were simulated, and their final position and fate (decay within the particle or surface recombination) was recorded.
Figure 9 shows how the luminescence depends upon crystal domain size according to the Monte Carlos simulations. The inset figures show the results from specific domain sizes: red asterisks correspond to normal decay within the spherical crystal domain (due to radiative or non-radiative decay), while black circles correspond to domain surface quenching. Small domains have significant quenching at their surface, which decreases as the crystal domain grows, with efficiency asymptotically approaching 100% of bulk. Both the shape of the curve and the efficiency values are in general agreement with the experimental data in Figure 8 for intermediate domain sizes, however, there are some differences, especially for small domains. For example, experimentally, nanoparticles with 7.6 mol% NaF (46 nm crystal domains) are 39% as bright as the commercial microphosphors (Figure S3), in agreement with the simulation (showing 44% of bulk, and 40% of microphosphors if the microphosphors are 90% of bulk). For larger domains, the experimental results are somewhat larger than expected from simulation (e.g., for the largest aggregated particles with 72 nm domains, the simulation estimates 69% efficiency, while experiments are close to 90% of commercial microphosphors and the curve does not yet show signs of saturation). Finally, for the smallest domains (nanophosphors without sintering agent, with 21 nm domains), the simulation predicts 15% efficiency, while experimental results are only 3%.
Figure 9.
Simulated effect of surface quenching on luminescence as a function of particle domain size, for diffusion length of 14 nm. Insets show location normal radiative and non-radiative decay events (red asterisk) or surface quenching events (black circles) for three cases (20 nm, 70 nm, and 120 nm grain diameters).
We used 14 nm for diffusion length based on published data50, rather than fitting the data directly. However, adjusting the diffusion length would either improve the fit for large domains or small domains, but not both. The results therefore suggest that an additional mechanism causes more quenching for particles with small domains (e.g., defects within the crystal which disappear when the crystal domain size increase, or quenching effects which extend more than 1 nm from the domain edge). We note that the simulation is quite crude for example, domains cannot all be spherical and other shapes generally reduce the distance to the nearest domain increasing quenching rate. In addition, there are several steps between X-ray absorption and luminescence emission which can be effected by defects, as well as several different types of defects including domain walls, point defects, and sites on the particle surface. Finally, there are systematic uncertainties in domain size due to assumptions going into the Scherrer constant, K, for polydispersed samples51, and effects of systematic errors from instrument and strain broadening (especially for larger particles). Given multiple theoretical parameters for defect type, function, and distribution, the measurements are not accurate enough to precisely define and quantify the quenching mechanisms. However, Figure 8 suggests that domain size is an excellent predictor of luminescence intensity, and the models for electron hole pair diffusion and domain wall quenching are generally consistent with the experimental curve, especially with an additional quenching mechanism for small domain particles.
Nanoparticle Functionalization
For most chemical sensing applications using nanophosphors, the nanophosphor surface needs to be functionalized to bind to specific receptors. For example, nanophosphors can be functionalized with folic acid (FA) to target cells over-expressing folate receptors. The folate receptor is a highly selective tumor marker overexpressed in more than 90% of ovarian carcinomas.52 Folic acid (FA) has high binding affinity to the folate receptors, which provides an attractive method for tumor targeting.52–55 Therefore, to demonstrate the ability to label folate receptors with the bright X-ray and up-conversion nanophosphors for tumor imaging through deep tissue, we functionalized the nanophosphor surfaces with FA, using polyethylene glycol (PEG) diacid as a flexible spacer (PEG-FA). PEG was used as a spacer to improve colloidal stability and reduce non-specific binding in vivo.56 It has been used to improve the folic acid affinity by providing a flexible linker.53, 55 Figure S7 (ESI) shows the scheme to functionalize the nanophosphors with PEG–FA conjugates (to generate NP-PEG-FA). Amine functionalized surface on nanophosphors is generated by hydrolysis and condensation of (3-Aminopropyl)triethoxylsilane (APTES) (Figure S8, ESI).57 The luminescence signal dropped less than 5% after surface modification (Figure S9, ESI). The amine functionalized surface is then coated with PEG diacid using the EDC/NHS conjugation method. To link the FA with PEG, the carboxyl group tag on the PEG diacid was converted into amine group tag with excess ethylene diamine by EDC/NHS chemistry. FA was subsequently attached to these amine-functionalized PEG chains via carbodiimide activation with DCC, which has been shown to be effective to link with the γ-carboxyl group (Figure S7, ESI).53 High affinity FR binding is retained when folic acid is covalently linked via its γ-carboxyl group to the particle surface.52 TEM images showed the similar size and morphology after nanoparticles were coated with PEG-FA and were unable to resolve the FA coating on the nanoparticle (Figure S10, ESI).
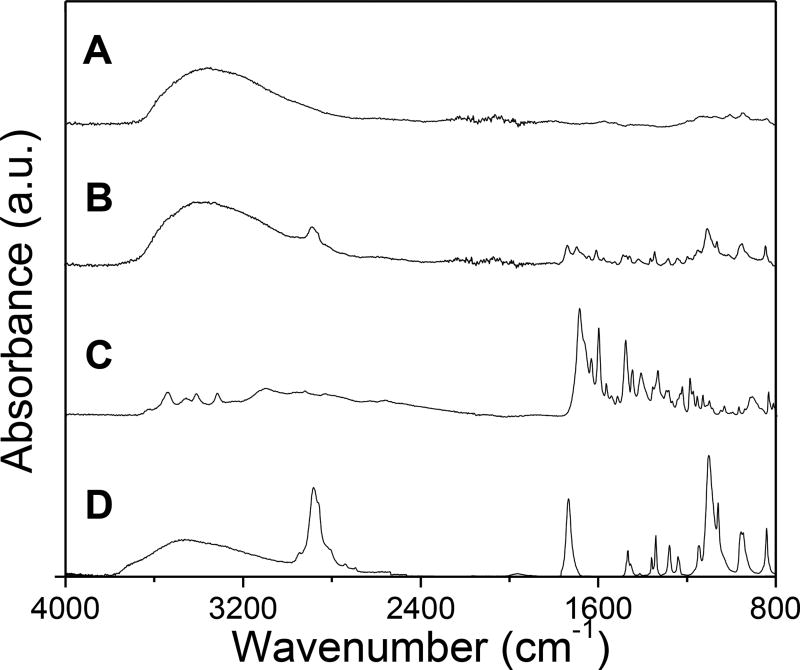
FTIR spectroscopy was used to confirm that the nanophosphor surface had indeed been functionalized with PEG-FA. FTIR spectra of nanophosphors without surface modification, PEG-FA coated nanophosphors, PEG diacid, and FA are shown in Figure 10. The appearance of peaks of PEG-FA coated nanophosphors at 2915 and 950 cm−1 for –CH2 stretching vibration and –CH out of plane bending vibration confirms the presence of PEG on the nanophosphor surface. The peaks at 1596 and 1407 cm−1 correspond to the aromatic ring stretch of the pteridine ring and p-amino benzoic acid moieties of FA. In addition, the zeta potential of the nanophosphors was measured to monitor the surface charge after each modification step (Figure S11, ESI). The zeta potential change at each step indicated significant surface chemistry modification.
Figure 10.
FTIR spectra of (A) NaF-doped Gd2O2S:Eu, (B) PEG-FA functionalized Gd2O2S:Eu, (C) FA, (D) PEG diacid.
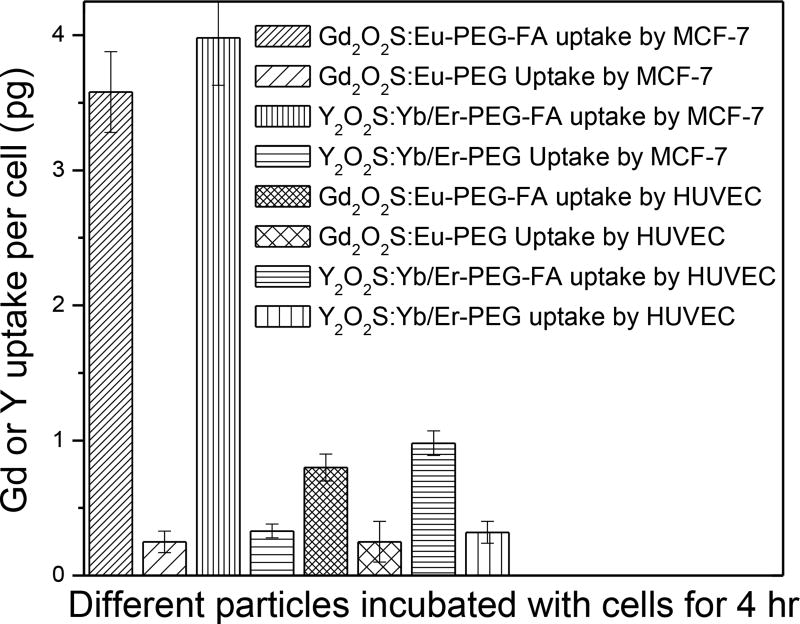
To demonstrate the feasibility of using these bright nanophosphors for tumor targeting, an in vitro cytotoxicity test of NaF-doped Gd2O2S:Eu and Y2O2S:Yb/Er nanophosphors was performed on MCF-7 breast cancer cells (Figure S12, ESI). The cell viability of the cells without nanoparticle treatment was normalized as 100% to determine the cell viability of different concentrations of nanoparticles. The results indicate that neither the X-ray (Gd2O2S:Eu) nor upconverison nanophosphors (Y2O2S:Yb/Er) significantly affect the cell viability up to concentration of at least 1000 µg/ml. To investigate whether PEG-FA-functionalized nanophosphors would target cancer cells, MCF-7 breast cancer cells (folate receptor positive)54 were incubated with PEG–FA and PEG-functionalized X-ray nanophosphors (NaF doped Gd2O2S:Eu) or up-conversion nanophosphors (NaF doped Y2O2S:Yb/Er). The uptake of these nanophosphor with different surface functionalization was evaluated after 4 h of cell culture. Figure 11 displays the cellular uptake of Gd3+ or Y3+ per cell for the PEG-FA or PEG-functionalized X-ray or up-conversion nanophosphors. MCF-7 cells cultured with the PEG–FA functionalized surface showed considerably higher nanoparticle uptake than those cultured with PEG-functionalized nanophosphors. After 4 h, cells cultured with the PEG–FA functionalized nanophosphors displayed an uptake of 3.6 pg Gd3+ or 4.0 pg Y3+ per cell, 15 and 12 times higher than those cultured with just PEG-functionalized X-ray nanophosphors and up-conversion nanophosphors, respectively. To evaluate targeting specificity of the PEG-FA conjugated nanophosphors to tumor cells, the uptake of the nanoconjugates by MCF-7 cells was compared to the uptake by human umbilical vein endothelial (HUVEC) cells, a folate receptor negative cell line.52 After 4 h incubation, the uptake of the PEG-FA conjugated nanophosphors by MCF-7 cells is 4 times higher than by HUVEC cells, as shown in Figure 11. The selective uptake of PEG-FA conjugated nanophosphors also demonstrates the successful surface modification of nanophosphors.
Figure 11.
Cellular uptake (measured by ICP-OES) of nanoparticles coated with PEG, or PEG–FA by MCF-7 and HUVEC cells for 4 hr.
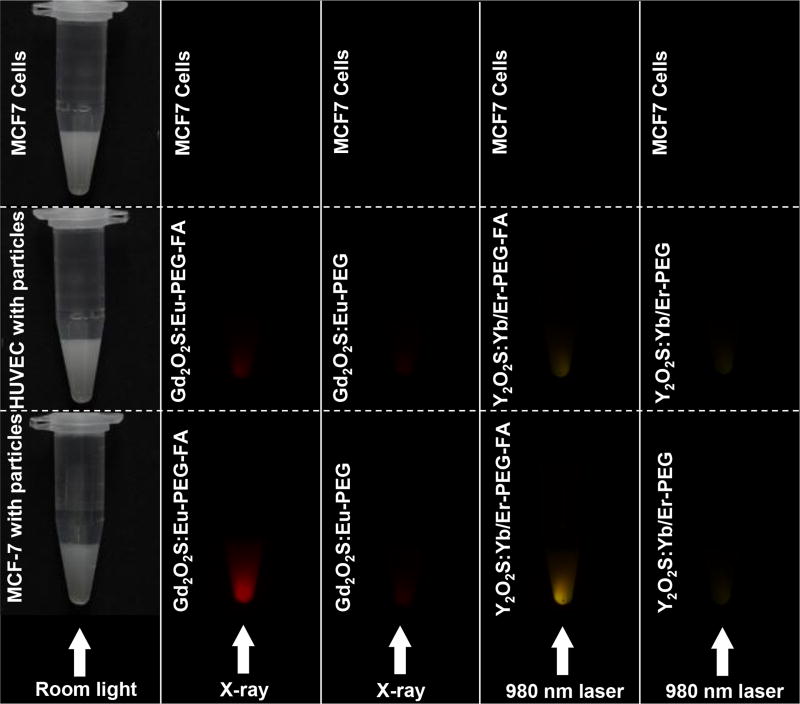
Figure 12 shows photographs of suspension of cells loaded with GOS or YOS nanophosphors and irradiated with X-ray or 980 nm near infrared light, respectively. The most intense X-ray and up-conversion luminescence is detected from the MCF-7 cells incubated with PEG-FA functionalized nanophosphors. The HUVEC cells incubated with PEG-FA functionalized nanophosphors display relatively weak luminescence due to the low nanoparticle uptake by HUVEC cells. Nanophosphors functionalized with just PEG displayed the lowest luminescence intensity for both MCF-7 and HUVEC cells. Controls with no nanoparticles displayed no observable luminescence. These luminescence intensity measurements are consistent with cell uptake the data obtain by ICP (Figure 11).
Figure 12.
Cancer cell targeting by bright X-ray (Gd2O2S:Eu) and up-conversion (Y2O2S:Yb/Er) phosphors. Photos show microcentrifuge tubes with nanophosphor-labelled MCF-7 and HUVEC cells.
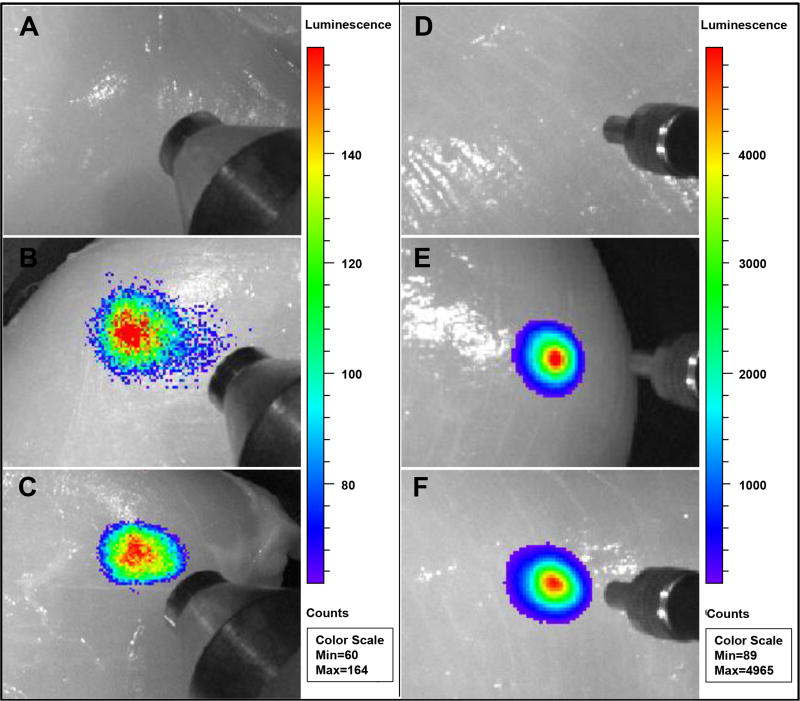
A key advantage of using X-rays and near infrared light to excite nanophorsphors in deep tissue imaging is that the excitation penetrates deeply through tissue, especially compared with UV and visible excited fluorescence. To explore whether these bright nanophosphors could serve as imaging probes to locate tumours in tissue, PEG-FA functionalized X-ray (Gd2O2S:Eu) and upconversion (Y2O2S:Yb/Tm) nanophosphors with 0% and 7.6 mol% NaF doping were injected into chicken breast (Figure 13). The nanophosphors with 0% NaF doping (1 mg/mL, 200 µL) emit intense light under 1 cm chicken breast without background. However, similar luminescence intensity of the nanophosphors with 7.6 mol% NaF doping was observed under 1 cm chicken breast at much lower dose (0.1 mg/mL, 200 µL), which suggests the application of these bright nanophosphors can dramatically decrease the required dose of nanophosphors to obtain enough signal. The total counts of luminescence is summarized in Figure S13 (ESI).
Figure 13.
Deep tissue imaging of X-ray or up-conversion nanophosphors: 200 µL of (A) PBS solution, (B) 1 mg/mL PEG-FA functionalized Gd2O2S:Eu (0% NaF doping), (C) 0.1 mg/mL PEG-FA functionalized Gd2O2S:Eu (7.6 mol% NaF doping), (D) PBS solution, (E) PEG-FA functionalized Y2O2S:Eu (0% NaF doping), and (F) PEG-FA functionalized Y2O2S:Eu (7.6 mol% NaF doping) were injected into chicken breast at a depth of 1 cm. A pseudocolor X-ray luminescence or upconversion luminescence intensity image was superimposed over a greyscale reflection image taken under an overhead lamp.
In conclusion, a novel method was developed to fabricate bright X-ray and up-conversion nanophosphors by encapsulating a sintering agent within the core and protecting with a shell. This approach increased the luminescence intensity of X-ray (Gd2O2S:Eu or Tb) and up-conversion (Y2O2S:Yb/Er or Yb/Tm) nanophosphors by more than ten-fold compared to identically sized particles with no sintering agent, and did not cause aggregation. The protective shell confined the solid state reaction to within each particle rather than between particles. The nanophosphor crystal domain size more than doubled without increasing the physical diameter of the particles. The synthesis approach is highly versatile and was successfully applied here to two different nanophosphors (YOS and GOS), several different activators (Eu, Tb, Er, and Tm), and three different excitation methods (X-ray luminescence & blue light fluorescence for the GOS, and near infrared upconversion for the YOS). In addition, the protective shell contains the same materials as the nanophosphors (apart from the sintering agent), therefore, no purification process is required to remove the protective shell. Functionalizing the nanophosphors with PEG-FA greatly increased their cellular uptake by MCF-7 cancer cells, which overexpress folic acid receptors. These highly monodispersed and bright nanophosphors could be imaged through tissue with low background, and have applications in cancer targeting and diagnostic analysis. Future work will investigate in vivo tumor imaging in small animal models and coating the particles with polymer to encapsulation chemotherapy drugs for targeted drug delivery with imaging.
Experimental
Materials
Anhydrous dimethyl sulfoxide (DMSO), dicyclohexylcarbodiimide (DCC), 1-(3-Dimethylaminopropyl)-3-ethylcarbodiimide Hydrochloride (EDC), N-hydroxysulfosuccinimide (Sulfo-NHS) and Poly(ethylene glycol) diacid (PEG diacid, MW=600) were purchased from Sigma-Aldrich (St. Louis, MO). Gadolinium nitrate, yttrium nitrate, europium nitrate, terbium nitrate, ytterbium nitrate, erbium nitrate, thulium nitrate, Na2-ethylenediaminetetraacetic acid (EDTA), 4-morpholineethanesulfonic acid monohydrate (MES), and sodium fluoride were purchased from Alfa Aesar (Ward Hill, MA). Ethanol (anhydrous, denatured) was obtained from BDH Chemicals Ltd (Poole, Dorset, UK). Deionized (DI) water was obtained from EMD Chemicals Inc. (Gibbstown, NJ). Polyvinylpyrrolidone (PVP K-30, MW 40,000) was obtained from Spectrum Chemicals (Gardena, CA). Commercial ~8 µm Gd2O2S:Eu and ~10 µm Gd2O2S:Tb X-ray microphosphors (product # UKL63/N-R1 and UKL65/N-R1 respectively), and ~ 4 µm Y2O2S:Yb/Tm upconversion microphosphors (PTIR475/F) were purchased from Phosphor Technology (Phosphor Technology Ltd, Stevenage, UK). All chemicals were used as received without further purification.
Synthesis of 7.6 mol% NaF doped X-ray nanophosphors (Gd2O2S:Eu and Gd2O2S:Tb)
1. Synthesis of Gd2O(CO3)2•H2O precursor
2 mL Gd(NO3)3 (1 M) with 0.625 mL Eu(NO3)3 (80 mM), or Tb(NO3)3 (80 mM), and 12 g PVP in 2 L DI water was heated to 80 °C before 30 g urea was added to the solution. After the solution was maintained at 80 °C for 40 min, the reaction was quenched by placing the solution in an ice water bath. The particles were collected by centrifugation at 10,000 rpm (relative centrifugal force, RCF = 15,316 × g) for 10 min and washed three times with DI water. The collected nanoparticles were suspended in 10 mL distilled water with 5 mg NaF. After 5 min sonication, 30 mL glycerol was added to the solution. This mixture was heated to 120 °C and kept at that temperature for 2 h to evaporate the water. The particle solution was then heated to 170 °C under nitrogen and kept at that temperature for 1 h to calcine the particles and encapsulate NaF into the particles. These particles were collected by centrifugation at 10,000 rpm (RCF = 15,316 × g) for 10 min and washed three times with DI water.
2. Preparation of protective shell on the NaF doped precursor
The Gd2O(CO3)2•H2O precursor, synthesized as described above, were resuspeneded in 200 mL distilled water with 1.2 g PVP. After this solution was heated to 80 °C, 2 mL Gd(NO3)3 (1 M), 1 mL Eu(NO3)3 (80 mM), or 0.625 mL Tb(NO3)3 (80 mM), and 12 g urea were added to the solution. This solution was kept stirring at 80 °C for 60 min. This reaction was quenched by an ice water bath. The precursor was collected by centrifugation at 10,000 rpm (RCF = 15,316 × g) for 10 min and washed three times with DI and once with ethanol.
3. Converting phosphor precursor to Gd2O2S:Eu or Gd2O2S:Tb
The obtained particles were first dried in an oven at 80 °C for 3 h and then calcined at 600 °C in air for 2 h. The sulfidation reaction was carried out by transferring the particles in a tube furnace at 700 °C for 1 h with a sulfur/Ar flow. The particles were then incubated in 200 mL distilled water at 100 °C for 2 h to remove the residual sulfur and gadolinium sulfide.
Synthesis of 7.6 mol% NaF doped upconversion nanophosphors (Y2O2S:Yb/Er and Y2O2S:Yb/Tm)
1. Synthesis of Y2O(CO3)2•H2O precursor
2 mL Y(NO3)3 (1 M) with 1.875 mL Yb(NO3)3 (80 mM) and 0.375 mL Er (NO3)3 or Tm(NO3)3 (80 mM) in 2 L DI water was heated to 80 °C before 30 g urea was added to the solution. After the solution was maintained at 80 °C for 40 min, the reaction was quenched by placing the solution in an ice water bath. The particles were collected by centrifugation at 10,000 rpm (RCF = 15,316 × g) for 10 min and washed three times with DI water. The collected nanoparticles were resuspended in 10 mL distilled water with 5 mg NaF. After 5 min sonication, 30 mL glycerol was added to the solution. This mixture was heated to 120 °C and kept at that temperature for 2 h to evaporate the water. The particle solution was then heated to 170 °C under nitrogen and kept at that temperature for 1 h to calcine the particles and encapsulate NaF into the particles. These particles were collected by centrifugation at 10,000 rpm (RCF = 15,316 × g) for 10 min and washed three times with DI water.
2. Protection layer coating on the NaF doped precursor
The Y2O(CO3)2•H2O precursor, synthesized as described above, were resuspended in 200 mL distilled water with 1.2 g PVP. After this solution was heated to 80 °C, 2 mL Y(NO3)3 (1 M) with 1.875 mL Yb(NO3)3 (80 mM) and 0.375 mL Er (NO3)3 or Tm(NO3)3 (80 mM), and 12 g urea were added to the solution. This solution was kept stirring at 80 °C for 60 min. This reaction was quenched by an ice water bath. The precursor was collected by centrifugation at 10,000 rpm (RCF = 15,316 × g) for 10 min and washed three times with DI and once with ethanol.
3. Converting phosphor precursor to Y2O2S:Yb/Er or Y2O2S:Yb/Tm
The obtained particles were first dried in an oven at 80 °C for 3 h and then calcined at 600 °C in air for 2 h. The sulfidtion reaction was carried out by transferring the particles in a tube furnace at 700 °C for 1 h with a sulfur/Ar flow. The particles were then incubated in 200 mL distilled water at 100 °C for 2 h to remove the residue sulfur and gadolinium sulfide.
Synthesis of PEG-FA functionalized X-ray and up-conversion nanophosphors
1. Preparation of amine functionalized Gd2O2S:Eu or Y2O2S:Yb/Er
120 mg of X-ray or upconverson nanophosphors was suspended and stirred in a mixed solution containing 90 mL ethanol with 6 mL distilled water, 0.6 g PVP and 40 µL tetraethyl orthosilicate (TEOS). This solution was stirred for 3 h before the particles were collected by centrifuging and washing with ethanol three times. These particles were transferred to 50 mL ethanol with 0.3 g and 300 µL (3-Aminopropyl)triethoxysilane (APTES) and magnetically stirred for 24 h. The amine functionalized particles were collected and wash three times by DI water.
2. Preparation of PEG-COOH conjugated X-ray and upconversion nanophosphors
The X-ray or upconversion nanophosphors were functionalized with PEG diacid using the EDC/NHS conjugation method. In a typical synthesis, 191 mg EDC (1 mmol) and 217 mg Sulfo-NHS ( mmol) was used to activate carboxyl group of PEG diacid (600 mg, 1 mmol). The reaction was performed in 50 mL MES buffer (pH 6.0) at room temperature for 0.5 h. After the pH of this solution was adjusted to pH 7.4 by PBS solution, 1 mL amine functionalized nanophosphors (25 mg/mL) in PBS was then added to the activated PEG diacid solution to form PEGylated nanophosphors with carboxyl groups. The mixture was stirred at room temperature for another 3 h. The PEG-COOH functionalized particles were obtained by centrifugation and washed three times in DI water.
3. Preparation PEG-NH2 conjugated X-ray and upconversion nanophosphors
The EDC/NHS involved conjugation method still can be used to functionalize the PEGylated X-ray or upconversion nanophosphors with amine groups. In a typical synthesis, 38.2 mg EDC (0.2 mmol) and 43.4 mg Sulfo-NHS (1 mmol) was added into 20 mL MES buffer (pH 6.0) with all the PEGylated particles prepared in the previous step to activate carboxyl group of PEG on the surface of nanophosphors. The activation reaction was performed at room temperature for 0.5 h. After the pH of this solution was adjusted to pH 7.4 by PBS solution, 50 µL ethylene diamine in 10 ml PBS solution (pH 7.4) was then added to the activated particle solution to form PEGylated nanophosphors with amine groups. The mixture was stirred at room temperature for another 3 h. The PEG-NH2 functionalized particles were obtained by centrifugation and washed three times in ethanol and three times in DMSO.
4. Preparation of PEG-FA conjugated X-ray and upconversion nanophosphors
The DCC/NHS involved conjugation method was employed to functionalize the X-ray or upconversion nanophosphors with folic acid. In a typical synthesis, 40.2 mg DCC (0.2 mmol) and 23 mg NHS (0.2 mmol) was used to activate carboxyl group of 0.5 mmol folic acid. The reaction was performed in 20 mL anhydrous DMSO under nitrogen atmosphere at room temperature for 0.5 h. 10 mL PEG-NH2nanophosphors (2 mg/mL) in DMSO was then added to the activated folic acid solution to form PEG-FA conjugated nanophosphors. The mixture was incubated in the presence of pyridine (100 mg) at room temperature for another 12 h. The resulting mixture was protected from light by aluminium foil and reacted for another 12 h. The FA-conjugated nanophosphors were washed twice in ethanol and twice in 20 mM sodium citrate at pH 8.0 and resuspended in DI water prior to use.
Cell viability test
MCF-7 breast cancer cells were cultured overnight under 37°C at 5% CO2in a 96-well place with 10,000 cells in each well. The nanophosphors with different surface modification were diluted in media to desired concentrations after sonication for 10 min in aqueous solution. After overnight incubation, a Presto Blue assay (life Technologies, Gaithersburg, MD) was carried out by replacing the culture media with 100 µL 1:9 ratio Presto Blue. Fluorescence signal was measured with excitation of 560 nm and emission at 590 nm in a plate reader. The intensity of fluorescence for each sample was converted into cell viability after comparison of the fluorescence intensity between the experimental groups and the control cells.
Intracellular uptake study of PEG-FA conjugated nanophosphors
To study the targeting of tumor cells by nanophosphors with difference surface functionalization, MCF-7 breast cancer cells were seeded into a 6-well plate at a cell density of 8×10⁵ cells per well for 24 h. After removing the culture medium, PEG-FA conjugated X-ray or upconversion nanophosphors were dispersed in RPMI-1640 cell culture medium with a concentration 250 mg/mL and added to each well. As a control, 250 mg/mL PEG-NH2 conjugated nanophosphors was suspended in RPMI-1640. After each sample was cultured for 4 h, the incubated cells were washed with PBS three times and then detached with trypsin. Cell concentrations were determined by cell counts. The cells were then collected in a pellet by centrifuged at 4,000 rpm (RCF= 2,450 × g) for 5 min. The cell pellet was digested in 500 µL HNO3 (6 M) for 48 h at 150 °C to dissolve the nanophosphors. The free Gd3+ or Y3+ was separated from cell debris and proteins by spinning down cell debris/protein by centrifugation at 14,000 rpm (RCF = 10,956×g) for 10 min. The content of Gd3+ or Y3+ per cell was quantified by inductively coupled plasma optical emission spectroscopy (ICP-OES).
To evaluate the specificity of intracellular of the nanophosphors with different surface modification, the uptake of PEG-FA or PEG–NH2conjugated nanophosphors by MCF-7 cells was compared with the uptake by HUVEC cells that have fewer folate receptors. Both cell lines were cultured with PEG–FA conjugated nanophosphors at concentrations of 250 mg/mL. The cells were cultured for 4 h with nanoparticle conjugates in RPMI and then washed three times with PBS and then detached. The cells were then collected in a pellet by centrifuged at 4,000 rpm (RCF = 2,450 × g) for 5 min. The cell pellet was digested in 500 µL HNO3 (6 M) for 48 h at 150 °C to dissolve the nanophosphors. The free Gd3+ or Y3+ was separated from cell debris and proteins by spinning down cell debris/protein with centrifugation at 14,000 rpm (RCF = 10,956×g) for 10 min. The content of Gd3+ or Y3+ per cell was quantified by inductively coupled plasma optical emission spectroscopy (ICP-OES) (Optima 3100 RL, Perkin-Elmer, Norwalk, CT, USA).
Characterization methods
Transmission electron microscopy (TEM) was performed at 300 kV on an electron microscope (H9500). Physical particle diameter was estimated from TEM measurements of at least 100 particles; for particle aggregates, the diameter was defined as the mean between the shortest and longest length of particle. Powder X-ray Diffraction (XRD) patterns were taken with a Rigaku diffractometer with the tube set at 40 kV and 40 mA (CuKα radiation). Crystal domain size was estimated from the XRD peak width using the Scherrer equation. The Zeta-potential of the nanoparticles was measured with a Zetasizer Nano ZS (equipped with a 633 nm He-Ne laser) from Malvern Instruments. The gadolinium and yttrium content taken up by cells was determined by ICP-OES after the cells and particles were completed dissolved in HNO3 (6 M). Nanophosphors were completely dissolved in HNO3 (6 M) at 150 °C for 48 h before their NaF content was determined with a Model 225 ISE Fluoride Meter (Denver Instrument, Bohemia, NY). Fourier transform infrared spectra (FTIR) were taken by a Thermo-Nicolet Magna 550 Fourier transform infrared spectroscopy.
All fluorescence and luminescence scpetra were acquired using a Leica DMI5000 microscope (Leica, Wetzlar, Germany) coupled to a DNS 300 spectrometer (DeltaNu, Laramie, WY) equipped with an Andor DU420A-BV CCD camera. For fluorescence spectroscopy, 480 nm light from a filtered mercury-xenon arc lamp was used to excite the nanophosphors. To measure radioluminescence spectra, the sample was irradiated by X-rays generated by a mini-X X-ray tube (Amptek Inc. MA, USA). The X-ray tube was operated with tube voltage of 40 kV and tube current of 99 µA. All X-ray excited optical luminescence measurements were carried out with the same particle concentration (1 mg/mL) and the same excitation source, voltage, and power. The 980 nm excitation light was generated by a 500 mW 980 nm diode-pumped solid state laser (Changchun New Industries Optoelectronics Technology, Changchun, China), with an intensity of approximately 33W/cm2 at the focus. All the upconversion luminescence spectroscopy was carried out with the same particle concentration (0.25 mg/mL) and excitation source & powder. Each sample with a volume of 200 µL was added to a 96 well plate which was mounted on the Leica DMI5000 microscope. X-ray and up-conversion luminescence images through tissue were captured in an IVIS Lumina-XR Imaging System (Caliper Life Sciences, Hopkinton, MA, US) with 1 and 0.1 s exposure time, respectively, in “bioluminescence mode.”
Conclusions
A novel method was developed to fabricate bright X-ray and up-conversion nanophosphors by encapsulating a sintering agent within the core and protecting with a shell. This approach increased the luminescence intensity of X-ray (Gd2O2S:Eu or Tb) and up-conversion (Y2O2S:Yb/Er or Yb/Tm) nanophosphors by more than ten-fold compared to identically sized particles with no sintering agent, and did not cause aggregation. The protective shell confined the solid state reaction to within each particle rather than between particles. The nanophosphor crystal domain size more than doubled without increasing the physical diameter of the particles. The synthesis approach is highly versatile and was successfully applied here to two different nanophosphors (YOS and GOS), several different activators (Eu, Tb, Er, and Tm), and three different excitation methods (X-ray luminescence & blue light fluorescence for the GOS, and near infrared upconversion for the YOS). In addition, the protective shell contains the same materials as the nanophosphors, therefore, no purification process is required to remove the protective shell. Functionalizing the nanophosphors with PEG-FA greatly increased their cellular uptake by MCF-7 cancer cells, which overexpress folic acid receptors. These highly monodispersed and bright nanophosphors could be imaged through tissue with low background, and have applications in cancer targeting and diagnostic analysis. Future work will investigate in vivo tumor imaging in small animal models and coating the particles with polymer to encapsulation chemotherapy drugs for targeted drug delivery with imaging.
Supplementary Material
Acknowledgments
This research was supported in part by NSF CAREER award CHE1255535 to HC and JNA, an NSF award CMMI-1100684 to BQ and OTM, and an NSF award CMMI-1130636 to TC. Electron microscopy images were acquired at the Clemson University Electron Microscope Facility and use of this facility and IVIS small animal imager was funded by The South Carolina Bioengineering Center of Regeneration and Formation of Tissues (BioCRAFT) funded under NIGMS of the National Institutes of Health, award number 5P20GM103444-07.
Footnotes
Electronic Supplementary Information (ESI) available: Additional characterizations details are available in Electronic supplementary information (ESI).
Notes and references
- 1.Medintz IL, Uyeda HT, Goldman ER, Mattoussi H. Nat. Mater. 2005;4:435–446. doi: 10.1038/nmat1390. [DOI] [PubMed] [Google Scholar]
- 2.Wang Y, Chen L. Nanomedicine. 2011;7:385–402. doi: 10.1016/j.nano.2010.12.006. [DOI] [PubMed] [Google Scholar]
- 3.Ullman EF, Kirakossian H, Singh S, Wu ZP, Irvin BR, Pease JS, Switchenko AC, Irvine JD, Dafforn A, Skold CN. Proc. Natl. Acad. Sci. 1994;91:5426–5430. doi: 10.1073/pnas.91.12.5426. [DOI] [PMC free article] [PubMed] [Google Scholar]
- 4.Stone N, Kerssens M, Lloyd GR, Faulds K, Graham D, Matousek P. Chem. Sci. 2011;2:776–780. [Google Scholar]
- 5.Horvath TD, Kim G, Kopelman R, Ashkenazi S. Analyst. 2008;133:747–749. doi: 10.1039/b800116b. [DOI] [PubMed] [Google Scholar]
- 6.Glickman JF, Schmid A, Ferrand S. Assay and drug development technologies. 2008;6:433–455. doi: 10.1089/adt.2008.135. [DOI] [PubMed] [Google Scholar]
- 7.Chen H, Qi B, Moore T, Colvin DC, Crawford T, Gore JC, Alexis F, Mefford OT, Anker JN. Small. 2014;10:160–168. doi: 10.1002/smll.201300828. [DOI] [PMC free article] [PubMed] [Google Scholar]
- 8.Haase M, Schäfer H. Angewandte Chemie International Edition. 2011;50:5808–5829. doi: 10.1002/anie.201005159. [DOI] [PubMed] [Google Scholar]
- 9.Cates EL, Li F. RSC Advances. 2016;6:22791–22796. [Google Scholar]
- 10.Li C, Li F, Li T, Bai T, Wang L, Shi Z, Feng S. Dalton Transactions. 2012;41:4890–4895. doi: 10.1039/c2dt30064h. [DOI] [PubMed] [Google Scholar]
- 11.Li F, Li C, Liu J, Liu X, Zhao L, Bai T, Yuan Q, Kong X, Han Y, Shi Z, Feng S. Nanoscale. 2013;5:6950–6959. doi: 10.1039/c3nr01530k. [DOI] [PubMed] [Google Scholar]
- 12.Li F, Li C, Liu X, Bai T, Dong W, Zhang X, Shi Z, Feng S. Dalton Transactions. 2013;42:2015–2022. doi: 10.1039/c2dt32295a. [DOI] [PubMed] [Google Scholar]
- 13.Li F, Li C, Liu X, Chen Y, Bai T, Wang L, Shi Z, Feng S. Chemistry - A European Journal. 2012;18:11641–11646. doi: 10.1002/chem.201201309. [DOI] [PubMed] [Google Scholar]
- 14.Chen H, Moore T, Qi B, Colvin DC, Jelen EK, Hitchcock DA, He J, Mefford OT, Gore JC, Alexis F, Anker JN. ACS Nano. 2013;7:1178–1187. doi: 10.1021/nn304369m. [DOI] [PMC free article] [PubMed] [Google Scholar]
- 15.Chen H, Colvin DC, Qi B, Moore T, He J, Mefford OT, Alexis F, Gore JC, Anker JN. Journal of Materials Chemistry. 2012;22:12802–12809. doi: 10.1039/C2JM15444G. [DOI] [PMC free article] [PubMed] [Google Scholar]
- 16.Sun C, Pratx G, Carpenter CM, Liu H, Cheng Z, Gambhir SS, Xing L. Advanced Materials. 2011;23:H195–H199. doi: 10.1002/adma.201100919. [DOI] [PMC free article] [PubMed] [Google Scholar]
- 17.Chen H, Longfield DE, Varahagiri VS, Nguyen KT, Patrick AL, Qian H, VanDerveer DG, Anker JN. Analyst. 2011;136:3438–3445. doi: 10.1039/c0an00931h. [DOI] [PubMed] [Google Scholar]
- 18.Chen H, Rogalski MM, Anker JN. Physical Chemistry Chemical Physics. 2012 doi: 10.1039/c2cp41858d. [DOI] [PMC free article] [PubMed] [Google Scholar]
- 19.Carpenter CM, Sun C, Pratx G, Liu H, Cheng Z, Xing L. Opt. Express. 2012;20:11598–11604. doi: 10.1364/OE.20.011598. [DOI] [PMC free article] [PubMed] [Google Scholar]
- 20.Pratx G, Carpenter CM, Sun C, Lei X. IEEE Trans. Med. Imag. 2010;29:1992–1999. doi: 10.1109/TMI.2010.2055883. [DOI] [PubMed] [Google Scholar]
- 21.Chen D, Zhu S, Yi H, Zhang X, Chen D, Liang J, Tian J. Med. Phys. 2013;40:031111–031114. doi: 10.1118/1.4790694. [DOI] [PubMed] [Google Scholar]
- 22.Alexis F, Anker JN. Therapeutic Delivery. 2014;5:97–100. doi: 10.4155/tde.13.136. [DOI] [PubMed] [Google Scholar]
- 23.Moore T, Chen H, Morrison R, Wang F, Anker JN, Alexis F. Molecular Pharmaceutics. 2013;11:24–39. doi: 10.1021/mp400419k. [DOI] [PMC free article] [PubMed] [Google Scholar]
- 24.Uzair U, Benza D, Raval Y, Tzeng T-RJ, Behrend CJ, Anker JN. 2017 doi: 10.1117/12.2256049. [DOI] [PMC free article] [PubMed] [Google Scholar]
- 25.Chen H, Patrick AL, Yang Z, VanDerveer DG, Anker JN. Anal. Chem. 2011;83:5045–5049. doi: 10.1021/ac200054v. [DOI] [PubMed] [Google Scholar]
- 26.Carpenter CM, Pratx G, Sun C, Xing L. Phys. Med. Bio. 2011;56:3487–3502. doi: 10.1088/0031-9155/56/12/003. [DOI] [PMC free article] [PubMed] [Google Scholar]
- 27.Carpenter CM, Sun C, Pratx G, Rao R, Xing L. Medical physics. 2010;37:4011. doi: 10.1118/1.3457332. [DOI] [PMC free article] [PubMed] [Google Scholar]
- 28.Lun MC, Zhang W, Li C. Appl. Opt. 2017;56:3010–3019. doi: 10.1364/AO.56.003010. [DOI] [PMC free article] [PubMed] [Google Scholar]
- 29.Ntziachristos V. Nat Meth. 2010;7:603–614. doi: 10.1038/nmeth.1483. [DOI] [PubMed] [Google Scholar]
- 30.Xu CT, Svenmarker P, Liu H, Wu X, Messing ME, Wallenberg LR, Andersson-Engels S. ACS Nano. 2012;6:4788–4795. doi: 10.1021/nn3015807. [DOI] [PubMed] [Google Scholar]
- 31.Shimizu K, Tochio K, Kato Y. Appl. Opt. 2005;44:2154–2161. doi: 10.1364/ao.44.002154. [DOI] [PubMed] [Google Scholar]
- 32.Van Schaik W, Blasse G. Chemistry of Materials. 1992;4:410–415. [Google Scholar]
- 33.Dhanaraj J, Jagannathan R, Kutty TRN, Lu C-H. The Journal of Physical Chemistry B. 2001;105:11098–11105. [Google Scholar]
- 34.Jagannathan R, Kutty T, Kottaisamy M, Jeyagopal P. Japanese Journal of Applied Physics-Part 1 Regular Papers and Short Notes. 1994;33:6207–6212. [Google Scholar]
- 35.Kumar GA, Pokhrel M, Martinez A, Dennis RC, Villegas IL, Sardar DK. J. Alloys Compd. 2012;513:559–565. [Google Scholar]
- 36.Luo X, Cao W. Science in China Series B: Chemistry. 2007;50:505–513. doi: 10.1007/s11426-007-0047-3. [DOI] [PMC free article] [PubMed] [Google Scholar]
- 37.Popovici E-J, Muresan L, Hristea-Simoc A, Indrea E, Vasilescu M, Nazarov M, Jeon DY. Optical Materials. 2004;27:559–565. [Google Scholar]
- 38.Champion E. Acta Biomaterialia. 2013;9:5855–5875. doi: 10.1016/j.actbio.2012.11.029. [DOI] [PubMed] [Google Scholar]
- 39.Pan Y, Wu M, Su Q. Materials Science and Engineering: B. 2004;106:251–256. [Google Scholar]
- 40.Pang T, Cao W, Xing M, Feng W, Xu S, Luo X. Journal of Rare Earths. 2010;28:509–512. [Google Scholar]
- 41.Chen G, Shen J, Ohulchanskyy TY, Patel NJ, Kutikov A, Li Z, Song J, Pandey RK, Ågren H, Prasad PN, Han G. ACS Nano. 2012;6:8280–8287. doi: 10.1021/nn302972r. [DOI] [PMC free article] [PubMed] [Google Scholar]
- 42.Wang Y-F, Sun L-D, Xiao J-W, Feng W, Zhou J-C, Shen J, Yan C-H. Chemistry - A European Journal. 2012;18:5558–5564. doi: 10.1002/chem.201103485. [DOI] [PubMed] [Google Scholar]
- 43.Tian Y, Hua R, Yu J, Chen B, Sun J, Cheng L. Chinese Journal of Chemistry. 2010;28:921–927. [Google Scholar]
- 44.Li IF, Su C-H, Sheu H-S, Chiu H-C, Lo Y-W, Lin W-T, Chen J-H, Yeh C-S. Advanced Functional Materials. 2008;18:766–776. [Google Scholar]
- 45.Carmignato S, Dreossi D, Mancini L, Marinello F, Tromba G, Savio E. Measurement Science and Technology. 2009;20:084021. [Google Scholar]
- 46.Nakamura R, Yamada N, Ishii M. Japanese Journal of Applied Physics. 1999;38:6923. [Google Scholar]
- 47.Dong H, Sun L-D, Yan C-H. Nanoscale. 2013;5:5703. doi: 10.1039/c3nr34069d. [DOI] [PubMed] [Google Scholar]
- 48.Feng W, Zhu X, Li F. NPG Asia Mater. 2013;5:e75. [Google Scholar]
- 49.Gnach A, Bednarkiewicz A. Nano Today. 2012;7:532–563. [Google Scholar]
- 50.Benitez E, Husk D, Schnatterly S, Tarrio C. Journal of applied physics. 1991;70:3256–3260. [Google Scholar]
- 51.Langford JI, Wilson AJC. Journal of Applied Crystallography. 1978;11:102–113. [Google Scholar]
- 52.Sudimack J, Lee RJ. Advanced Drug Delivery Reviews. 2000;41:147–162. doi: 10.1016/s0169-409x(99)00062-9. [DOI] [PubMed] [Google Scholar]
- 53.Sun C, Sze R, Zhang M. Journal of Biomedical Materials Research Part A. 2006;78A:550–557. doi: 10.1002/jbm.a.30781. [DOI] [PubMed] [Google Scholar]
- 54.Li K, Jiang Y, Ding D, Zhang X, Liu Y, Hua J, Feng S-S, Liu B. Chemical Communications. 2011;47:7323–7325. doi: 10.1039/c1cc10739a. [DOI] [PubMed] [Google Scholar]
- 55.Sonvico F, Mornet S, Vasseur S, Dubernet C, Jaillard D, Degrouard J, Hoebeke J, Duguet E, Colombo P, Couvreur P. Bioconjugate Chemistry. 2005;16:1181–1188. doi: 10.1021/bc050050z. [DOI] [PubMed] [Google Scholar]
- 56.Liu W, Howarth M, Greytak AB, Zheng Y, Nocera DG, Ting AY, Bawendi MG. Journal of the American Chemical Society. 2008;130:1274–1284. doi: 10.1021/ja076069p. [DOI] [PMC free article] [PubMed] [Google Scholar]
- 57.Liu Y, Li Y, Li X-M, He T. Langmuir. 2013;29:15275–15282. doi: 10.1021/la403269u. [DOI] [PubMed] [Google Scholar]
Associated Data
This section collects any data citations, data availability statements, or supplementary materials included in this article.


