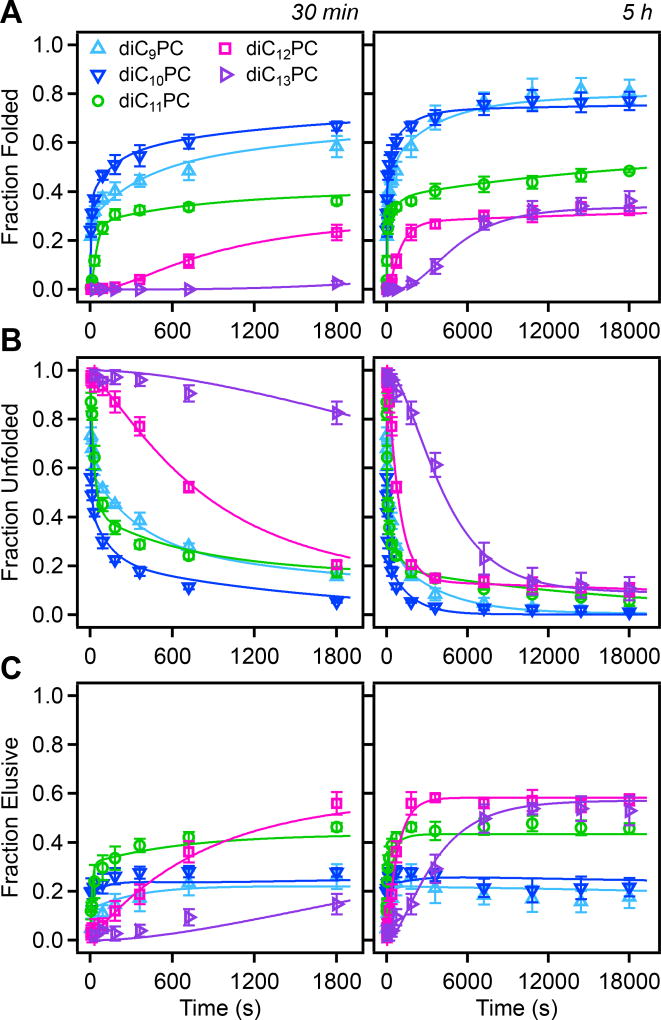
Figure 2.
Time-dependence of species measured by SDS-PAGE for OmpA171 folding into LUVs composed of diC9PC – diC13PC at 25 °C: (A) fraction folded, (B) fraction unfolded, and (C) fraction elusive. Densitometry values were converted to fractional quantities by dividing by the boiled band intensity. The legend is shown in panel A. Solid lines are fits to kinetic models discussed in the text and shown in Figure 6. Data are displayed over two time ranges: 1800 s (30 min) and 18000 s (5 h). Long-term time points can be seen in plots for individual lipid conditions, in Figures S13 and S15-S18.

