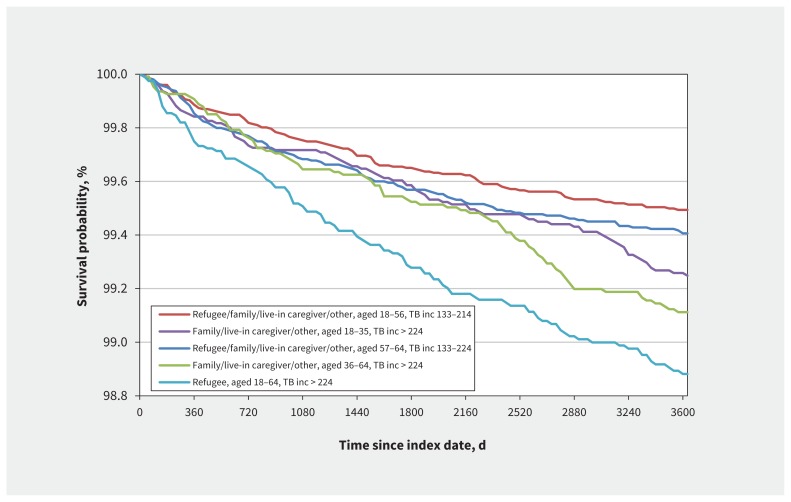
Figure 3:
Kaplan–Meier curves of 10-year TB outcomes within population subgroups identified by recursive partitioning models (plot shows the groups with highest TB yield). Analysis included participants with index years from 1985 to 2003 and aged less than 65 years at index date (n = 676 294). Note: inc = World Health Organization estimate for TB incidence in country of birth in index year (no. of TB cases [all forms]/100 000 population), TB = tuberculosis.

