Abstract
Zymogram assays have been used extensively to identify novel peptidoglycan hydrolases. In this study it is reported that the zymogram is susceptible to false positive results when highly positively charged proteins are assayed. As an example, we report on the case of the ChiZ membrane protein from the Mycobacterium tuberculosis divisome, which previously was described as a peptidoglycan hydrolase. Even though the full length ChiZ protein was able to produce positive assay results, other direct methods for measuring peptidoglycan hydrolysis do not provide convincing evidence that ChiZ has peptidoglycan hydrolysis activity. We show that the false positive result is produced by the highly positively charged N-terminal region of ChiZ. Thus, we developed a zymogram control that can be used to identify false positives results. This control assay lacks the refolding step in the normal zymogram assay. For lysozyme the control assay shows no activity, while the N-terminal region of ChiZ shows a false positive result. Given the limitations of the zymogram assay to reliably identify peptidoglycan hydrolases, we recommend using the zymogram control assay together with other methods to evaluate possible peptidoglycan hydrolysis activity.
Keywords: Zymogram assay, Peptidoglycan hydrolysis, ChiZ, Lysozyme
Introduction
The Zymogram assay is the primary assay for the identifying the functionality of peptidoglycan hydrolase enzymes. Here, we report a false positive result using this assay and note that false positives have been reported in the literature from other labs leading to incorrect identification of protein functionality. Furthermore, we have identified the cause for the false positive results that has led to a misidentification of the protein’s functionality. Peptidoglycan (PG) remodeling is a key cellular process in which peptidoglycan is synthesized and hydrolyzed during bacterial proliferation. One important group of enzymes called peptidoglycan hydrolases are essential for PG remodeling. These enzymes can be classified into several groups depending on the bonds broken during PG hydrolysis [1]. Identification of new PG hydrolases has been achieved primarily through the use of zymogram assays, this method was developed in the late 80’s and it is been used to date for that purpose [2]. The zymogram assay consists of running an SDS-PAGE gel of the protein to be tested with substrate for peptidoglycan hydrolysis suspended in the gel matrix; usually this substrate is a gram positive bacterium, such as Micrococcus lysodeikticus or pure PG. After, the gel is incubated in refolding buffer it is then stained with methylene blue that is known to bind to PG. Thus, proteins able to hydrolyze PG are revealed as clear bands in a blue background. Since this method is fast and easy, it has been applied to identify new proteins with peptidoglycan hydrolysis activity using whole cell lysates [3,4] and even to evaluate enzymatic activity under different conditions [5].
Despite the advantages of the zymogram assay, it has been observed that the results from this method do not always agree with other experimental tools used to further characterize PG hydrolases. For instance, it was concluded that the membrane anchored protein SpoIID from Bacillus subtilis is a PG hydrolase based mostly on the zymogram assay [6]. However, SpoIID did not show PG hydrolase activity in solution based assays [7]. The same case was observed for the protein EnvC from E. coli [8,9]
This work explains the cause of such false positive results by studying the case of ChiZ, a membrane protein from M. tuberculosis, which was identified as a PG hydrolase using primarily the zymogram assay [10]. ChiZ is one of many proteins associated with the M. tuberculosis divisome. It has a single transmembrane helix, a cytoplasmic N-terminus and periplasmic C-terminus. The periplasmic domain is homologous with LysM domains that bind peptidoglycan. The transmembrane domain has small residue motifs suggesting that this helix binds to other protein transmembrane helices. It is further known that ChiZ binds to both FtsQ and FtsI [11], each of which has a single TM helix and FtsI is known to be a transpeptidase [11]. When the cytoplasmic N-terminus of ChiZ was determined to be a PG hydrolase it was speculated that Lipid II, the peptidoglycan precursor that is transported from the cytoplasm to the periplasm for PG assembly might be hydrolyzed. This hypothesis was consistent with elongated Mtb bacilli upon ChiZ overproduction and a modest increase in cell size of chiZ deletion mutants [10].
Material and methods
Zymogram assay
The zymogram assay was performed as described previously [10]. SDS-PAGE was run using a 16% gel containing 0.1% (wt/vol) of Micrococcus lysodeikticus cells (Sigma) as substrate. Then, the gel was washed three times by soaking it in water for 10 min. After washing, the gel was incubated in refolding buffer (25 mM tris-HCl at pH 7.0, 1% (wt/vol) Triton-X 100) for 16 h at 37 °C and then washed as before. After that the gel was stained with 0.1% (wt/vol) methylene blue (Acros) in 0.01% (wt/vol) KOH solution for 3 h. The gel was washed overnight with water to remove excess stain.
Zymogram assay control
A zymogram assay control was performed in the same way as the normal zymogram except that the refolding step for the protein was removed. Thus, after the SDS-PAGE was run the gel was washed and immediately stained with methylene blue solution.
Purification of ChiZ N-terminal constructs
Purification of ChiZ N-terminal constructs (ChiZ1-64, ChiZ1-54, ChiZ1-47, and ChiZ1-37) proceeded as follows: after protein expression in E. coli BL21 cells, the cells were resuspended in 20 mM tris-HCl pH 8.0 containing 500 mM NaCl and 6 M urea. The cells were lysed using a French Press. Insoluble debris was pelleted by centrifugation at ~250,000 × g for 30 min. Protein purification proceeded using nickel affinity chromatography (Ni-NTA resin, Qiagen). The column was washed with 20 mM tris-HCl pH 8.0 containing 500 mM NaCl and 20 mM imidazole. Then, the protein was eluted in the same buffer containing 400 mM imidazole. The His-tag was cleaved using TEV protease. To remove the TEV protease the protein preparation was passed through a Ni-NTA column and then washed with 20 mM imidazole.
Fluorescence cell wall hydrolysis assay
The cell wall hydrolysis assay was performed as previously reported [10]. Briefly, 50 μg of fluorescamine labeled M. tuberculosis peptidoglycan was mixed with ChiZ in 50 mM tris-HCl pH 7.0 and 0.25% (wt/vol) with a final volume of 100 μL. The hydrolysis reaction was performed at 37 °C for 2 h and then stopped by addition of 100 μL of 4 M LiCl. Insoluble peptidoglycan was pelleted by centrifugation and the supernatant was used for fluorescence measurements. Fluorescence emission was measured at 482 nm using an excitation wavelength of 390 nm. Negative controls were performed using samples without protein and peptidoglycan substrate. Positive control was performed using Lysozyme.
Results
ChiZ peptidoglycan hydrolysis, a false positive case
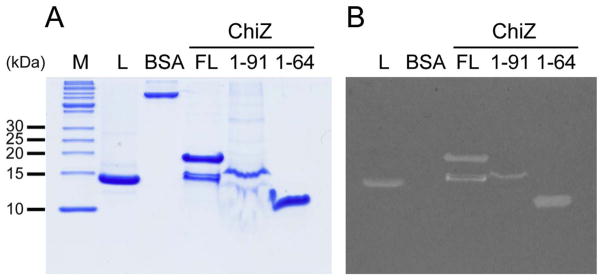
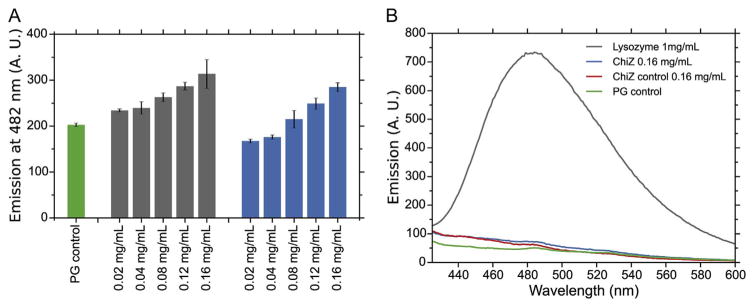
Previous studies of the ChiZ membrane protein demonstrated that the N-terminal region was responsible for hydrolyzing peptidoglycan. As can be seen in Fig. 1, the zymogram assay of the full length protein (lower band corresponds to a degradation product), first 91 residues (N-terminal region and transmembrane helix) and N-terminal region alone (first 64 residues) are all able to produce clear bands suggesting that the N-terminal region is capable of hydrolyzing peptidoglycan. Fig. 2A shows the result of cell wall hydrolysis assay using fluorescent labeled M. tuberculosis peptidoglycan demonstrating that ChiZ has no significant activity when compared to controls without substrate. It is clearly observed that there is an apparent increase in activity when the protein concentration is increased (Grey bars), but the same increase in fluorescence emission with protein concentration is observed when no substrate is used (Blue bars). Even though, there is a small difference between treatments (Grey bars) and only protein controls (Blue bars), this difference is not significant when compare to lysozyme positive control (Fig. 2B). This demonstrates that ChiZ is giving rise to a false positive result in the zymogram assay.
Fig. 1.
Zymogram assay of ChiZ constructs. A) SDS-PAGE that shows the different ChiZ constructs used for the zymogram assay. B) Result of the zymogram assay. Lysozyme (L) and Bovine serum albumin (BSA) were used as positive and negative controls, respectively. The gel includes ChiZ without the LysM domain (1–91), the N-terminal soluble region (1–64), and the full length protein (FL).
Fig. 2.
M. tuberculosis peptidoglycan fluorescence hydrolysis assay. Hydrolysis assay was performed using fluorescamine labeled PG. Fluorescence emission of soluble fragments was measured at 482 nm. (A) Experiments were performed with different concentrations of ChiZ (grey bars). Control experiments were performed without protein (green bar) and without substrate (blue bars). All experiments were performed in triplicate. (B) Fluorescence emission spectra obtained for the peptidoglycan only control (green), lysozyme positive control (1 mg/mL) (Grey), ChiZ only control (0.16 mg/mL) (Red), and peptidoglycan treated with ChiZ (0.16 mg/mL) (Blue).
False positive results are produced by positively charged proteins
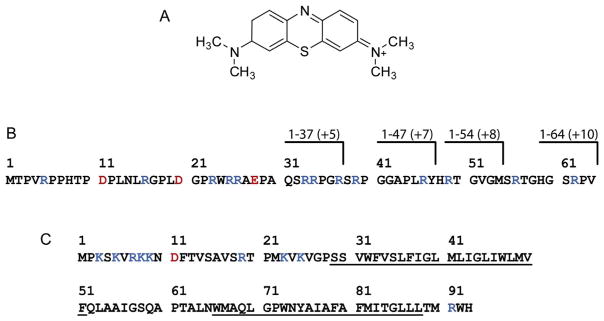
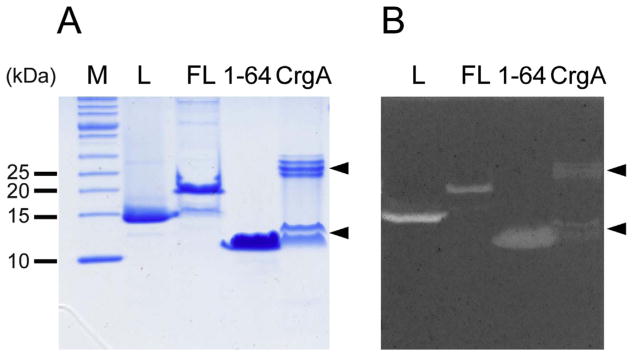
To understand how a false positive result can be produced it is necessary to understand how the zymogram assay works. This assay relies on staining PG with methylene blue, which forms a complex with peptidoglycan [12]. Thus, regions where peptidoglycan has been hydrolyzed, such as in the area of the hydrolase band, appear clear against the dark blue background. The nature of the interaction in the methylene blue-peptidoglycan complex appears to be electrostatic since methylene blue is a positively charged organic molecule (Fig. 3A) and peptidoglycan is a negatively charged biopolymer that is rich in acidic amino acids, such as glutamic acid and diaminopimelic acid in some cases. Based on this, it could be anticipated that proteins with a high net positive charge density could give a false positive result by simply repelling the methylene blue from an area of the gel where the protein band is located. In the case of the ChiZ N-terminal region this explanation seems reasonable since it has a +10 net charge resulting from 13 arginine residues and just 3 negatively charged residues (Fig. 3B). To test the idea that positively charged proteins can produce false positive results; a zymogram assay was performed using another membrane protein with a positively charged N-terminal region that is known not to be associated with PG metabolism. For this test the membrane protein CrgA from M. tuberculosis was selected, which has a +8 net charge, for which the N-terminal 25 amino acids has a +7 net charge and hence a high charge density (Fig. 3C). CrgA produced clear bands after staining with methylene blue (Fig. 4). This result supports the idea that positively charged proteins having a high charge density can produce false positive results in a zymogram assay.
Fig. 3.
Methylene blue chemical structure and protein amino acid sequences. (A) Chemical structure of methylene blue that shows it is a positively charged organic molecule. (B) Amino acid sequence of ChiZ N-terminal region. Charges of truncation constructs (1–37, 1–47, 1–54 and 1–64) are shown on top. (C) Amino acid sequence of CrgA membrane protein. The predicted transmembrane helices are underlined. Positively and negatively charged residues are highlighted in blue and red, respectively.
Fig. 4.
Zymogram assay for CrgA, ChiZ full length (FL) and ChiZ N-terminal region (1–64). A) SDS-PAGE of the proteins used for zymogram assay. B) Result of zymogram assay for ChiZ constructs and CrgA. Arrow heads show bands corresponding to CrgA, which can be seen as monomers and dimers. Lysozyme is included as a positive control (L).
Zymogram control assay
To further corroborate the hypothesis that positively charged proteins can produce clear bands, new shortened constructs of the N-terminal region of ChiZ were prepared (Fig. 3B). These new constructs have different numbers of arginine residues and net charge. It is expected that a minimum number of positive charges or charge cluster in the sequence may be identified as a requirement to produce false positive results. The zymogram results for these new constructs shows that all constructs show apparent activity, except the construct of residues 1–37 with the smallest number of charges (+5) (Fig. 5B).
Fig. 5.
Zymogram assays of truncated ChiZ N-terminal region. A) SDS PAGE of the proteins used for zymogram assay. B) Zymogram assay for each construct. C) Zymogram control assay performed without the refolding step. Lysozyme (L) and BSA were used as positive and negative controls, respectively.
Since positively charged proteins can produce clear bands, it would be useful to discriminate false positives from functional positive results. For that purpose, a small, but significant modification can be made to the zymogram procedure by removing the refolding step. Thus, it is expected that proteins that truly hydrolyze peptidoglycan will not be able to produce clear bands when unfolded. However, if the unfolded protein has a large enough net charge and or charge density similar to the intrinsically disordered ChiZ constructs then a false positive result will be achieved. Here, we refer to this assay as a zymogram control. Fig. 5C shows the result for this zymogram control performed for the different ChiZ N-terminal constructs and for unfolded lysozyme that failed to clear the gel despite having a net charge of +9 distributed over 137 residues. This Lysozyme result suggests that a protein or protein domain must have a substantial net positive charge or cluster of positive charges to produce a false positive result.
Based on these false positive results it is possible that running a zymogram assay with high concentrations of a positively charged protein could result in false positive results. The contribution of loading a variable amount of protein on the gel for the zymogram assay was tested using lysozyme and the ChiZ N-terminal region (Fig. 6). As expected, lysozyme is active over a broad range of protein loaded onto the gel, except with the smallest amount which provided no clearing in the gel image. However, denatured lysozyme does not clear the gel at any protein concentration used for the zymogram control. On the other hand, the ChiZ N-terminal region produces clear bands on both assays, in this case the intensity of the bands is proportional to the amount of protein loaded. This result supports the idea that not all positively charged proteins will produce a false positive, even when high amounts of protein are used.
Fig. 6.
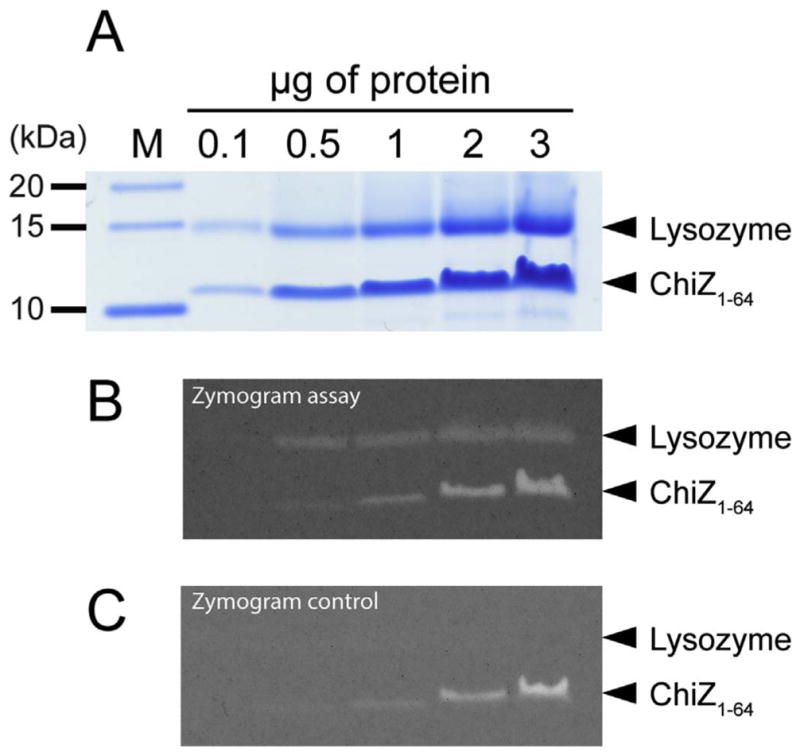
Zymogram assays of different amounts of lysozyme and ChiZ N-terminal region. A) SDS PAGE for Lysozyme and ChiZ N-terminal region (ChiZ1-64) with amounts loaded from 0.1 μg to 3 μg per lane. Zymogram assay and zymogram control loading with the same amounts of protein in B) and C), respectively.
Discussion
Peptidoglycan remodeling is essential for bacterial survival. Identification of the proteins involved in PG hydrolysis has been key to understanding important cellular processes, especially for cell elongation and cell division, where both PG hydrolysis and assembly occur. The zymogram assay has been used extensively to identify those proteins associated with PG hydrolysis, but not without some complications. As mentioned earlier, conflicts have arisen between the zymogram assay and other methods used to evaluate peptidoglycan hydrolysis. The SpoIID and EnvC proteins were described as peptidoglycan hydrolases based only on zymogram assays [6,8] and later those results were questioned by other experimental results [7,9]. However, in both cases, the results were reconciled with the explanation that protein binding to peptidoglycan may prevent methylene blue from staining the peptidoglycan where the protein is located. From this study it is proposed that highly positively charged proteins and potentially those that have a cluster of positive charges can prevent staining with methylene blue by electrostatic repulsion. Thus, the net charge at pH 7 for SpoIID is 13 while for EnvC is 18 and both sequences have high net positive charge densities of +5 over sequences of 10 and 13 residues. The results presented here suggest that the inconsistency among the peptidoglycan hydrolase assays for SpoIID and EnvC may result from their positive charges rather than a PG binding activity leading to a false positive zymogram assay result. However, the fact that denatured lysozyme does not produce band clearing on the zymogram control assay despite being a positively charged protein indicates that the net charge of a protein is not the only factor to consider in explaining false positive results. It is possible that as described here that a combination of net charge, charge distribution, and possibly the amount of protein used during the assay may influence the final result. Even though highly positively charged protein seem to influence the zymogram assay results, it is not possible to discount that protein binding to the peptidoglycan matrix may have an influence. Thus, our objective is not to fully explain the mechanism of interference, but to report the limitations of the assay and how to overcome them.
The demonstration that the zymogram assay is susceptible to producing false positive results suggest that the zymogram assay can not be used as the only or even the primary method to conclude that a protein is a peptidoglycan hydrolase. Thus, it is highly recommended to use additional methods to evaluate peptidoglycan hydrolysis, such as methods based on the detection of soluble hydrolysis products generated after incubating PG with the protein under study. For instance, amine functional groups of soluble hydrolysis products [13], radio-labeled peptidoglycan fragments [14,15], fluorescent labeled peptidoglycan fragments [10], or identification of hydrolysis products by HPLC or mass spectrometry can be detected [16–18]. In addition, this last method has proven essential to classify PG hydrolases depending on what bonds are cleaved during hydrolysis. We propose the use of the zymogram control as an easy tool to minimize false positives when characterizing new PG hydrolases. This method can be applied in parallel with the normal zymogram procedure. This zymogram control experiment can help to avoid the use of more time consuming and expensive methods to evaluate PG hydrolysis.
Conclusions
It was determined that the zymogram assay, used to evaluate peptidoglycan hydrolysis activity, is susceptible to false positive results. Evaluation of the possible causes that could produce a false positive result indicate that highly positively charged proteins can repel methylene blue from binding to peptidoglycan. However, net positively charge proteins do not predict a false positive result, such as in the case of lysozyme, while it was shown, as examples, that ChiZ and CrgA N-terminal regions were able to produce false positive results. Thus, a zymogram control was developed. This control lacks the refolding step where peptidoglycan is hydrolyzed so proteins with real peptidoglycan hydrolysis activity such as lysozyme do not produce clear bands. Given the limitation of the zymogram assay described here, we recommend supplementing the identification of new peptidoglycan hydrolases with other biochemical and analytical methods.
Acknowledgments
This work was supported by NIH grant AI-119178. Dr. Malini Rajagopalan is acknowledged for providing M. tuberculosis peptidoglycan samples and helpful discussions and collaborations over many years.
References
- 1.Vollmer W, Joris B, Charlier P, Foster S. Bacterial peptidoglycan (murein) hydrolases. FEMS Microbiol Rev. 2008;32:259–286. doi: 10.1111/j.1574-6976.2007.00099.x. [DOI] [PubMed] [Google Scholar]
- 2.Leclerc D, Asselin A. Detection of bacterial cell wall hydrolases after denaturing polyacrylamide gel electrophoresis. Can J Microbiol. 1989;35:749–753. doi: 10.1139/m89-125. [DOI] [PubMed] [Google Scholar]
- 3.Bernadsky G, Beveridge TJ, Clarke AJ. Analysis of the sodium dodecyl sulfate-stable peptidoglycan autolysins of select gram-negative pathogens by using renaturing polyacrylamide gel electrophoresis. J Bacteriol. 1994;176:5225–5232. doi: 10.1128/jb.176.17.5225-5232.1994. [DOI] [PMC free article] [PubMed] [Google Scholar]
- 4.Bartual SG, Straume D, Stamsås GA, Muñoz IG, Alfonso C, Martínez-Ripoll M, Håvarstein LS, Hermoso JA. Structural basis of PcsB-mediated cell separation in Streptococcus pneumoniae. Nat Commun. 2014;5:3842. doi: 10.1038/ncomms4842. [DOI] [PubMed] [Google Scholar]
- 5.Marcyjaniak M, Odintsov SG, Sabala I, Bochtler M. Peptidoglycan amidase MepA is a LAS metallopeptidase. J Biol Chem. 2004;279:43982–43989. doi: 10.1074/jbc.M406735200. [DOI] [PubMed] [Google Scholar]
- 6.Abanes-De Mello A, Sun YL, Aung S, Pogliano K. A cytoskeleton-like role for the bacterial cell wall during engulfment of the Bacillus subtilis forespore. Gene Dev. 2002;16:3253–3264. doi: 10.1101/gad.1039902. [DOI] [PMC free article] [PubMed] [Google Scholar]
- 7.Morlot C, Uehara T, Marquis KA, Bernhardt TG, Rudner DZ. A highly coordinated cell wall degradation machine governs spore morphogenesis in Bacillus subtilis. Gene Dev. 2010;24:411–422. doi: 10.1101/gad.1878110. [DOI] [PMC free article] [PubMed] [Google Scholar]
- 8.Bernhardt TG, de Boer PA. Screening for synthetic lethal mutants in Escherichia coli and identification of EnvC (YibP) as a periplasmic septal ring factor with murein hydrolase activity. Mol Microbiol. 2004;52:1255–1269. doi: 10.1111/j.1365-2958.2004.04063.x. [DOI] [PMC free article] [PubMed] [Google Scholar]
- 9.Uehara T, Parzych KR, Dinh T, Bernhardt TG. Daughter cell separation is controlled by cytokinetic ring-activated cell wall hydrolysis. EMBO J. 2010;29:1412–1422. doi: 10.1038/emboj.2010.36. [DOI] [PMC free article] [PubMed] [Google Scholar]
- 10.Chauhan A, Lofton H, Maloney E, Moore J, Fol M, Madiraju MV, Rajagopalan M. Interference of Mycobacterium tuberculosis cell division by Rv2719c, a cell wall hydrolase. Mol Microbiol. 2006;62:132–147. doi: 10.1111/j.1365-2958.2006.05333.x. [DOI] [PubMed] [Google Scholar]
- 11.Vadrevu IS, Lofton H, Sarva K, Blasczyk E, Plocinska R, Chinnaswamy J, Madiraju M, Rajagopalan M. ChiZ levels modulate cell division process in mycobacteria. Tuberculosis (Edinb) 2011;91(Suppl 1):S128–S135. doi: 10.1016/j.tube.2011.10.022. [DOI] [PMC free article] [PubMed] [Google Scholar]
- 12.Manchenko GP. Handbook of Detection of Enzymes on Electrophoretic Gels. 2. CRC Press; Boca Raton: 2003. [Google Scholar]
- 13.Ohnishi R, Ishikawa S, Sekiguchi J. Peptidoglycan hydrolase LytF plays a role in cell separation with CwlF during vegetative growth of Bacillus subtilis. J Bacteriol. 1999;181:3178–3184. doi: 10.1128/jb.181.10.3178-3184.1999. [DOI] [PMC free article] [PubMed] [Google Scholar]
- 14.Deng LL, Humphries DE, Arbeit RD, Carlton LE, Smole SC, Carroll JD. Identification of a novel peptidoglycan hydrolase CwlM in Mycobacterium tuberculosis. Biochim Biophys Acta. 2005;1747:57–66. doi: 10.1016/j.bbapap.2004.09.021. [DOI] [PubMed] [Google Scholar]
- 15.Zahrl D, Wagner M, Bischof K, Bayer M, Zavecz B, Beranek A, Ruckenstuhl C, Zarfel GE, Koraimann G. Peptidoglycan degradation by specialized lytic transglycosylases associated with type III and type IV secretion systems. Microbiology. 2005;151:3455–3467. doi: 10.1099/mic.0.28141-0. [DOI] [PubMed] [Google Scholar]
- 16.Sudiarta IP, Fukushima T, Sekiguchi J. Bacillus subtilis CwlP of the SP-{beta} prophage has two novel peptidoglycan hydrolase domains, muramidase and cross-linkage digesting DD-endopeptidase. J Biol Chem. 2010;285:41232–41243. doi: 10.1074/jbc.M110.156273. [DOI] [PMC free article] [PubMed] [Google Scholar]
- 17.Claes IJ, Schoofs G, Regulski K, Courtin P, Chapot-Chartier MP, Rolain T, Hols P, von Ossowski I, Reunanen J, de Vos WM, Palva A, Vanderleyden J, De Keersmaecker SC, Lebeer S. Genetic and biochemical characterization of the cell wall hydrolase activity of the major secreted protein of Lactobacillus rhamnosus GG. PLoS One. 2012;7:e31588. doi: 10.1371/journal.pone.0031588. [DOI] [PMC free article] [PubMed] [Google Scholar]
- 18.Anzengruber J, Courtin P, Claes IJ, Debreczeny M, Hofbauer S, Obinger C, Chapot-Chartier MP, Vanderleyden J, Messner P, Schäffer C. Biochemical characterization of the major N-acetylmuramidase from Lactobacillus buchneri. Microbiology. 2014;160:1807–1819. doi: 10.1099/mic.0.078162-0. [DOI] [PMC free article] [PubMed] [Google Scholar]


