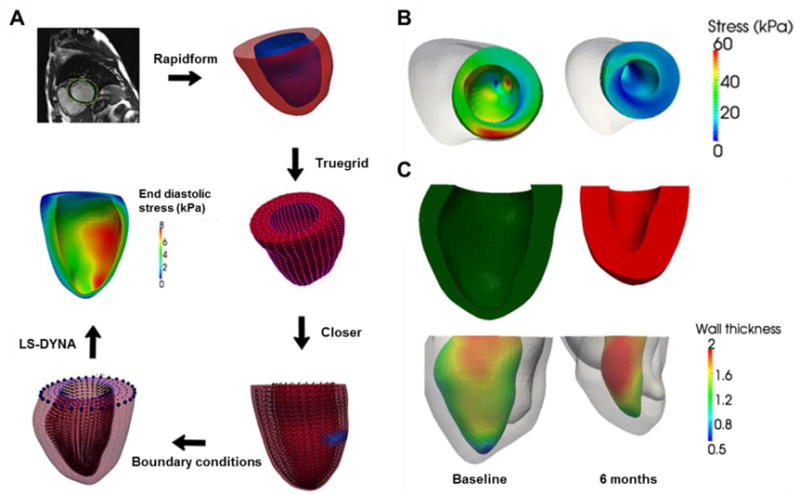
Figure 2.

(A) Process of quantification of left ventricular wall stress from MRI characterization to FE modeling results [20]. Rapidform, Truegrid, Closer and LS-DYNA are software routines implemented to achieve the next step. (B) Calculated end-systolic regional myofiber stress distribution at baseline (left) and 6 months after injection (right) in a patient [21]. (C) Top: LV cross-section view at baseline (left) and 6 months (right). Bottom: regional LV wall thickness measured based on the MRI-reconstructed LV geometry of the same patient in (B) [21]. Wall thickness unit: cm.
