

Abstract
Objective
Barrett’s esophagus (BE) increases the risk of esophageal adenocarcinoma (EA) by 10–55 times that of the general population, but no community-based cancer-specific incidence and cause-specific mortality risk estimates exist for large cohorts in the United States.
Design
Within Kaiser Permanente Northern California (KPNC), we identified BE patients diagnosed during 1995-2012. KPNC cancer registry and mortality files were used to estimate standardized incidence ratios (SIR), standardized mortality ratios (SMR), and excess absolute risks.
Results
There were 8,929 BE subjects providing 50,147 person-years of follow-up. Compared to the greater KPNC population, BE patients had increased risks of any cancer (SIR=1.40, 95%CI:1.31-1.49) which slightly decreased after excluding esophageal cancer. Esophageal adenocarcinoma risk was increased 24-times, which translated into an excess absolute risk of 24 cases per 10,000 person-years. Although esophageal adenocarcinoma risk decreased with time since Barrett’s esophagus diagnosis, esophageal cancer mortality did not, indicating that the true risk is stable and persistent with time. Relative risks of cardia and stomach cancers were increased, but excess absolute risks were modest. Risks of colorectal, lung, and prostate cancers were unaltered. All-cause mortality was slightly increased after excluding esophageal cancer (SMR=1.24, 95%CI:1.18-1.31), but time-stratified analyses indicated that this was likely attributable to diagnostic bias. Cause-specific SMRs were elevated for ischemic heart disease (SMR=1.39, 95%CI:1.18-1.63), respiratory system diseases (SMR=1.51, 95%CI:1.29-1.75), and digestive system diseases (SMR=2.20 95%CI:1.75-2.75).
Conclusion
BE patients had a persistent excess risk of esophageal adenocarcinoma over time, although their absolute excess risks for this cancer, any cancer, and overall mortality were modest.
Keywords: Barrett’s Esophagus, Cohort Studies, Risk
Introduction
Barrett’s esophagus markedly increases the relative risk for esophageal adenocarcinoma, with estimates ranging from 10- to 55-fold that of the general population,[1–7] which translates to an absolute annual risk of approximately 0.5%, or 1/200 person-years.[8, 9] However, what is less well understood are the absolute and relative risks of extra-esophageal malignancies as well as cause-specific death in individuals diagnosed with this precancerous lesion. Attaining population-specific estimates of such are essential for developing comprehensive disease-prevention interventions, scientific understanding, risk communication, and to provide an evidence-base to guide clinical decision-making.
Previous Barrett’s esophagus cohorts for which site-specific cancer risks have been assessed have been based in the UK[7, 10] and the Netherlands,[11] while assessment of underlying causes of death have been conducted for cohorts in the UK,[7, 12–15] Northern Ireland,[16] and the Netherlands.[11] These studies reported variable risks for incidences of site-specific cancers as well as underlying causes of death relative to the general population, some of which may be attributable to population (geographic) heterogeneity of disease and associated risk factors. For example, there have been disparate results regarding whether colorectal cancer risk or cardiovascular disease is increased in individuals with Barrett’s esophagus. If these relationships are substantiated by larger, population-specific studies, then this may provide an evidence base for additional clinical interventions. Herein we present the first comprehensive study of cancer incidence and mortality risks in a large US Barrett’s esophagus cohort.
Methods
Study Population
Kaiser Permanente Northern California (KPNC) is an integrated health services delivery organization. KPNC includes, in any given year, more than 3.3 million members (approximately one third of the insured population in the region). Research within this setting encompasses 20 medical centers in urban, suburban, and semirural regions across a large geographic area, plus additional free-standing offices and endoscopy units. The membership demographics closely approximate the diverse underlying census population of Northern California, including members with Medicare, Medicaid (low-income), and commercial insurance; thus, studies within this setting provide results that can be generalized to a large region and general populations.[17, 18]
Barrett’s esophagus subjects diagnosed at KPNC at ages 18 years and older during 1995 through 2012 were eligible for selection into the cohort. Codes for a diagnosis of Barrett’s esophagus include: the International Classification of Disease 9th revision (ICD-9) code 530.2 “Barrett’s ulcer”, which on KPNC endoscopy reporting sheets was specified as “Barrett’s esophagitis”; ICD-9 code 530.85 “Barrett’s esophagus”, which was introduced in 2003 and replaced 530.2; and the Systematized Nomenclature of Medicine (SNOMED) code M73330 (Barrett’s esophagus). SNOMED codes are used by the pathology departments for assigning specific histologic diagnoses to biopsy specimens. For this study, Barrett’s esophagus was defined as: at least one instance of the Barrett’s esophagus-specific ICD-9 code 530.85 or; at least one instance of ICD-9 code 530.2 and one instance of SNOMED code M73330, the latter combination of which we have shown to accurately classify Barrett’s esophagus subjects in a smaller cohort which overlaps with the current study cohort.[19] We used the first instance of any of these codes as the index diagnosis date of Barrett’s esophagus for all analyses. A sensitivity analysis was conducted in which we excluded Barrett’s esophagus subjects who were diagnosed with esophageal adenocarcinoma within six months of their Barrett’s esophagus diagnosis date and Barrett’s esophagus subjects who did not have six months of continual follow-up immediately following their Barrett’s esophagus diagnosis date. We also conducted sensitivity analyses using a less specific Barrett’s esophagus definition of ICD-9 codes 530.85 or 530.2, without any requirement for SNOMED code M73330. Barrett’s esophagus subjects were ineligible for analysis if they: had any cancer diagnosis (excluding skin cancer) prior to their Barrett’s esophagus diagnosis date; had no diagnosis date associated with a cancer diagnosis; had no enrollment information; or had unknown sex. The project and analyses were approved by the KPNC Institutional Review Board.
Variables for Analysis
For each Barrett’s esophagus subject, we extracted from electronic databases: all instances and dates of ICD-9 codes 530.85 and 530.2, and SNOMED code M73330; date of birth; sex; membership gaps; cancer diagnoses; and mortality data. Pathology data were from a comprehensive clinical source that includes all biopsies and their assigned SNOMED histological diagnoses. Categories of cancer and death outcomes were identified a priori based on prior literature and are shown in the results tables. Data tables of rates for the KPNC population were based on these outcome categories to provide the expected number of outcomes in the underlying population. Cancer diagnoses (date, ICD-O-3 codes for site and histology) were extracted from the KPNC cancer registry which reports to the Surveillance, Epidemiology and End Results (SEER) registry. Causes of death (ICD-9/ICD-10)—including the underlying cause—and date of death were extracted from KPNC mortality files which use standard probabilistic matching algorithms to state death certificate data and federal death files.
Statistical Analysis
We compared the cancer incidence and mortality experience of the Barrett’s esophagus cohort with expected rates from the greater KPNC population using indirect standardization (comparison with an external standard) with stratification by sex, age (0–4, 5–9, 10–14,…, 95–99, 100+ years), and calendar year (single years). For cancer incidence (SIR) analyses, follow-up started at Barrett’s esophagus diagnosis and ceased at the earliest of time of event, death, last disenrollment, or study end (12/31/2013). Follow-up time was restricted to enrolled periods (i.e., membership gaps were excluded) because cancer incidences—for the Barrett’s esophagus cohort and the total KPNC population—were only captured during enrollment. Individuals were not right-censored at a cancer diagnosis when that cancer diagnosis was not the outcome of interest. Follow-up time for mortality (SMR) analyses was similarly constructed with the only difference being that one year was added to the last disenrollment date, given that a large number of deaths coincided with this period; KPNC population death tables were similarly constructed. We estimated relative risks, in the form of standardized incidence ratios (SIR) and standardized mortality ratios (SMR), and their respective 95% confidence intervals (95%CI). We also estimated risks stratified by time since Barrett’s esophagus diagnosis using the cut-points of 3 and 6 years which were the approximate 33rd and 66th percentiles of follow-up time for the cohort. For the main analysis, we estimated excess absolute risks as the excess number of cancers per 10,000 Barrett’s esophagus person-years (observed – expected/person-years * 10,000). Lastly, we used fixed effects meta-analytic methods to combine relative risks of prior studies with those from our KPNC study reported herein. All analyses were conducted using Stata software version 13.1 (StataCorp LP, College Station, TX).
Results
Primary Analysis
There were 8,929 eligible Barrett’s esophagus subjects for analysis, including 5,854 (66%) males, resulting in a male-to-female sex ratio of 1.9:1. The mean age at Barrett’s esophagus diagnosis was 61.1 years (standard deviation=13.2) and there were a total of 50,147 years of follow-up providing for an average of 5.6 years (standard deviation=4.1) per Barrett’s esophagus subject.
Cancer
Individuals diagnosed with Barrett’s esophagus had a 40% increased risk of any malignant neoplasm excluding skin cancer, compared with the total KPNC population (Table 1 & Figure 1, SIR=1.40, 95%CI:1.31, 1.49). This increased risk was attenuated to 23%, but remained statistically significant, after exclusion of esophageal cancers (SIR=1.23, 95%CI:1.14, 1.31). The excess absolute risk of any malignant neoplasm excluding skin cancer was 57 cancers per 10,000 Barrett’s esophagus person-years, but reduced to 32 cancers when esophageal cancers were excluded (Figure 2). Importantly, time period specific risks for any malignant neoplasm were elevated only for the first time period assessed (0-<3 years) post-Barrett’s esophagus diagnosis and not thereafter (Table 2).
Table 1.
Standardized incidence ratios and excess absolute risks per 10,000 person-years for the Barrett’s esophagus cohort1, overall and by sex
| Total | Male | Female | |||||||||||||
|---|---|---|---|---|---|---|---|---|---|---|---|---|---|---|---|
|
| |||||||||||||||
| Cancer incidence (ICD-O-3 site & histology codes) | Observed | Expected | Person-years | SIR (95% CI) | EAR (95% CI) | Observed | Expected | Person-years | SIR (95% CI) | EAR (95% CI) | Observed | Expected | Person-years | SIR (95% CI) | EAR (95% CI) |
| All malignant neoplasms (C000-C970) excluding skin cancer (C440-449) | 919 | 658.64 | 45,643 | 1.40 (1.31, 1.49) | 57 (50, 64) | 668 | 466.13 | 30,730 | 1.43 (1.33, 1.55) | 66 (57, 75) | 251 | 192.50 | 14,913 | 1.30 (1.15, 1.48) | 39 (29, 49) |
| All malignant neoplasms (C000-C970) excluding skin cancer (C440-C449) and esophageal cancer (C150-159) | 805 | 657.28 | 45,965 | 1.23 (1.14, 1.31) | 32 (27, 37) | 575 | 464.82 | 31,005 | 1.24 (1.14, 1.34) | 36 (29, 42) | 230 | 192.46 | 14,960 | 1.20 (1.05, 1.36) | 25 (17, 33) |
| Malignant neoplasms of digestive organs (C150-C260) | 345 | 134.13 | 47,621 | 2.57 (2.31, 2.86) | 44 (38, 50) | 269 | 99.79 | 32,106 | 2.70 (2.38, 3.04) | 53 (45, 61) | 76 | 34.34 | 15,515 | 2.21 (1.74, 2.77) | 27 (19, 35) |
| Malignant neoplasms of digestive organs excluding esophagus (C160-C260) | 218 | 127.44 | 47,973 | 1.71 (1.49, 1.95) | 19 (15, 23) | 164 | 93.85 | 32,409 | 1.75 (1.49, 2.04) | 22 (17, 27) | 54 | 33.60 | 15,564 | 1.61 (1.21, 2.10) | 13 (7, 19) |
| Malignant neoplasms of the esophagus (C150-C159) | 133 | 8.14 | 48,113 | 16.34 (13.68, 19.37) | 26 (21, 31) | 110 | 7.21 | 32,471 | 15.27 (12.55, 18.40) | 32 (26, 38) | 23 | 0.93 | 15,641 | 24.69 (15.65, 37.05) | 14 (8, 20) |
| Malignant neoplasms of the stomach (C160-C169) | 57 | 13.08 | 48,341 | 4.36 (3.30, 5.64) | 9 (6, 12) | 47 | 10.60 | 32,676 | 4.43 (3.26, 5.89) | 11 (8, 15) | 10 | 2.48 | 15,665 | 4.03 (1.93, 7.42) | 5 (1, 8) |
| Malignant neoplasms of the esophagus (C150-C159) and stomach (C160-C169) | 188 | 21.03 | 47,976 | 8.94 (7.71, 10.31) | 35 (30, 40) | 156 | 17.63 | 32,360 | 8.85 (7.51, 10.35) | 43 (36, 50) | 32 | 3.40 | 15,617 | 9.42 (6.45, 13.30) | 18 (12, 25) |
| Malignant neoplasms of the cardia (C160) | 45 | 4.30 | 48,371 | 10.48 (7.64, 14.02) | 8 (6, 11) | 41 | 3.89 | 32,687 | 10.53 (7.56, 14.29) | 11 (8, 15) | 4 | 0.40 | 15,684 | 9.94 (2.71, 25.46) | 2 (0, 5) |
| Malignant neoplasms of the esophagus (C150-C159) or cardia (C160) | 177 | 12.34 | 48,007 | 14.34 (12.30, 16.61) | 34 (29, 40) | 150 | 11.01 | 32,371 | 13.62 (11.53, 15.98) | 43 (36, 50) | 27 | 1.33 | 15,636 | 20.28 (13.37, 29.51) | 16 (10, 23) |
| Esophageal adenocarcinoma (C150-C159 & 8140-8575) | 121 | 5.07 | 48,136 | 23.86 (19.80, 28.51) | 24 (20, 28) | 102 | 4.75 | 32,486 | 21.46 (17.50, 26.05) | 30 (24, 36) | 19 | 0.32 | 15,650 | 59.61 (35.89, 93.09) | 12 (7, 17) |
| Malignant neoplasms of the colon, rectosigmoid junction and anus (C180-C219) | 86 | 76.43 | 48,199 | 1.13 (0.90, 1.39) | 2 (1, 3) | 59 | 54.77 | 32,587 | 1.08 (0.82, 1.39) | 1 (0, 3) | 27 | 21.66 | 15,613 | 1.25 (0.82, 1.81) | 3 (1, 6) |
| Malignant neoplasms of the trachea, bronchus, and lung (C330-C349) | 101 | 85.93 | 48,325 | 1.18 (0.96, 1.43) | 3 (2, 5) | 71 | 61.20 | 32,708 | 1.16 (0.91, 1.46) | 3 (1, 5) | 30 | 24.73 | 15,618 | 1.21 (0.82, 1.73) | 3 (0, 6) |
| Malignant neoplasms of the prostate (C619) | 180 | 167.67 | 31,951 | 1.07 (0.92, 1.24) | 4 (2, 6) | 180 | 167.67 | 31,951 | 1.07 (0.92, 1.24) | 4 (2, 6) | |||||
Barrett’s esophagus defined as ICD-9 code 530.85, or 530.2 with SNOMED M73330.
Abbreviations: CI, confidence interval; EAR, excess absolute risk; ICD-O, International Classification of Diseases for Oncology; SIR, standardized incidence ratio.
Figure 1.
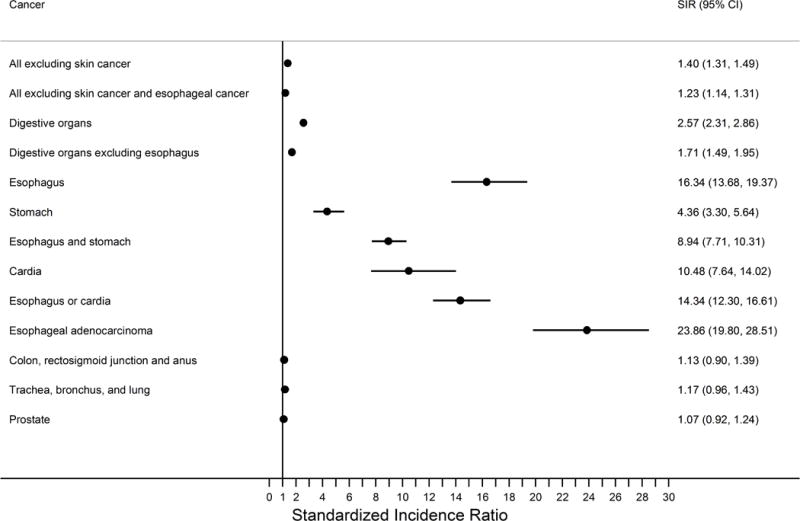
Forest plot summarizing the standardized incidence ratios of cancer risk in the Barrett’s esophagus cohort relative to the greater KPNC population.
The filled circles represent the risk estimates on a linear scale while the horizontal lines demarcate the extent of the 95% confidence intervals. The vertical line demarcates the null hypothesis. Abbreviations: CI, confidence interval; KPNC, Kaiser Permanente Northern California; SIR, standardized incidence ratio.
Figure 2.
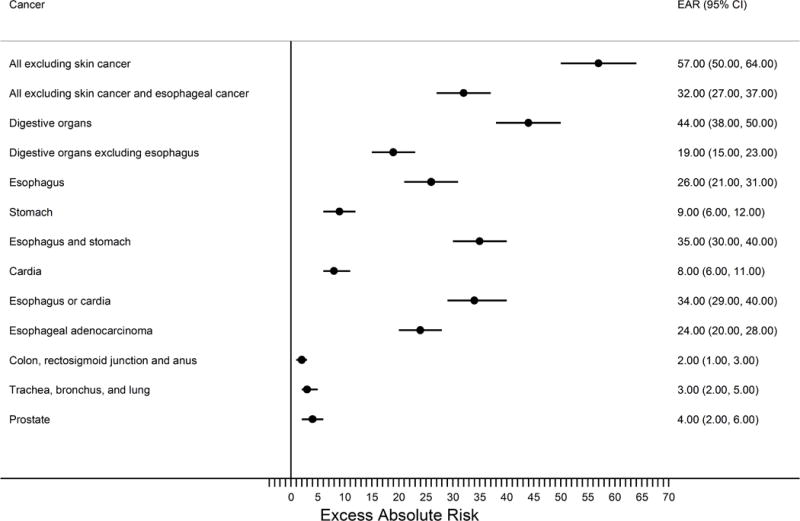
Forest plot summarizing the excess absolute cancer risks per 10,000 person years for the Barrett’s esophagus cohort relative to the greater KPNC population.
The filled circles represent the risk estimates on a linear scale while the horizontal lines demarcate the extent of the 95% confidence intervals. The vertical line demarcates the null hypothesis. Abbreviations: CI, confidence interval; EAR, excess absolute risk; KPNC, Kaiser Permanente Northern California.
Table 2.
Standardized incidence ratios for the Barrett’s esophagus cohort1, stratified by follow-up time post-Barrett’s esophagus diagnosis
| 0 to <3 Years | ≥3 to <6 Years | ≥6 Years | ||||||||||
|---|---|---|---|---|---|---|---|---|---|---|---|---|
|
| ||||||||||||
| Cancer incidence (ICD-O-3 site & histology codes) | Observed | Expected | Person-years | SIR (95% CI) | Observed | Expected | Person-years | SIR (95% CI) | Observed | Expected | Person-years | SIR (95% CI) |
| All malignant neoplasms (C000-C970) excluding skin cancer (C440-449) | 499 | 286.29 | 21,505 | 1.74 (1.59, 1.90) | 200 | 177.58 | 12,240 | 1.13 (0.98, 1.29) | 220 | 194.66 | 11,898 | 1.13 (0.99, 1.29) |
| All malignant neoplasms (C000-C970) excluding skin cancer (C440-C449) and esophageal cancer (C150-159) | 434 | 285.03 | 21,593 | 1.52 (1.38, 1.67) | 177 | 177.47 | 12,336 | 1.00 (0.86, 1.16) | 194 | 194.78 | 12,036 | 1.00 (0.86, 1.15) |
| Malignant neoplasms of digestive organs (C150-C260) | 203 | 55.39 | 21,879 | 3.67 (3.18, 4.21) | 73 | 35.95 | 12,779 | 2.03 (1.59, 2.55) | 69 | 42.79 | 12,963 | 1.61 (1.25, 2.04) |
| Malignant neoplasms of digestive organs excluding esophagus (C160-C260) | 134 | 52.57 | 21,971 | 2.55 (2.14, 3.02) | 43 | 34.20 | 12,885 | 1.26 (0.91, 1.69) | 41 | 40.67 | 13,116 | 1.01 (0.72, 1.37) |
| Malignant neoplasms of the esophagus (C150-C159) | 70 | 3.21 | 22,047 | 21.81 (17.00, 27.55) | 31 | 2.20 | 12,931 | 14.11 (9.58, 20.02) | 32 | 2.73 | 13,135 | 11.72 (8.02, 16.55) |
| Malignant neoplasms of the stomach (C160-C169) | 36 | 5.39 | 22,089 | 6.68 (4.68, 9.25) | 9 | 3.53 | 12,997 | 2.55 (1.17, 4.84) | 12 | 4.17 | 13,255 | 2.88 (1.49, 5.03) |
| Malignant neoplasms of the esophagus (C150-C159) and stomach (C160-C169) | 105 | 8.55 | 21,996 | 12.29 (10.05, 14.87) | 40 | 5.66 | 12,890 | 7.07 (5.05, 9.62) | 43 | 6.82 | 13,090 | 6.31 (4.56, 8.50) |
| Malignant neoplasms of the cardia (C160) | 27 | 1.77 | 22,100 | 15.29 (10.07, 22.24) | 7 | 1.16 | 13,006 | 6.03 (2.43, 12.43) | 11 | 1.37 | 13,266 | 8.04 (4.01, 14.38) |
| Malignant neoplasms of the esophagus (C150-C159) or cardia (C160) | 96 | 4.95 | 22,007 | 19.39 (15.71, 23.68) | 38 | 3.33 | 12,899 | 11.41 (8.07, 15.66) | 43 | 4.06 | 13,101 | 10.58 (7.66, 14.25) |
| Esophageal adenocarcinoma (C150-C159 & 8140-8575) | 62 | 1.96 | 22,060 | 31.66 (24.27, 40.59) | 30 | 1.37 | 12,939 | 21.94 (14.80, 31.32) | 29 | 1.75 | 13,137 | 16.62 (11.13, 23.86) |
| Malignant neoplasms of the colon, rectosigmoid junction and anus (C180-C219) | 55 | 31.94 | 22,055 | 1.72 (1.30, 2.24) | 15 | 20.55 | 12,958 | 0.73 (0.41, 1.20) | 16 | 23.95 | 13,187 | 0.67 (0.38, 1.08) |
| Malignant neoplasms of the trachea, bronchus, and lung (C330-C349) | 51 | 35.13 | 22,095 | 1.45 (1.08, 1.91) | 23 | 23.23 | 12,994 | 0.99 (0.63, 1.49) | 27 | 27.56 | 13,237 | 0.98 (0.65, 1.43) |
| Malignant neoplasms of the prostate (C619) | 81 | 72.44 | 14,449 | 1.12 (0.89, 1.39) | 41 | 45.08 | 8,488 | 0.91 (0.65, 1.23) | 58 | 50.16 | 9,014 | 1.16 (0.88, 1.49) |
Barrett’s esophagus defined as ICD-9 code 530.85, or 530.2 with SNOMED M73330.
Abbreviations: CI, confidence interval; EAR, excess absolute risk; ICD-O, International Classification of Diseases for Oncology; SIR, standardized incidence ratio.
There were 121 esophageal adenocarcinomas diagnosed in this Barrett’s esophagus cohort resulting in a 24-times increased risk relative to the greater KPNC population and an excess absolute risk of 24 cancers per 10,000 person-years. The crude incidence rate of esophageal adenocarcinoma in this Barrett’s esophagus cohort was 2.5 per 1,000 person-years (95%CI: 2.1, 3.0) which translates to a crude absolute annual risk of 0.25% (95%CI: 0.21%, 0.30%). Esophageal cancer overall (including squamous cell carcinoma and other esophageal malignancies) had a slightly lower relative risk (SIR) of 16 compared with the total KPNC population, which decreased further when assessed as a joint outcome of either all esophageal plus all stomach cancers (including cardia) (SIR=8.94) or all esophageal cancers plus cardia cancers (SIR=14.34). Cardia cancer alone had an SIR of 10.48, and any stomach cancer (including cardia) an SIR of 4.36. Non-cardia gastric cancer risk was not altered in this Barrett’s esophagus cohort when we assessed this outcome as malignant neoplasms of the stomach (C160-C169) excluding cardia (C160) and overlapping sites (C168) (SIR=1.49, 95%CI:0.77, 2.60) or when we additionally excluded unspecified (C169) malignancies (SIR=1.10, 95%CI: 0.44, 2.27) (results not tabulated). Importantly, risks for all categories of upper gastrointestinal malignancies decreased with time since Barrett’s esophagus diagnosis (Table 2); for example, the SIRs for esophageal adenocarcinoma were 31.66 for 0-< 3 years, 21.94 for 3-<6 years, and 16.62 for ≥6 years.
Risk of colon, rectosigmoid, and anal cancers; trachea, bronchus, and lung cancers; and prostate cancers were not altered in this Barrett’s esophagus cohort compared with the greater KPNC population (Table 1 & Figure 1), although SIRs for each of first two grouping were elevated only in the first period (0-<3 years) of time following Barrett’s esophagus diagnosis (Table 2).
Cancer risks were comparable between males and females with Barrett’s esophagus, with the exception that the relative risk for esophageal adenocarcinoma was much higher for female Barrett’s esophagus subjects (SIR=59.61) compared with male Barrett’s esophagus subjects (SIR=21.46), a difference mainly driven by the much lower expected numbers in females relative to males (Supplemental Figure 1). The excess absolute number of esophageal adenocarcinomas per 10,000 person-years attributable to Barrett’s esophagus was much lower in females relative to males (estimated absolute risk 12 vs. 30, respectively) (Table 1 & Supplemental Figure 2).
Mortality
Using the SEER Cause of Death Recode classification system1, the leading causes of death for patients with Barrett’s esophagus were diseases of the heart (n=348; 24%), other (includes numerous non-malignant conditions: n=205; 14%), digestive system cancer (n=186; 13%), chronic obstructive pulmonary disease and allied conditions (n=98; 7%), cerebrovascular disease (n=71; 5%), and respiratory system cancer (n=68; 5%).
Barrett’s esophagus subjects had an increased overall risk of death of 31% compared with the total KPNC population (SMR=1.31; Table 3 & Figure 3) which translated to 69 excess deaths per 10,000 person-years. A majority of this excess absolute risk remained for any cause of death after excluding esophageal cancer deaths (Table 3 & Figure 4). However, these excess risks decreased with time since Barrett’s esophagus diagnosis and were no longer evident after 6 years when esophageal malignancy was excluded (Table 4).
Table 3.
Standardized mortality ratios and excess absolute risks per 10,000 person-years for the Barrett’s esophagus cohort1, overall and by sex
| Total | Male | Female | |||||||||||||
|---|---|---|---|---|---|---|---|---|---|---|---|---|---|---|---|
|
| |||||||||||||||
| Underlying cause of death (ICD-9 codes; ICD-10 codes) | Observed | Expected | Person-years | SMR (95% CI) | EAR (95% CI) | Observed | Expected | Person-years | SMR (95% CI) | EAR (95% CI) | Observed | Expected | Person-years | SMR (95% CI) | EAR (95% CI) |
| All causes (001-E999; A00-R99,V01-Y89) | 1461 | 1114.69 | 50,147 | 1.31 (1.24, 1.38) | 69 (62, 76) | 1037 | 797.07 | 33,858 | 1.30 (1.22, 1.38) | 71 (62, 80) | 424 | 317.62 | 16,288 | 1.34 (1.21, 1.47) | 65 (53, 78) |
| All causes (001-E999; A00-R99,V01-Y89) excluding esophageal malignancy (150.0-150.9; C15) | 1376 | 1106.36 | 50,147 | 1.24 (1.18, 1.31) | 54 (47, 60) | 969 | 789.59 | 33,858 | 1.23 (1.15, 1.31) | 53 (45, 61) | 407 | 316.77 | 16,288 | 1.29 (1.16, 1.42) | 55 (44, 67) |
| Neoplastic mortality (140-239, 273-273.3, 273.9; C00-D48) | 384 | 307.73 | 50,147 | 1.25 (1.13, 1.38) | 15 (12, 19) | 291 | 224.29 | 33,858 | 1.30 (1.15, 1.46) | 20 (15, 24) | 93 | 83.44 | 16,288 | 1.12 (0.90, 1.37) | 6 (2, 10) |
| All neoplasms (140-149, 151-239, 273-273.3, 273.9; C00-C14, C16-D48) excluding esophageal cancer (150.0-150.9; C15) | 299 | 299.40 | 50,147 | 1.00 (0.89, 1.12) | 0 (0, 0) | 223 | 216.81 | 33,858 | 1.03 (0.90, 1.17) | 2 (0, 3) | 76 | 82.59 | 16,288 | 0.92 (0.73, 1.15) | −4 (−7, −1) |
| Malignant neoplasms of the esophagus (150.0-150.9; C15) | 85 | 8.33 | 50,147 | 10.20 (8.15, 12.61) | 15 (12, 19) | 68 | 7.48 | 33,858 | 9.09 (7.06, 11.53) | 18 (13, 22) | 17 | 0.85 | 16,288 | 19.90 (11.59, 31.86) | 10 (5, 15) |
| Malignant neoplasms of the stomach (151.0-151.9; C16) | 8 | 7.43 | 50,147 | 1.08 (0.47, 2.12) | 0 (0, 0) | 5 | 5.94 | 33,858 | 0.84 (0.27, 1.96) | 0 (−1, 0) | 3 | 1.49 | 16,288 | 2.02 (0.42, 5.89) | 1 (−1, 2) |
| Malignant neoplasms of the esophagus (150.0-150.9; C15) or stomach (151.0-151.9; C16, C26.9) | 95 | 15.76 | 50,147 | 6.03 (4.88, 7.37) | 16 (12, 19) | 75 | 13.42 | 33,858 | 5.59 (4.40, 7.01) | 18 (14, 23) | 20 | 2.34 | 16,288 | 8.54 (5.22, 13.19) | 11 (6, 16) |
| Malignant neoplasms of the trachea, bronchus, and lung (162.0-162.9; C33-C34) | 65 | 74.24 | 50,147 | 0.88 (0.68, 1.12) | −2 (−3, −1) | 51 | 54.09 | 33,858 | 0.94 (0.70, 1.24) | −1 (−2, 0) | 14 | 20.15 | 16,288 | 0.70 (0.38, 1.17) | −4 (−7, −1) |
| Malignant neoplasms of the colon, rectosigmoid junction, and anus (153.0-154.9; C18-C21) | 31 | 27.75 | 50,147 | 1.12 (0.76, 1.59) | 1 (0, 1) | 19 | 19.85 | 33,858 | 0.96 (0.58, 1.49) | 0 (−1, 0) | 12 | 7.90 | 16,288 | 1.52 (0.79, 2.65) | 3 (0, 5) |
| Non-neoplastic mortality | 33,858 | 16,288 | |||||||||||||
| Diseases of the circulatory system (390.0-459.9, 93, 94.8, 98.8, 115, 289, 435, 999.1; I00-I99, G45, M30, M31, N28, R58) | 443 | 358.83 | 50,147 | 1.24 (1.12, 1.36) | 17 (13, 20) | 332 | 262.48 | 33,858 | 1.27 (1.13, 1.41) | 21 (16, 25) | 111 | 96.35 | 16,288 | 1.15 (0.95, 1.39) | 9 (4, 14) |
| Acute myocardial infarction (410.00-410.92; I21-I22) | 70 | 63.52 | 50,147 | 1.10 (0.86, 1.39) | 1 (0, 2) | 52 | 49.08 | 33,858 | 1.06 (0.79, 1.39) | 1 (0, 2) | 18 | 14.44 | 16,288 | 1.25 (0.74, 1.97) | 2 (0, 4) |
| Ischemic heart disease (411.0-414.9, 429.2; I23-25, I20) | 155 | 111.51 | 50,147 | 1.39 (1.18, 1.63) | 9 (6, 11) | 120 | 87.46 | 33,858 | 1.37 (1.14, 1.64) | 10 (6, 13) | 35 | 24.05 | 16,288 | 1.46 (1.01, 2.02) | 7 (3, 11) |
| Cerebrovascular disease (430.0-438.9, 94.87; I60-69, G45) | 71 | 66.50 | 50,147 | 1.07 (0.83, 1.35) | 1 (0, 2) | 58 | 44.25 | 33,858 | 1.31 (1.00, 1.69) | 4 (2, 6) | 13 | 22.25 | 16,288 | 0.58 (0.31, 1.00) | −6 (−9, −2) |
| Diseases of the respiratory system (460.00-519.99, 3.22, 12.3, 95.1, 334, 997.3; J00-J99, R09) | 177 | 117.33 | 50,147 | 1.51 (1.29, 1.75) | 12 (9, 15) | 114 | 83.23 | 33,858 | 1.37 (1.13, 1.65) | 9 (6, 12) | 63 | 34.10 | 16,288 | 1.85 (1.42, 2.36) | 18 (11, 24) |
| Diseases of the digestive system (520.00-579.99, 17.8, 32.83, 95.2, 98.86, 99.56, 14.8; K00-K93, R11, R18) | 79 | 35.74 | 50,147 | 2.20 (1.75, 2.75) | 9 (6, 11) | 49 | 25.04 | 33,858 | 1.96 (1.45, 2.59) | 7 (4, 10) | 30 | 10.70 | 16,288 | 2.80 (1.89, 4.00) | 12 (7, 17) |
Barrett’s esophagus defined as ICD-9 code 530.85, or 530.2 with SNOMED M73330.
Abbreviations: CI, confidence interval; EAR, excess absolute risk; ICD-O, International Classification of Diseases for Oncology; SMR, standardized mortality ratio.
Figure 3.
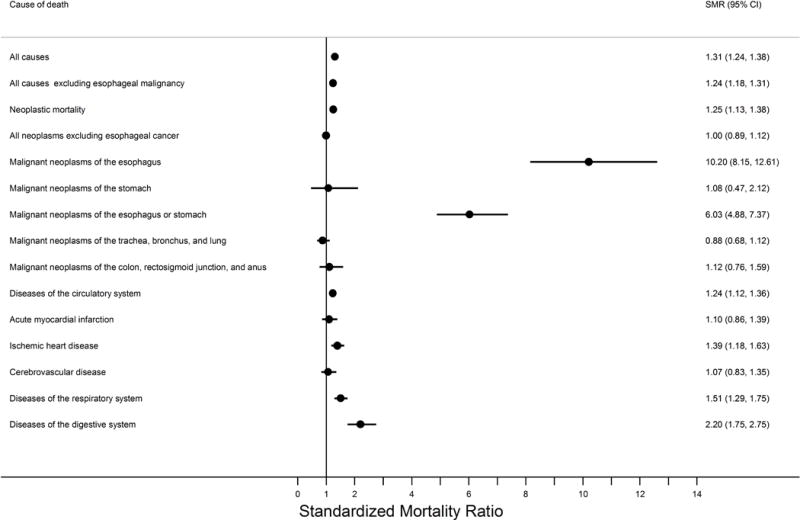
Forest plot summarizing the standardized mortality ratios in the Barrett’s esophagus cohort relative to the greater KPNC population.
The filled circles represent the risk estimates on a linear scale while the horizontal lines demarcate the extent of the 95% confidence intervals. The vertical line demarcates the null hypothesis. Abbreviations: CI, confidence interval; KPNC, Kaiser Permanente Northern California; SMR, standardized mortality ratio.
Figure 4.
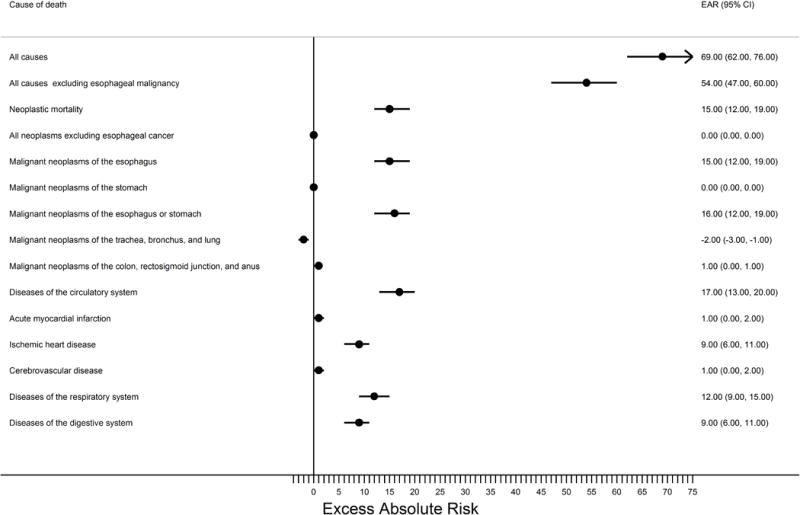
Forest plot summarizing the excess absolute mortality risks per 10,000 person years for the Barrett’s esophagus cohort relative to the greater KPNC population.
The filled circles represent the risk estimates on a linear scale while the horizontal lines demarcate the extent of the 95% confidence intervals. The vertical line demarcates the null hypothesis. Abbreviations: CI, confidence interval; EAR, excess absolute risk; KPNC, Kaiser Permanente Northern California.
Table 4.
Standardized mortality ratios for the Barrett’s esophagus cohort1, stratified by follow-up time post-Barrett’s esophagus diagnosis
| 0 to <3 Years | ≥3 to <6 Years | ≥6 Years | ||||||||||
|---|---|---|---|---|---|---|---|---|---|---|---|---|
|
| ||||||||||||
| Underlying cause of death (ICD-9 codes; ICD-10 codes) | Observed | Expected | Person-years | SMR (95% CI) | Observed | Expected | Person-years | SMR (95% CI) | Observed | Expected | Person-years | SMR (95% CI) |
| All causes (001-E999; A00-R99,V01-Y89) | 617 | 417.13 | 22,990 | 1.48 (1.36, 1.60) | 403 | 295.49 | 13,484 | 1.34 (1.23, 1.50) | 441 | 402.07 | 13,673 | 1.10 (1.00, 1.20) |
| All causes (001-E999; A00-R99,V01-Y89) excluding esophageal malignancy (150.0-150.9; C15) | 588 | 413.87 | 22,990 | 1.42 (1.31, 1.54) | 376 | 293.27 | 13,484 | 1.28 (1.16, 1.42) | 412 | 399.21 | 13,673 | 1.03 (0.93, 1.14) |
| Neoplastic mortality (140-239, 273-273.3, 273.9; C00-D48) | 152 | 119.90 | 22,990 | 1.27 (1.07, 1.49) | 110 | 82.24 | 13,484 | 1.34 (1.10, 1.61) | 122 | 105.59 | 13,673 | 1.16 (0.96, 1.38) |
| All neoplasms (140-149, 151-239, 273-273.3, 273.9; C00-C14, C16-D48) excluding esophageal cancer (150.0-150.9; C15) | 123 | 116.65 | 22,990 | 1.05 (0.88, 1.26) | 83 | 80.03 | 13,484 | 1.04 (0.83, 1.29) | 93 | 102.73 | 13,673 | 0.91 (0.73, 1.11) |
| Malignant neoplasms of the esophagus (150.0-150.9; C15) | 29 | 3.26 | 22,990 | 8.90 (5.96, 12.78) | 27 | 2.22 | 13,484 | 12.17 (8.02, 17.71) | 29 | 2.86 | 13,673 | 10.16 (6.80, 14.59) |
| Malignant neoplasms of the stomach (151.0-151.9; C16) | 7 | 2.98 | 22,990 | 2.35 (0.94, 4.84) | 0 | 1.98 | 13,484 | – | 1 | 2.47 | 13,673 | 0.41 (0.01, 2.26) |
| Malignant neoplasms of the esophagus (150.0-150.9; C15) or stomach (151.0-151.9; C16, C26.9) | 38 | 6.24 | 22,990 | 6.09 (4.31, 8.36) | 27 | 4.20 | 13,484 | 6.43 (4.24, 9.36) | 30 | 5.32 | 13,673 | 5.64 (3.80, 8.05) |
| Malignant neoplasms of the trachea, bronchus, and lung (162.0-162.9; C33-C34) | 25 | 29.72 | 22,990 | 0.84 (0.54, 1.24) | 16 | 20.06 | 13,484 | 0.80 (0.46, 1.30) | 24 | 24.47 | 13,673 | 0.98 (0.63, 1.46) |
| Malignant neoplasms of the colon, rectosigmoid junction, and anus (153.0-154.9; C18-C21) | 11 | 10.94 | 22,990 | 1.01 (0.50, 1.80) | 9 | 7.43 | 13,484 | 1.21 (0.55, 2.30) | 11 | 9.38 | 13,673 | 1.17 (0.59, 2.10) |
| Non-neoplastic mortality | ||||||||||||
| Diseases of the circulatory system (390.0-459.9, 93, 94.8, 98.8, 115, 289, 435, 999.1; I00-I99, G45, M30, M31, N28, R58) | 185 | 134.64 | 22,990 | 1.37 (1.18, 1.59) | 121 | 95.43 | 13,484 | 1.27 (1.05, 1.52) | 137 | 128.76 | 13,673 | 1.06 (0.89, 1.26) |
| Acute myocardial infarction (410.00-410.92; I21-I22) | 22 | 25.08 | 22,990 | 0.88 (0.55, 1.33) | 22 | 17.09 | 13,484 | 1.29 (0.81, 1.95) | 26 | 21.34 | 13,673 | 1.22 (0.80, 1.78) |
| Ischemic heart disease (411.0-414.9, 429.2; I23-25, I20) | 72 | 42.21 | 22,990 | 1.71 (1.33, 2.15) | 43 | 29.62 | 13,484 | 1.45 (1.05, 1.96) | 40 | 39.68 | 13,673 | 1.01 (0.72, 1.37) |
| Cerebrovascular disease (430.0-438.9, 94.87; I60-69, G45) | 33 | 25.18 | 22,990 | 1.31 (0.90, 1.84) | 19 | 18.01 | 13,484 | 1.06 (0.64, 1.65) | 19 | 23.31 | 13,673 | 0.82 (0.49, 1.27) |
| Diseases of the respiratory system (460.00-519.99, 3.22, 12.3, 95.1, 334, 997.3; J00-J99, R09) | 72 | 43.13 | 22,990 | 1.67 (1.31, 2.10) | 42 | 30.93 | 13,484 | 1.36 (0.98, 1.84) | 63 | 43.27 | 13,673 | 1.47 (1.12, 1.86) |
| Diseases of the digestive system (520.00-579.99, 17.8, 32.83, 95.2, 98.86, 99.56, 14.8; K00-K93, R11, R18) | 43 | 13.95 | 22,990 | 3.08 (2.23, 4.15) | 22 | 9.59 | 13,484 | 2.30 (1.44, 3.47) | 14 | 12.21 | 13,673 | 1.15 (0.63, 1.92) |
Barrett’s esophagus defined as ICD-9 code 530.85, or 530.2 with SNOMED M73330.
Abbreviations: CI, confidence interval; EAR, excess absolute risk; ICD-O, International Classification of Diseases for Oncology; SMR, standardized mortality ratio.
Esophageal cancer had the highest relative mortality risk with an SMR of over 10 for this Barrett’s esophagus cohort and an excess absolute risk of 15 deaths per 10,000 person-years. Risk of esophageal cancer death did not vary by time since diagnosis of Barrett’s esophagus. Mortality risks of trachea, bronchus, and lung, and colon, rectosigmoid junction, and anus were not altered in this Barrett’s esophagus cohort overall or by time since Barrett’s esophagus diagnosis.
For non-neoplastic mortality, risk of death from diseases of the circulatory system was slightly increased (SMR=1.24, excess absolute risk=17 per 10,000 person-years), a result driven mainly by an increased risk of death from ischemic heart disease (SMR=1.39, excess absolute risk=9). Risks of death from diseases of the respiratory system (SMR=1.51, excess absolute risk=12) and diseases of the digestive system (SMR=2.20, excess absolute risk=9) were also increased, relative to the greater KPNC population. When stratified by time since Barrett’s esophagus diagnosis, all of these risks decreased with time, and only death from diseases of the respiratory system remained significantly elevated in the last time period (≥6 years) assessed.
Risks by sex were largely comparable with a few exceptions. Similar to the analysis of esophageal adenocarcinoma incidence, the relative risk of any esophageal cancer death in females (SMR=19.90) was more than twice that of males (SMR=9.09), yet excess absolute risks were much higher in males (excess absolute risk=18 vs 10 per 10,000 person-years; Supplemental Figures 1 & 2). Lastly, both relative (SMRs) and excess absolute (excess absolute risks) risks of death from diseases of the respiratory and digestive systems were slightly higher in females compared with males.
Sensitivity Analyses
The cohort size was reduced by 308 to 8,621 individuals when we excluded Barrett’s esophagus subjects who were diagnosed with esophageal adenocarcinoma within six months of their Barrett’s esophagus diagnosis date (as well as subjects who did not have at least six months of continual follow-up). SIRs and SMRs from these sensitivity analyses were largely unaltered, with only slight attenuation in risk of esophageal adenocarcinoma incidence (SIR=18.44, excess absolute risk=18 per 10,000 person-years) and esophageal cancer mortality (SMR=7.98, excess absolute risk=12 per 10,000 person-years), as well as categories to which these endpoints also contributed (Supplementary Tables 1 & 2).
Use of a more liberal definition of Barrett’s esophagus that required an ICD-9 code of either 530.85 or 530.2 expanded the cohort for analysis to 11,987 Barrett’s esophagus subjects and total follow-up time to 71,122 years. SIRs of this sensitivity analysis did not markedly differ from the main analysis, with slight attenuation in risk for outcomes that included esophageal cancer (Supplementary Table 3), which were further reduced when the six month “prevalent” esophageal adenocarcinoma exclusion was applied (Supplementary Table 4). Conversely, SMRs for all causes were slightly increased when the more liberal definition of Barrett’s esophagus was used (SMR=1.70, excess absolute risk=170 per 10,000 person-years; Supplementary Table 5). This increase appeared to be driven by an increase in SMRs for non-neoplastic mortality. These mortality risk increases were slightly attenuated when the six month exclusion was applied (Supplementary Table 6).
Discussion
This study of a large community-based US cohort found that patients with Barrett’s esophagus have modest excess absolute increased risks for malignancies of the esophagus, cardia, and stomach and similar risks for malignancies of the colon, rectosigmoid junction, and anus compared with the KPNC population. Overall mortality risk and, specifically, risks of death from esophageal cancer, diseases of the circulatory system—particularly ischemic heart disease—diseases of the respiratory system, and diseases of the digestive system were all increased in this Barrett’s esophagus cohort. The relative and absolute risks from this study provide important evidence that will help inform ongoing debates about the value of endoscopic surveillance and preventative strategies (including ablation) in patients with Barrett’s esophagus.
The crude absolute annual risk of esophageal adenocarcinoma in Barrett’s esophagus has been estimated from meta-analyses to be 0.61% overall, 0.53% when excluding early incident cancers, 0.41% when additionally excluding baseline high-grade dysplasia,[8] and 0.33% when additionally excluding baseline low-grade dysplasia.[20] Estimates from our large US Barrett’s esophagus cohort were slightly lower (0.25%) and further reduced when we excluded early (likely prevalent) cancer diagnoses (0.20%), despite our inability to exclude baseline dysplasia. Our lower estimated risk may be partly due to the community-based cohort we studied here as opposed to surveillance cohorts, which may have upwardly biased the previously-cited meta-analytic estimates [21]. In addition, crude estimates of the risk of esophageal adenocarcinoma in Barrett’s esophagus will vary due to study differences in age, sex, and possibly calendar year, which emphasizes the importance of our presentation of relative risks (SIR=23.9) and excess absolute risks (24 per 10,000 person-years) which account for these factors. It is noteworthy that our SIR is in the range of 10–55 which is derived from studies that have adjusted for age, sex and calendar period in estimating the relative risk of esophageal adenocarcinoma in Barrett’s esophagus.[1–7] In addition to age, sex, and calendar year, cancer risk may also vary due to length and distribution of follow-up time[21], the definition of Barrett’s esophagus employed (e.g., whether to include patients without intestinal metaplasia), dissimilar referral practices for endoscopy, institutional preferences for certain biopsy protocols, as well as variations in population genetics and environmental exposures, which places a premium on population-specific risk estimates. In sum, the evidence from our study indicates that the risk of progression to esophageal adenocarcinoma in US Barrett’s esophagus subjects is modest, supporting the supposition that current endoscopic surveillance programs that include all Barrett’s esophagus subjects, including those without initial dysplasia, may not be cost effective.[22]
It is noteworthy that risk of esophageal adenocarcinoma decreased with time since Barrett’s esophagus diagnosis, but the risk of esophageal cancer death did not vary over time. Taken together, these findings suggest that the variable risk of esophageal adenocarcinoma incidence observed over time is likely an artifact attributable to prevalent disease (as supported by our sensitivity analyses), increased lead time from “front-loading” of events, and overdiagnosis, in combination with progressively widening surveillance intervals. Thus, contrary to studies which accrued esophageal cancers over a short period following diagnosis of Barrett’s esophagus, our esophageal cancer mortality results suggest that esophageal cancer risk persists for greater than six years, with little decay in risk over time. This finding is consistent with a recent rigorous modeling study that suggested that Barrett’s esophagus cohorts with limited follow-up may underestimate long-term risk of esophageal adenocarcinoma.[21]
Although Barrett’s esophagus appeared to increase the risk of esophageal adenocarcinoma to a greater extent in females relative to males, the excess absolute risk and crude incidence rate were approximately 2.5 times higher in males than females. This sex difference is in line with estimates from prior studies[23, 24] and underscores the value of sex in predictive models of esophageal adenocarcinoma in the setting of Barrett’s esophagus.[25] Non-mutually exclusive hypotheses that may explain why male Barrett’s esophagus subjects have a higher absolute cancer risk than female Barrett’s esophagus subjects include differences in age at onset of disease, android obesity, production and concentration of gastric acid, hiatal hernia, defective lower esophageal sphincter, intragastric pressure, and sex steroid hormones.[23, 26]
Debate as to whether individuals with Barrett’s esophagus have an increased risk for colorectal cancer has been complicated by giving equal, or even greater, attention to cross-sectional (prevalence) studies as compared with the more methodologically rigorous and appropriate prospective studies of Barrett’s esophagus cohorts. The latter should be the focus when considering an intervention (e.g., screening colonoscopy) in individuals diagnosed with Barrett’s esophagus. Four such studies have been published previously[7, 10, 27, 28] which, when combined via fixed effects meta-analysis with this study herein, provide some evidence of an increased risk of colorectal/anal cancers in Barrett’s esophagus (relative risk=1.56, 95% CI: 1.46, 1.67, I2=80%). The large heterogeneity accompanying these summary risk estimates necessitates a cautious interpretation and may further endorse the importance of population-specific risks. Also of importance is evidence indicating that these increased risks may be attributable to diagnostic bias.[27, 28] Even if the higher upper confidence interval (1.67) of the meta-analytic relative risk estimate represents the true association in the US, when applied to the KPNC Barrett’s esophagus cohort this would only result in 11 additional colorectal cancers being diagnosed per 10,000 person-years. Since the magnitude of this effect is comparable to, or smaller than, that of other risk factors that do not modify screening guidelines (e.g., increasing age, higher BMI), even if present, this small magnitude of excess absolute risk is unlikely to support additional interventions for colorectal cancer in individuals diagnosed with Barrett’s esophagus.
The overall risk of death, even after excluding esophageal cancer, was slightly higher in this Barrett’s esophagus cohort relative to the greater KPNC population, an observation supported by some studies[3, 5, 12, 15] but not by others.[11, 13, 16, 29, 30] The decrease in all-cause mortality with increased time since Barrett’s esophagus diagnosis suggests that prior studies, which showed increased risk, may have had diagnostic bias whereby a condition increased the risk of both diagnosing Barrett’s esophagus and other causes of mortality. This could occur, for example, if Barrett’s esophagus was coincidentally diagnosed during endoscopic evaluations for gastrointestinal bleeding around the time of treatment for cardiac ischemia or for iron deficiency anemia related to unrelated extra-esophageal malignancies. Primary contributors to the increased mortality risk in the KPNC Barrett’s esophagus cohort were esophageal adenocarcinoma and non-neoplastic mortality. Of the latter, diseases of the circulatory system were increased (SMR=1.24, excess absolute risk=17 per 10,000 person-years), primarily due to ischemic heart disease (SMR=1.39, excess absolute risk=9), a finding supported by a prior UK-based study.[14] Some prior Barrett’s esophagus cohort studies have assessed ischemic heart disease combined with acute myocardial infarction, thus to meta-analyze these relative risk estimates we assessed this combined, singular endpoint. The four prior studies that reported such relative risks[7, 11, 15, 16] combined with the KPNC data herein, suggest a modest but statistically significant increased risk (relative risk=1.14, 95% CI: 1.04, 1.24, I2=32%). Even if the higher KPNC risk estimate of ischemic heart disease alone (1.39) is real and accurate for US Barrett’s esophagus populations, the modest excess absolute risk of 9 per 10,000 person years is unlikely to warrant additional interventions beyond what would be offered to the general population.
Increased risk of death from respiratory system diseases in Barrett’s esophagus patients has support from one UK study[15] but not from three other European studies.[7, 11, 16] The combined estimate of these four studies with KPNC data indicates a modest increased risk (relative risk =1.23, 95% CI: 1.10, 1.35, I2=80%), although the large heterogeneity suggests that population-specific risk may be more appropriate than estimates across multiple populations. Point estimates from the KPNC data indicate that Barrett’s esophagus patients have a 51% increase in their relative risk of respiratory disease death and an excess absolute risk of 12 deaths per 10,000 person-years.
Lastly, there was an increased risk of digestive disease death in the KPNC Barrett’s esophagus cohort, an observation which we[7] and others[15, 16] have made previously in Barrett’s esophagus cohorts based in the UK and Northern Ireland, but which was not observed in a Netherlands Barrett’s esophagus cohort.[11] When all estimates were combined with KPNC, the summary estimate was indicative of an association (relative risk =1.97, 95% CI: 1.66, 2.28, I2=58%) but, as we have previously suggested,[7] this increased risk may be a function of selection bias with the diagnosis of Barrett’s esophagus being incidental after an endoscopic referral pertaining to symptoms of their eventual cause of death. Indeed, 41 of these 79 deaths were ascribed to the SEER grouping of “chronic liver disease and cirrhosis”, 5 to “stomach and duodenal ulcers”, and the remainder to “other”, a miscellaneous group of digestive diseases. Also in support of our hypothesis is the fact that risk of digestive disease death decreased to the null with increased time since Barrett’s esophagus diagnosis.
Strengths of this study include the fact that this is the first prospective analysis of extra-esophageal cancer risks and mortality risks in a large community-based US Barrett’s esophagus cohort. The study used a specific definition of Barrett’s esophagus which incorporated validation work from a large prior study that included endoscopy and pathology review. Comparison rates employed here came from the total KPNC population and thus are representative of the underlying population from which our Barrett’s esophagus cases arose. Indirect standardization was based on age, sex and calendar year, thus accounting for these variables which are strongly associated with risk of the outcomes assessed. This study was limited by its lack of information on dysplasia, segment length, and other risk covariates such as body mass index, tobacco smoking, and alcohol consumption. The lack of dysplasia data is unlikely to bias these results for two reasons. First, relatively few patients have high grade dysplasia at diagnosis and their effect, if excluded, would be relatively small. Second, low grade dysplasia, although more common than high grade dysplasia, is still uncommon and is a poor predictor of cancer risk. In large US multi-center studies, a diagnosis of low grade dysplasia conferred a similar cancer risk to nondysplastic Barrett’s esophagus.[31] The study was also limited by its inability to generate race-specific risk estimates because race is not routinely collected in the electronic KPNC data files which precluded generation of race-specific KPNC population rates for comparison with the Barrett’s esophagus population.
Understanding the experience of a population with a precancerous lesion is an essential component of understanding the scientific importance of the ailment, communicating with affected individuals on risks and their magnitude, and being able to make informed clinical decisions. Excess absolute risks of cancer and mortality conferred by Barrett’s esophagus are modest, including esophageal cancer—for which the absolute risk is low and persistent—and all-cause mortality, where the modest elevation we observed may be attributable to diagnostic bias. These results may inform the potential impact of surveillance endoscopy, additional screening colonoscopy, and prophylactic interventions in Barrett’s esophagus populations within the United States.
Supplementary Material
Summary Box.
What is already known about this subject
Barrett’s esophagus increases the risk of esophageal adenocarcinoma by 10–55 times that of the general population
There is conflicting evidence whether Barrett’s esophagus increases risks of colorectal cancer or of cardiovascular disease.
To-date, there has not been a comprehensive study of cancer incidence and mortality risks in a US Barrett’s esophagus cohort, yet population-specific risks are essential for evidence-based medicine.
What are the new findings
Barrett’s esophagus conferred an excess absolute risk for esophageal adenocarcinoma of 24 cases per 10,000 person-years, and this risk persisted over time after Barrett’s esophagus diagnosis.
Barrett’s esophagus patients had increased risks of cardia and stomach cancers, but excess absolute risks were modest. Risks of colorectal, lung, and prostate cancers were unaltered.
Barrett’s esophagus patients had a consistent 51% increased risk of respiratory system death; in contrast, apparently elevated mortality risks of all-causes, ischemic heart disease, and digestive system disease appeared to be the result of diagnostic bias, and all excess absolute risks were modest.
How might it impact on clinical practice in the foreseeable future?
Attaining population-specific risk estimates are essential for developing comprehensive disease-prevention interventions, scientific understanding, risk communication, and to provide an evidence-base to guide clinical decision-making. Excess absolute risks of cancer and mortality among Barrett’s esophagus patients were modest. These results may inform strategies for surveillance endoscopy, additional screening colonoscopy, and prophylactic interventions in Barrett’s esophagus populations within the United States.
Acknowledgments
We would like to thank Natalia Udlatsova and Wei Zhao (Kaiser Permanente, Division of Research) for their assistance with data extraction.
Funding: This study was supported entirely by the Intramural Research Program of the Division of Cancer Epidemiology and Genetics, National Cancer Institute, National Institutes of Health, Bethesda, MD. No funding or other financial support was received.
Footnotes
Author Contributions: Study concept and design (MBC, DAC); Acquisition of data (DAC, JL, JS); Statistical analysis (MBC, SBC); Interpretation of results (All); Drafting of the manuscript (All); Critical revision of the manuscript (All); Obtained funding (MBC, PRT); Study supervision (MBC, DAC).
Competing Interests
There are no conflicts of interest to declare from any of the authors.
References
- 1.Spechler SJ, Robbins AH, Rubins HB, et al. Adenocarcinoma and Barrett’s esophagus. An overrated risk? Gastroenterology. 1984;87:927–33. [PubMed] [Google Scholar]
- 2.Polepalle SC, McCallum RW. Barrett’s esophagus. Current assessment and future perspectives. Gastroenterol Clin North Am. 1990;19:733–44. [PubMed] [Google Scholar]
- 3.van der Burgh A, Dees J, Hop WC, et al. Oesophageal cancer is an uncommon cause of death in patients with Barrett’s oesophagus. Gut. 1996;39:5–8. doi: 10.1136/gut.39.1.5. [DOI] [PMC free article] [PubMed] [Google Scholar]
- 4.Rana PS, Johnston DA. Incidence of adenocarcinoma and mortality in patients with Barrett’s oesophagus diagnosed between 1976 and 1986: implications for endoscopic surveillance. Dis Esophagus. 2000;13:28–31. doi: 10.1046/j.1442-2050.2000.00069.x. [DOI] [PubMed] [Google Scholar]
- 5.Conio M, Cameron AJ, Romero Y, et al. Secular trends in the epidemiology and outcome of Barrett’s oesophagus in Olmsted County, Minnesota. Gut. 2001;48:304–9. doi: 10.1136/gut.48.3.304. [DOI] [PMC free article] [PubMed] [Google Scholar]
- 6.Solaymani-Dodaran M, Logan RF, West J, et al. Risk of oesophageal cancer in Barrett’s oesophagus and gastro-oesophageal reflux. Gut. 2004;53:1070–4. doi: 10.1136/gut.2003.028076. [DOI] [PMC free article] [PubMed] [Google Scholar]
- 7.Cook MB, Wild CP, Everett SM, et al. Risk of mortality and cancer incidence in Barrett’s esophagus. Cancer Epidemiol Biomarkers Prev. 2007;16:2090–6. doi: 10.1158/1055-9965.EPI-07-0432. [DOI] [PubMed] [Google Scholar]
- 8.Yousef F, Cardwell C, Cantwell MM, et al. The Incidence of Esophageal Cancer and High-Grade Dysplasia in Barrett’s Esophagus: A Systematic Review and Meta-Analysis. Am J Epidemiol. 2008 doi: 10.1093/aje/kwn121. [DOI] [PubMed] [Google Scholar]
- 9.Rastogi A, Puli S, El-Serag HB, et al. Incidence of esophageal adenocarcinoma in patients with Barrett’s esophagus and high-grade dysplasia: a meta-analysis. Gastrointest Endosc. 2008;67:394–8. doi: 10.1016/j.gie.2007.07.019. [DOI] [PubMed] [Google Scholar]
- 10.Solaymani-Dodaran M, Logan RF, West J, et al. Risk of extra-oesophageal malignancies and colorectal cancer in Barrett’s oesophagus and gastro-oesophageal reflux. Scand J Gastroenterol. 2004;39:680–5. doi: 10.1080/00365520410004802. [DOI] [PubMed] [Google Scholar]
- 11.Schouten LJ, Steevens J, Huysentruyt CJ, et al. Total Cancer Incidence and Overall Mortality Are Not Increased Among Patients With Barrett’s Esophagus. Clin Gastroenterol Hepatol. 2011 doi: 10.1016/j.cgh.2011.04.008. [DOI] [PubMed] [Google Scholar]
- 12.Solaymani-Dodaran M, Logan RF, West J, et al. Mortality associated with Barrett’s esophagus and gastroesophageal reflux disease diagnoses-a population-based cohort study. Am J Gastroenterol. 2005;100:2616–21. doi: 10.1111/j.1572-0241.2005.00340.x. [DOI] [PubMed] [Google Scholar]
- 13.Caygill CP, Royston C, Charlett A, et al. Mortality in Barrett’s esophagus: three decades of experience at a single center. Endoscopy. 2012 doi: 10.1055/s-0032-1309842. [DOI] [PubMed] [Google Scholar]
- 14.Moayyedi P, Burch N, Akhtar-Danesh N, et al. Mortality rates in patients with Barrett’s oesophagus. Aliment Pharmacol Ther. 2008;27:316–20. doi: 10.1111/j.1365-2036.2007.03582.x. [DOI] [PubMed] [Google Scholar]
- 15.Solaymani-Dodaran M, Card TR, West J. Cause-specific mortality of people with Barrett’s esophagus compared with the general population: a population-based cohort study. Gastroenterology. 2013;144:1375–83. 83 e1. doi: 10.1053/j.gastro.2013.02.050. [DOI] [PubMed] [Google Scholar]
- 16.Anderson LA, Murray LJ, Murphy SJ, et al. Mortality in Barrett’s oesophagus: results from a population based study. Gut. 2003;52:1081–4. doi: 10.1136/gut.52.8.1081. [DOI] [PMC free article] [PubMed] [Google Scholar]
- 17.Krieger N. Overcoming the absence of socioeconomic data in medical records: validation and application of a census-based methodology. Am J Public Health. 1992;82:703–10. doi: 10.2105/ajph.82.5.703. [DOI] [PMC free article] [PubMed] [Google Scholar]
- 18.Gordon NP. How does the adult Kaiser Permanente membership in Northern California compare with the larger community? Oakland, CA: Kaiser Permanente Division of Research; 2006. Available from: http://www.dor.kaiser.org/external/uploadedFiles/content/research/mhs/_2011_Revised_Site/Documents_Special_Reports/comparison_kaiser_vs_nonKaiser_adults_kpnc(1).pdf. [Google Scholar]
- 19.Corley DA, Kubo A, DeBoer J, et al. Diagnosing Barrett’s esophagus: reliability of clinical and pathologic diagnoses. Gastrointest Endosc. 2009;69:1004–10. doi: 10.1016/j.gie.2008.07.035. [DOI] [PMC free article] [PubMed] [Google Scholar]
- 20.Desai TK, Krishnan K, Samala N, et al. The incidence of oesophageal adenocarcinoma in non-dysplastic Barrett’s oesophagus: a meta-analysis. Gut. 2011 doi: 10.1136/gutjnl-2011-300730. [DOI] [PubMed] [Google Scholar]
- 21.Kroep S, Lansdorp-Vogelaar I, Rubenstein JH, et al. An Accurate Cancer Incidence in Barrett’s Esophagus: A Best Estimate Using Published Data and Modeling. Gastroenterology. 2015;149:577–85.e4. doi: 10.1053/j.gastro.2015.04.045. quiz e14-5. [DOI] [PMC free article] [PubMed] [Google Scholar]
- 22.Inadomi JM. Cost considerations in implementing a screening and surveillance strategy for Barrett’s oesophagus. Best Pract Res Clin Gastroenterol. 2015;29:51–63. doi: 10.1016/j.bpg.2014.12.002. [DOI] [PubMed] [Google Scholar]
- 23.Bhat S, Coleman HG, Yousef F, et al. Risk of Malignant Progression in Barrett’s Esophagus Patients: Results from a Large Population-Based Study. J Natl Cancer Inst. 2011 doi: 10.1093/jnci/djr203. [DOI] [PMC free article] [PubMed] [Google Scholar]
- 24.Hvid-Jensen F, Pedersen L, Drewes AM, et al. Incidence of Adenocarcinoma among Patients with Barrett’s Esophagus. N Engl J Med. 2011;365:1375–83. doi: 10.1056/NEJMoa1103042. [DOI] [PubMed] [Google Scholar]
- 25.Krishnamoorthi R, Borah B, Heien H, et al. Rates and predictors of progression to esophageal carcinoma in a large population-based Barrett’s esophagus cohort. Gastrointest Endosc. 2016 doi: 10.1016/j.gie.2015.12.036. [DOI] [PMC free article] [PubMed] [Google Scholar]
- 26.Cook MB, Dawsey SM, Freedman ND, et al. Sex disparities in cancer incidence by period and age. Cancer Epidemiol Biomarkers Prev. 2009;18:1174–82. doi: 10.1158/1055-9965.EPI-08-1118. [DOI] [PMC free article] [PubMed] [Google Scholar]
- 27.de Jonge PJ, van Blankenstein M, Looman CW, et al. Risk of colorectal cancer in patients with Barrett’s esophagus: A Dutch population-based study. Am J Gastroenterol. 2010;105:77–83. doi: 10.1038/ajg.2009.503. [DOI] [PubMed] [Google Scholar]
- 28.Murphy SJ, Anderson LA, Mainie I, et al. Incidence of colorectal cancer in a population-based cohort of patients with Barrett’s oesophagus. Scand J Gastroenterol. 2005;40:1449–53. doi: 10.1080/00365520510023828. [DOI] [PubMed] [Google Scholar]
- 29.Eckardt VF, Kanzler G, Bernhard G. Life expectancy and cancer risk in patients with Barrett’s esophagus: a prospective controlled investigation. Am J Med. 2001;111:33–7. doi: 10.1016/s0002-9343(01)00745-8. [DOI] [PubMed] [Google Scholar]
- 30.Jung KW, Talley NJ, Romero Y, et al. Epidemiology and natural history of intestinal metaplasia of the gastroesophageal junction and Barrett’s esophagus: a population-based study. Am J Gastroenterol. 2011;106:1447–55. doi: 10.1038/ajg.2011.130. quiz 56. [DOI] [PMC free article] [PubMed] [Google Scholar]
- 31.Wani S, Falk GW, Post J, et al. Risk Factors for Progression of Low-Grade Dysplasia in Patients With Barrett’s Esophagus. Gastroenterology. 2011;141:1179–86 e1. doi: 10.1053/j.gastro.2011.06.055. [DOI] [PubMed] [Google Scholar]
Associated Data
This section collects any data citations, data availability statements, or supplementary materials included in this article.