

Abstract
The aim of the study was to assess performance on a visual threat-detection task during concurrently performed vigorous exercise on a cycle ergometer. Thirty (15 female) participants completed a baseline condition of seated rest and then moderate- and high-intensity exercise. Moderate- and high-intensity exercise conditions were completed on the 2nd day in a counterbalanced order. During each exercise condition, participants responded to 3 × 3 picture matrices (256 trials in each condition) that contained discrepant fear-relevant and discrepant fear-irrelevant pictures (Öhman, Flykt, & Esteves, 2001). Response accuracy was significantly greater, and reaction time was significantly faster, during moderate- and high-intensity exercise compared with the rest condition (ps < .001). The discrepant fear-relevant matrix type was detected significantly more accurately than a discrepant fear-irrelevant matrix (p < .001). The discrepant fear-relevant matrix was detected significantly faster than all other matrix types (p < .001). These results suggest that exercise at a moderate and high intensity may enhance the efficiency of visual detection of both threatening and nonthreatening targets.
Keywords: exercise, attention, visual search, target detection, threat, emotion, dual-task performance
It is generally agreed that the control of attention is delineated through a fast, automatic feature detection process and a slower, higher order recognition process that work partially independently from each other (functionally and anatomically; Cave & Batty, 2006; Corbetta & Shulman, 2002). However, because of the limited capacity of attention, there are some types of complex stimuli, such as emotional stimuli, that are preferentially and rapidly allotted processing resources. In particular, stimuli that are threatening and indicate potential harm are allocated greater attentional resources and are recognized faster than nonthreatening objects of similar complexity (Öhman & Mineka, 2001). Yet, selective automatic detection of threatening stimuli has not been exclusively demonstrated in the literature.
In an attempt to define the automaticity of fear-related detection, Öhman, Flykt, and Esteves (2001) examined searches for threatening stimuli (snakes, spiders) in complex visual arrays with varying numbers of distractor images (plants). Individuals were significantly faster at detecting matrices with discrepant fear-relevant targets. This finding led to the conclusion that discrepant fear-relevant targets are detected through an automatic and parallel search (Öhman et al., 2001). Although arousal has been suggested to influence attention to emotion (Schimmack, 2005), it is not clear whether the ability to detect threat can be augmented or degraded under conditions of increased arousal or dual-task demands.
Emotions have been characterized as action dispositions that prepare the body to behaviorally respond (Lang, Bradley, & Cuthbert, 1997). A limitation of the laboratory setting is that behaviors in response to strong emotional cues must be inhibited to conform to experimental task instructions and remain relatively still to reduce noise, as physiological data are often being recorded. This requirement does not reflect the ongoing response to emotional stimuli people typically face while moving about the world. It is not clear how motor activity affects the ability to allocate attention to salient environmental cues. As it has been suggested that exercise may impair executive cognitive function (Dietrich & Sparling, 2004), it is important to address the effect of concurrent motor activation on threat detection to understand whether engagement of motor systems affects how attention is primed and distributed.
In this article, we examine whether visual threat detection is affected in a dual-task paradigm by using exercise at moderate and high intensities. If visual threat detection is automatic, the detection of threatening stimuli should be encapsulating in that once the detection occurs, no other processes can interfere with the maintenance of the detection (Öhman & Mineka, 2001). However, if visual attention toward threat is affected by moderate- or high-intensity exercise, this would call into question theories that propose automatic unhindered attention to emotional visual stimuli. These effects would also have practical implications for preparation and training to function optimally in threatening environments.
In general, moderate physical activity has been suggested to facilitate attention allocation and improve reaction times (RTs) to simple detection tasks (Audiffren, Tomporowski, & Zagrodnik, 2008; Matthews & Davies, 2001; Pesce, Capranica, Tessitore, & Figura, 2003). However, RT performance has been shown to deteriorate when an exercise intensity of approximately 76% maximal oxygen uptake is exceeded (Chmura, Nazar, & Kaciuba-Uścilko, 1994). Contrary to RTs, exercise has been shown to impair executive cognitive function during tasks that require inhibitory responses and memory (Dietrich & Sparling, 2004; Pontifex & Hillman, 2007). These divergent results corroborate the claim that the relationships between attention, serial search processes, emotion, and exercise are not well understood.
The purpose of this study was to examine RT and performance accuracy during a visual target detection task performed simultaneously during conditions of rest and moderate- and high-intensity cycling exercise. On the basis of previous findings, it was hypothesized that (a) RTs to detect a fear-relevant discrepant picture matrix would be fastest and (b) RTs during the high-intensity exercise would be slowest compared with seated rest or moderate-intensity exercise. A directional hypothesis was not made in regard to the interaction between exercise intensity and responses to matrices with fear-relevant and fear-irrelevant targets.
Method
Thirty-three healthy, normally physically active undergraduate students (16 men, 17 women) were recruited to participate.
Participants were screened to ensure that they did not report high fear scores to the fear-relevant material included in the picture matrices. The Snake Questionnaire (SNQ), which has a one-month test–retest reliability of r = .78, as well as the Spider Questionnaire (SPQ), which has an internal consistency reliability ranging from r = .83 to .90, were completed (Klorman, Weerts, Hastings, Melamed, & Lang, 1974). Individuals who scored 2 SDs or more above the normative value were excluded from the study. Participants also completed the Edinburgh handedness inventory (Old-field, 1971) and only right-handed individuals participated. Furthermore, only participants who reported engaging in a minimum of 15 min of high-intensity exercise at least two times per week were included (Godin & Shepard, 1985). One participant was excluded based on a score that exceeded 2 SDs on the Spider questionnaire, one participant did not demonstrate sufficient cardiorespiratory fitness, and one participant did not complete the second day of testing. Thus, 30 participants (15 men, 15 women) completed the study.
The group characteristics and previously reported normative values for each variable are listed in Table 1. There were significant gender differences for VO2 peak, t(28) = 3.46, p = .002; trait anxiety, t(28) = −2.63, p = .014; and the SNQ scores, t(28) = −2.55, p = .017.
Table 1.
Participant Characteristics
| Variable | Women (n = 15) | Female norm | Men (n = 15) | Male norm |
|---|---|---|---|---|
| Age (in years) | 20.7 ± 1.9 | 23.1 ± 3.5 | ||
| Physical activity (kJ·−1· day−1) | 122.8 ± 11.8 | 147.0 ± 25.2 | 124.0 ± 9.1 | 168.0 ± 25.2 |
| VO2peak (ml·min −1) | 36.0 ± 4.7* | 39.5 ± 5.0 | 44.5 ± 8.3* | 46.0 ± 6.0 |
| Trait anxiety (STAI-Y2) | 36.1 ± 6.2* | 40.4 ± 10.2 | 29.6 ± 7.4* | 38.3 ± 9.2 |
| SNQ | 8.9 ± 2.1* | 9.1 ± 6.1 | 7.3 ± 1.5* | 5.8 ± 3.8 |
| SPQ | 9.1 ± 3.5 | 5.0 ± 4.9 | 8.0 ± 1.7 | 3.8 ± 3.4 |
Note. (N = 30). Data are expressed as mean ± standard deviation. Norm values and standard deviations for physical activity were obtained and estimated from Blair (1984) and Dishman & Steinhardt (1988). Shvartz and Reibold (1990) reported the normative value for VO2peak. Spielberger, Gorsuch, Lushene, Vagg, and Jacons (1983) provided normative trait anxiety values for college students and the normative values for the Snake Questionnaire (SNQ) and Spider Questionnaire (SPQ) were provided by Fredrikson (1983). On average, male participants in this study were over a standard deviation below the normative physical activity value and more than a standard deviation above the normative value on the SPQ. For the remaining male variables and all female variables, the sample did not exceed one standard deviation above or below the norm values.
p < .05.
Experimental Design
A 3 (Exercise Condition) × 4 (Matrix Type) within-subjects repeated measures design was used. Each participant completed three conditions of exercise on 2 days of testing (Day 1 rest, Day 2 both moderate- and high-intensity exercise conditions). The exercise conditions consisted of seated rest, moderate-intensity exercise at approximately 45% maximal heart rate, and high-intensity exercise at approximately 80% maximal heart rate (U.S. Department of Health and Human Services, 1996). There were four different matrix types that varied in their arrangements of pictures of snakes, spiders, mushrooms, and flowers (based on Öhman et al., 2001). Each matrix contained nine pictures arranged in rows and columns. A matrix was either composed of all pictures from the same category or had a single discrepant picture located somewhere in the matrix. The four matrix types were (a) all fear-relevant pictures (all snakes or all spiders), (b) all fear-irrelevant pictures (all mushrooms or all flowers), (c) a fear-irrelevant picture (a mushroom or a flower) located in a background of snakes or spiders, and (d) a fear-relevant picture (a snake or a spider) located in a background of either mushrooms or flowers.
The primary dependent variables were (a) percentage of the total trial responses that were correct identifications and (b) response times in milliseconds. The secondary outcomes served as manipulation checks and consisted of (a) ratings of perceived exertion and heart rate during exercise and (b) subjective ratings of picture arousal and valence. The two exercise intensity conditions were completed in a counterbalanced order, matrix types were presented in a random order, and the location of the target picture within the different matrices was randomized.
Materials
256 different matrices were composed from 36 pictures; 21 pictures were selected from the International Affective Picture System (IAPS; Center for the Study of Emotion & Attention, 1999), and 15 pictures were selected from the Internet. A 2 × 2 repeated-measures analysis of variance (ANOVA) revealed that there were no significant differences in ratings for valence (p = .774) or arousal (p =.117) between pictures obtained online compared with IAPS pictures. Image luminance (hue, saturation, and value) and color were measured, using ImageJ software (version 1.43u; http://rsb.info.nih.gov/ij). An independent samples t test revealed that fear-relevant pictures differed from fear-irrelevant pictures in the value of the blue channel saturation, t(34) = −2.10, p <.05, but not red, t(34) = −0.79, p = .44, or green channels, t(34) = −1.43, p =.15, or luminance, t(34) = −0.69, p = .50. Furthermore picture complexity was determined using BIMP lite software (version 1.62) to compress images to JPEG format (Nummenmaa, Hyönä, & Calvo, 2006). An independent samples t test revealed that fear-relevant and fear-irrelevant pictures did not differ in their complexity, t(34) = −0.06, p = .95.
The 36 images were arranged to make 32 matrices of “all from the same category” for snakes, spiders, mushrooms, and flowers (128 total). There were also 16 trials of each discrepant target within a background of either fear-relevant or fear-irrelevant pictures (e.g., 16 trials of a discrepant snake among flowers, etc.) in which the location of the discrepant picture was randomized to any of the nine sites to avoid effects of target location (Öhman et al., 2001). The same 256 matrices were presented in a counterbalanced order for each of the exercise conditions so that they would never be exposed to the same order of matrices.
Ratings for both subjective experiences of valence (i.e., pleasantness) and arousal (i.e., excitement) during exercise as well as ratings of each individual picture viewed during the test trial were obtained using the Self-Assessment Manikin (SAM; Lang et al., 1997). In addition, during exercise participants were instructed to “indicate how you feel right now, at this moment” by pointing to the 9-point SAM scale with their finger.
Procedure
Testing occurred on 2 separate days, at the same time of day, no more than 7 days apart. On arrival at the laboratory on the first day, the participant read and signed an informed consent form that was approved by the Institutional Review Board and the battery of inventories was completed. The 7-day physical activity recall interview (Blair, 1984) was administered on the first day to confirm leisure and occupational physical activity within the past week. The rest condition and determination of VO2 peak (described below) were also completed on the first day. The moderate- and high-intensity exercise conditions were completed in a counterbalanced order on the second day of testing. Prior to commencing each of the three exercise conditions, participants completed the State-Trait Anxiety Inventory (Spielberger, Gorsuch, Lushene, Vagg, & Jacobs, 1983).
During each of the three experimental conditions, participants were seated on a Monark cycle (828E) ergometer (Varberg, Sweden) and viewed the same 256 picture matrix trials, which were presented randomly via E-Prime software (Psychological Software Tools, Inc) on an 18-in. Dell computer approximately 20 cm in front of the handle bars of the cycle ergometer at shoulder level. Participants were instructed to respond as quickly and accurately to each trial by pressing the 1 (index finger) on a button box (affixed to the table and reachable while the proximal portion of the hand rested on the handle bar) if all of the stimuli were of the same category and the 2 button (middle finger) if there was a discrepant picture present. Before the visual detection task began, instructions for indicating ratings of perceived exertion on a 6–20 scale (Borg, 1998) were provided (Cook, O’Connor, Eubanks, Smith, & Lee, 1997). During each trial, a white fixation cross was displayed for 1,000 ms, the picture matrix array was displayed for 1,200 ms, and then a blank screen was presented for 500 ms before the onset of the next trial.
During the second day of testing, the first exercise condition included a 4-min warm-up to define the range of resistance that was necessary to elicit the target exercise intensity. Subsequently, participants were instructed to maintain a pedal cadence in the region of 70 rotations per minute. Next, participants completed 12 practice trials and the ensuing experimental trials. Throughout the exercise conditions, intensity was verified by recording heart rate during short breaks (following the completion of trial numbers 64, 128, and 192) and adjusting the resistance, if necessary, to maintain the appropriate work rate. Ratings of perceived exertion and SAM ratings of current valence and arousal were also recorded during each break. Immediately after the completion of each exercise condition, participants indicated how well they were able to attend to the task on a 100-mm visual analog scale (VAS), ranging from 0 (no attention) to 100 (best possible attention; Smith & O’Connor, 2003). Between exercise conditions, 10 min of low-resistance active-recovery cycling and 10 min of passive seated rest (20 min total) was provided to allow partial but not full recovery from the exercise (Stamford, Weltman, Moffatt, & Sady, 1981). This procedure was repeated for the other exercise intensity (minus the warm-up). After the completion of the final exercise condition, participants rated each individual picture that appeared within the matrices for valence and arousal using the SAM.
Determination of VO2Peak
The maximal exercise test was performed on a Lode electronically braked cycle ergometer (Corival, Denmark) to determine the peak rate of oxygen uptake (VO2peak). A TrueOne 2400 (Parvo-Medics) metabolic cart was used to measure maximal oxygen uptake. Participants wore a Polar Heart-rate monitor (Oulu, Finland) to measure heart rate throughout the test.
Prior to the exercise test, volume and gas (O2 and CO2) analyzers were calibrated against known values. When the exercise commenced, the work rate began at 50 W for both male and female participants. To achieve their peak values between 8 and 12 min, the work rate for the male participants increased by 45 W each minute, whereas the work rate for female participants increased by 24 W each minute until volitional exhaustion. Participants were verbally encouraged to exercise as long as possible. Each participant then completed a 3-min cool-down at 50 W.
Minute ventilation (VE), oxygen consumption (VO2), production of carbon dioxide (VCO2), and the respiratory exchange ratio (VCO2/VO2) were recorded during the exercise test. Ratings of perceived exertion were recorded every 2 min of exercise and immediately after the test ended. The peak rate of oxygen consumption was recorded when participants had a respiratory exchange ratio value greater than 1.10, a heart rate at least 90% of age-predicted maximal heart rate (220–age), and a rating of perceived exertion of 18 or higher (Crabbe, Smith, & Dishman, 2007).
Data Analysis
All statistical analyses were completed by using SPSS 13.0 for Windows (SPSS, Chicago, IL). Demographic information was compared across genders by using independent samples t tests. The manipulation check variables (HR, RPE, VAS, state anxiety, and SAM ratings) were compared across exercise conditions, using one-way repeated measures analysis of variance (ANOVA).
The data for response accuracy and RT were analyzed using a 3 (exercise conditions) × 4 (matrix type) repeated-measures ANOVA. An alpha level of .05 was set for all statistical tests. For significant main effects and interactions, pairwise comparisons were performed, using paired-samples t tests. For all repeated-measures ANOVAs with more than two levels, the Huynh-Feldt epsilon was used to adjust the degrees of freedom when Mauchly’s test of sphericity was significant at p < .05. In these cases, corrected p values were reported with the original degrees of freedom, along with the associated Huynh-Feldt epsilon. To assess response accuracy, we labeled the response correct if it was the appropriate response to the presented matrix, and we determined the number of correct trials as a proportion for each exercise condition and matrix type. Finally, to control for response accuracy, we included only correct responses in the RT analyses.
Results
Figure 1 represents the mean response accuracy across the exercise conditions and matrix types. There were no differences between men and women for response accuracy during each exercise condition and no differences between men and women for response accuracy to each matrix type. Across matrix types, response accuracy during the rest condition (80.80%) was significantly lower (p < .001) than during the moderate-intensity exercise (90.30%) and significantly lower (p < .001) than during the high-intensity exercise condition (89.20%); exercise conditions, F(2, 58) = 23.82, p < .001 ( , ε = 0.806). However, there was no difference in response accuracy between the moderate-intensity exercise and high-intensity exercise conditions (p = .266; see Figure 2, top).
Figure 1.
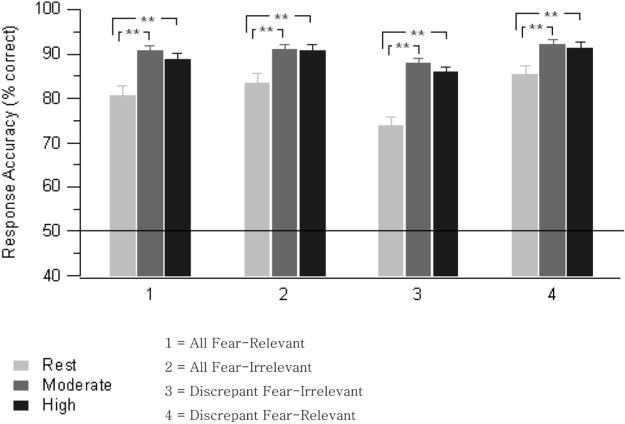
Mean response accuracy (% correct) during conditions of rest, moderate-intensity exercise, and high-intensity exercise and the four matrix trial types (N = 30). Error bars represent the SEM. The line across the graph at 50% represents performance due to chance. **p < .01.
Figure 2.
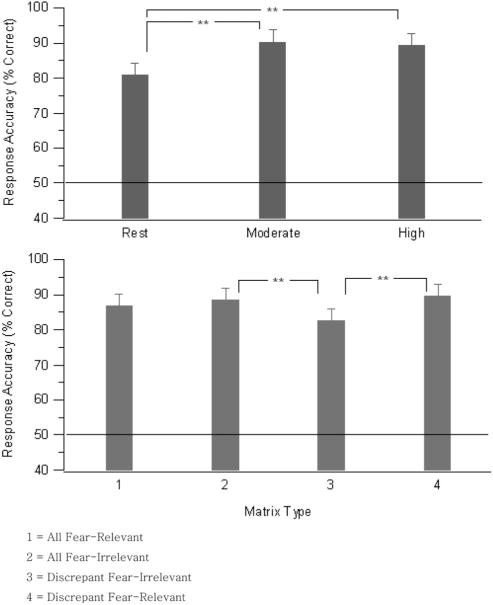
(top) Mean response accuracy (% correct) during conditions of rest, moderate- and high-intensity exercise (averaged across matrix type); (bottom) mean response accuracy (% correct) for each matrix type (averaged across exercise condition). Error bars represent the SEM. The line across the graph at 50% represents performance due to chance. **p < .01.
There was a significant main effect for response accuracy (percentage correct) for matrix type, F(3, 87) = 8.87, p = .001 ( , ε = 0.514). Across the exercise conditions, accuracy for the all-fear-relevant matrix (86.68%) was no different from any other matrix type, and the all-fear-irrelevant matrix (88.39%) was detected significantly more accurately (p < .001) than a discrepant fear-irrelevant matrix (82.47%). Finally, a discrepant fear-relevant matrix (89.55%) was detected significantly more accurately than a discrepant fear-irrelevant matrix (p < .001; see Figure 2, bottom).
There was a significant interaction between exercise condition and matrix type, F(6, 174) = 3.92, p = .002 ( , ε = 0.832). To decompose the two-way interaction, we analyzed the response accuracy data across matrix types separately within each exercise condition and also across exercise conditions within each matrix type, using one-way repeated measures ANOVAs. There was a significant effect of matrix type during rest, F(3, 87) = 11.74, p < .001 ( , ε = 0.638), illustrating that a discrepant fear-irrelevant matrix was identified with less accuracy than any other matrix type. During high-intensity exercise, a one-way ANOVA revealed a significant difference across matrix types, F(3, 87) = 4.03, p = .024 ( , ε = 0.654), showing that a discrepant fear-irrelevant matrix was detected less accurately than an all-fear-irrelevant matrix and a discrepant fear-relevant matrix. Although there were no significant differences across matrix types during moderate exercise (likely producing the significant interaction effect), the results suggest that the same pattern of accuracy was present in each condition; that is, a discrepant fear-irrelevant matrix was detected with the least accuracy followed by the all-fear-relevant matrix, the all-fear-irrelevant matrix, and finally the discrepant fear-relevant matrix, despite that individual contrasts did not always reach statistical significance.
For the tests of exercise condition within each matrix type, the all-fear-relevant, all-fear-irrelevant, and discrepant fear-relevant matrices were detected at a significantly lower accuracy rate (p < .006) during rest compared to moderate- or high-intensity exercise. The same pattern was observed for the main effect of exercise for the discrepant fear-irrelevant matrix, with the exception that the effect for greater accuracy during the moderate- compared to the high-intensity exercise condition was nearly significant (p = .056).
Figure 3 presents the mean RTs across the exercise condition and matrix types. Mean RT for the rest condition (823.4 ms) was significantly slower (p <.001) than the mean RT during moderate-intensity exercise (753.8 ms) and significantly slower (p < .001) than the mean RT during high-intensity exercise (747.0 ms); exercise condition, F(2, 58) = 35.73, p < .001 ( ). There was no difference for RTs between moderate- and high-intensity exercise (p = .446; see Figure 3).
Figure 3.
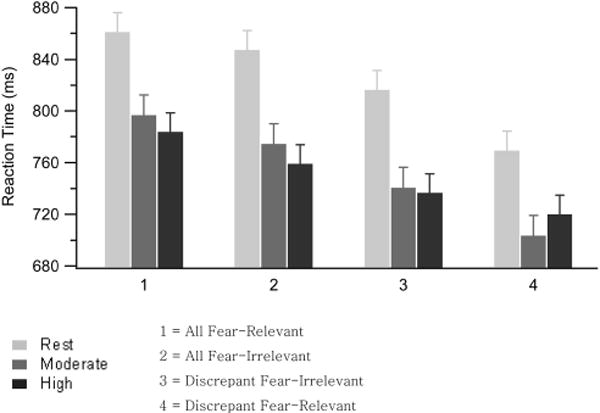
Mean reaction time (RT; in ms) for correctly identified trials during conditions of rest, moderate-intensity exercise, and high-intensity exercise and the four matrix trial types (N = 30). Within each matrix type, RT is equally faster during moderate- and high-intensity exercise compared with rest. Error bars represent the SEM.
Across all exercise conditions, a matrix with a discrepant picture (745.8 ms) was detected significantly faster (p < .001) than a matrix that contained all pictures from the same category (803.64 ms); matrix type, F(3, 87) = 44.07, p < .001 ( , ε = 0.641). Specifically, the all fear-relevant matrix (813.7 ms) was detected significantly slower (p = .001) than the all-fear-irrelevant matrix (793.5 ms) and both discrepant matrix trial types (p < .001). The all-fear-irrelevant matrix was detected significantly slower (p < .003) than the discrepant fear-irrelevant matrix type (764.5 ms) and significantly slower (p = .002) than the discrepant fear-relevant matrix trial type (727.1 ms). Finally, the detection of the discrepant fear-relevant matrix type was significantly faster (p < .001) than all other matrix types (see Figure 3). There was not a significant interaction between exercise condition and matrix type for RT, F(6, 174) = 2.13, p = .062 ( , ε = 0.871).
The mean heart rate, mean percentage of maximum heart rate, ratings of perceived exertion (RPE), and subjective ability to attend to the task during each exercise condition are reported in Table 2. There were significant differences in heart rate across conditions, F(2, 58) = 540.9, p < .001 ( ), and RPE, F(2, 58) = 230.15, p < .001 ( ) across conditions. VAS scores for the ratings of subjective ability to attend to the material during the high-intensity exercise condition were significantly lower than the rest (p = .003) and moderate-intensity exercise condition (p=.006); overall, F(2, 58) = 7.53, p = .002 ( ).
Table 2.
Manipulation Checks Across Exercise Conditions
| Exercise Conditions
|
|||
|---|---|---|---|
| Rest (N= 30) |
Moderate (N = 31) |
High (N = 32) |
|
| Variable Heart rate (bpm) | 87.9 ± 9.7† | 127.1 ± 14.9† | 167.9 ± 13.6† |
| Maximal heart rate (%) | 44.4 | 64.2 | 84.8 |
| RPE | 7.7 ± 1.9† | 10.6 ± 1.8† | 16.1 ± 1.8† |
| SAM-A | 4.3 ± 1.3 | 4.3 ± 1.7 | 5.0 ± 1.9* |
| SAM-V | 6.2 ± 1.7 | 6.4 ± 1.2 | 5.7 ± 1.5 |
| VAS | 82.9 ± 8.6 | 77.9 ± 16.3 | 70.3 ± 20.8* |
| State anxiety (STAI-Y1) | 42.3 ± 6.0 | 43.4 ± 6.7 | 43.4 ± 6.5 |
Note. Data are expressed as mean ± standard deviation. HR = heart rate; RPE = rating of perceived exertion; maximal heart rate = 220 − age; SAM-A = Self-Assessment Manikin for Arousal; SAM-V = Self-Assessment Manikin for Valence; VAS = Visual Analog Scale (0 to 100).
p < .001.
p < .05.
Additionally, there were significant differences in rated arousal across exercise conditions, F(2, 58) = 4.34, p = .018 ( ). The mean arousal rating during the high-intensity exercise condition was significantly greater compared with the rest (p = .009) and moderate-intensity exercise condition (p = .031). There were no significant differences across conditions for valence ratings, F(2, 58) = 2.52, p = .097 ( , ε = 0.87; see Table 2). Finally, there were no significant differences in state anxiety across conditions (see Table 2).
For SAM-V, a one-way repeated measures ANOVA revealed a significant difference across pictures, F(3, 84) = 43.04, p < .001, . Specifically, flowers were rated as significantly more pleasant (p < .001) than mushrooms, significantly more pleasant (p < .001) than snakes, and significantly more pleasant (p < .001) than spiders. Additionally, mushrooms were rated as more pleasant (p = .006) than spiders but not different from snakes (p = .355). Finally, there was no significant difference in valence ratings between spiders and snakes (p = .099).
The SAM-A ratings for snakes were significantly higher (p = .002) than the ratings for flowers and significantly higher than mushrooms (p < .001). Spiders were also rated as significantly more arousing than flowers (p = .003) and mushrooms (p < .001). These effects are consistent with the intended manipulation of fear relevance within the picture matrices.
Because the resting baseline condition was always the first condition completed, the data were analyzed by condition order based on means from each 25% (64) of the trials during each condition. This analysis was done to measure not only potential order effects across conditions but also the potential change over time within each condition. The results of a 3 (order) × 4 (trial fourth) repeated-measures ANOVA revealed a significant difference in response accuracy F(2, 58) = 12.40, p < .001, ( , ε = 0.701) and RT, F(2, 56) = 49.76, p < .001 ( , ε = 0.825) across orders. Pairwise comparisons indicated response accuracy and RTs for the first completed order, which was always rest, were significantly worse and slower, respectively, compared to the second and third completed orders (p < .001), and the second completed order was also significantly different than the third completed order (p < .001).
Discussion
Effects of Exercise
This study used a dual-task paradigm to test two hypotheses in regard to the potential effects of moderate- and high-intensity exercise on performance during a threat-detection task. On the one hand, it has been suggested that if threat is detected in an automatic and parallel process, a single fear-relevant stimulus among nonfear relevant stimuli should be resistant to the effects of competing processes or physiological arousal (Öhman & Mineka, 2001). On the other hand, if exercise influences the allocation of attention or the subsequent cognitive processes associated with recognition, it was expected that there would be observable degradation in threat-detection performance as exercise intensity increased (Chmura et al., 1994; McMorris, Collard, Corbett, Dicks, & Swain, 2008; Pesce et al., 2003). However, neither of these two hypotheses was supported. Rather, we observed that threat-detection performance was improved during moderate- and high-intensity exercise in both response accuracy and RT.
It is interesting to note that we also observed an interaction between exercise intensity and detection accuracy that suggests greater accuracy to detect a discrepant fear-irrelevant stimulus during moderate-intensity exercise compared with high-intensity exercise. On the basis of this finding, one may speculate that the accuracy of visually detecting any type of discrepant stimulus may be best enhanced during moderate- as opposed to high-intensity exercise. This may be particularly pertinent during situations in which it is critically important to detect both threatening and nonthreatening stimuli, for example, when encountering a civilian or avoiding “friendly fire” during a military operation. This effect, if meaningful, requires replication by using different types of tasks. Despite this significant interaction for response accuracy, the largest and most stable effects appear to be the main effects for exercise condition (lower accuracy during rest; see Figure 2, top) and matrix type (lower accuracy for a discrepant fear-irrelevant matrix; see Figure 2, bottom).
Exercise may affect physiological processes through alterations in core temperature, blood flow, circulating catecholamines, or other neurotransmitter release, as well as changes in emotional states or fatigue (Moraes et al., 2007; Tomporowski & Hatfield, 2005). Although there have been few studies that use emotional stimuli, there are previous studies that report findings that support the facilitative role of physical exertion in cognitive processes. For example, it has been reported that when searching a four-item matrix for target letters or numbers, individuals had faster RT during a sway condition (i.e., more physically challenging) when compared to rest (Broglio, Tomporowski & Ferrara, 2005). In another study, compared to a rest condition, RT during a flanker task was faster following an acute 20-min bout of light-, moderate-, and high-intensity cycle exercise with no differences for response accuracy (Kamijo, Nishihira, Higashiura, & Kuroiwa, 2007).
A recent study performed by Audiffren, Tomporowski, and Zagrodnik (2008) reported that the improvements in RT to an auditory stimulus during moderate-intensity exercise was most accounted for by an enhancement of motor times, or the duration of the communication involving the muscle fibers as opposed to earlier stages of information processing. It is interesting to note that in that study, this improvement did not take place until approximately 15 min into the exercise bout. Improvements in this study for response times occurred in exercise conditions that lasted fewer than 15 min. McMorris et al. (2008) also reported faster movement time to release a depressed button at 40% and 80% maximal power output, whereas RT (to press an identification button) during exercise was slower during exercise at 80% maximal power output, supporting that exercise may be exerting its benefit through augmented motor unit communication.
Many additional physiological factors have yet to be explored in the pursuit to define the mechanism by which exercise affects cognitive processing. It is clear that acute exercise at a moderate intensity increases plasma catecholamines, plasma levels of dopamine and norepinephrine by-products, brain-derived neurotrophic factor as well as general cholinergic activity in the hippocampus (Audiffren et al., 2008; Cotman & Berchtold, 2002; McMorris et al., 2008). On the contrary, there is no evidence of a direct cause-and-effect relationship between these elevated substances and subsequent changes in response time to emotional stimuli. One could, nonetheless, speculate that exercise-induced increases in HPA-axis and sympathetic nervous system activity may impact the ability to focus attention and modulate the feedback through the ventral pathway between the visual cortex and the amygdala, communication between the amygdala and frontoparietal networks involved in threat processing, or both (Vuilleumier, 2005). It is also plausible that exercise may affect the speed of communication between the CNS and motor efferents (Audiffren et al., 2008). Together, these effects may facilitate responses to threat that would be adaptive. A future study that examined the neural substrates of threat-detection performance during exercise by using EEG, along with indices of HPA-axis and sympathetic nervous-system activation, may help elucidate these potential interactions.
An interesting finding in this study was the lack of differences in response times or response accuracy between the two exercise conditions. The lack of a speed for accuracy trade-off in the current study further supports the suggestion that exercise may enhance threat-detection performance not only through sensitization of the motor system but also through an interaction between limbic and motor systems critical to the performance of motivated behavior (Mogenson & Yang, 1991). This contradicts several of the conclusions discussed in previous work. For example, RTs recorded during incremental cycling bouts in endurance athletes illustrated that there was a significant decrease in performance as measured through RT to sounds and colors at an exercise intensity of 76% VO2 max or at approximately 164 heartbeats per minute (Chmura et al., 1994). The participants in this study were slightly below average fitness, and their average heart rate during the high-intensity exercise was approximately 170 beats per minute. These factors, when combined with the collected behavioral data, indicate that in our experiment, exercise at a relatively higher intensity did not result in a sharp decrease in performance. This finding suggests that threatening stimuli may not be subject to the same limitations on attention as other types of visual stimuli.
Furthermore, there were no differences in performance between the moderate- and high-intensity exercise conditions, albeit, participants reported significantly higher ratings of arousal during the high-intensity exercise. This finding suggests that it is not the single dimension of subjectively reported arousal of the individual that is driving the improved performance (Schimmack, 2005). However, participants did rate their ability to attend to the stimuli during high-intensity exercise lower than during rest or moderate-intensity exercise even though their performance did not reflect this difference. Furthermore, neither ratings of valence nor state anxiety differed across conditions. Together, these reports combine to form a vague conclusion that threat detection may be impervious to the effects of subjective arousal, persons’ perception of their ability to attend to the material, subjective valence, or state anxiety.
An additional potential contributing factor to be considered is that during exercise, an individuals’ visual field or focus may narrow and thus enhance the ability to attend to the relevant stimuli and ignore irrelevant peripheral information (Janelle, Singer, & Williams, 1999; Pesce et al., 2003). High-intensity exercise would suggest that participants were experiencing higher amounts of stress, forcing their visual field to narrow, which may be an explanation of the reported decrease in ability to attend to the stimuli without a concurrent decrease in performance (Janelle et al., 1999). It would be interesting to test this effect on a more challenging cognitive task that requires peripheral information to be addressed. Overall, it is clear that the relationship between exercise, emotion, and attention is complex and involves the combination of several potential variables, ranging from metabolites in the blood to changes in peripheral eye movements.
Response Accuracy and RT During Threat Detection
Response accuracy using this paradigm has not been consistently reported (Lipp, Derakshan, Waters, & Logies, 2004; Öhman et al., 2001; Tipples, Young, & Quinlan, 2002) and, therefore, no specific hypothesis was formulated. This study revealed that participants were less accurate when identifying the discrepant fear-irrelevant matrix compared with both a discrepant fear-relevant matrix and all-fear-irrelevant matrices. However, there was no difference between the error rates for a discrepant fear-irrelevant matrix and the all-fear-relevant matrix. It is difficult to suggest why these results were found, but it may be related to the inability to ignore irrelevant background fear-relevant stimuli, some aspect of engaging in exercise, or the type of pictures included in the matrices (Larson, Aronoff, & Stearns, 2007).
On the other hand, previously published data (including the current findings) for RTs during a threat-detection task clearly support the claim that a fear-relevant discrepant target is detected most rapidly (Lipp et al., 2004; Lobue & DeLoache, 2008; Tipples et al., 2002). That is, a matrix that has one snake or spider in a background of either flowers or mushrooms was more quickly identified correctly than any other type of matrix.
Contrary to one previous study (Lipp et al., 2004), the current data reported that all fear-relevant matrices were the slowest to be identified. Though the comparison between the all-same matrix types has not received extensive discussion in literature, one hypothesis is that a greater latency reflects a resistance to disengage from threatening stimuli (Brosch & Sharma, 2005; Larson et al., 2007). This process may partially explain why a discrepant fear-irrelevant matrix is detected slower than a discrepant fear-relevant matrix; the individual takes longer to disengage from the background of arousing threatening distractors compared with a background of neutral nonthreatening plant distractors. Thus, the detection advantage of fear-relevant stimuli may be a function of both fast identification and rapid disengagement of irrelevant nonthreatening environmental stimuli.
Limitations
These findings can only be generalized to healthy normally physically active college students who do not report high anxiety or a fear of snakes or spiders. In an effort to record a true baseline for the threat-detection task, we completed the rest condition on a day when there was no prior exercise. Because the rest condition was always the first condition completed, we examined the effect of condition order on response accuracy and RT. Despite providing 12 practice trials prior to the experimental trials, response accuracy during the first completed order (always rest) was significantly lower than the second and third completed orders (counterbalanced moderate- and high-intensity conditions). Additionally, response accuracy during the second completed order was significantly lower than the third completed order. Similarly, RT for the first completed order was significantly slower than the second and third completed orders, and RT during the second completed order was slower than the third completed order. This type of order effect has been reported previously by Larson et al. (2007) where response accuracy during a visual search was slower and less accurate during the first 25% of trials.
To better address and understand the observed order effect, we performed further statistical analyses. For response accuracy and response time, the same 3 (exercise condition) × 4 (matrix type) repeated-measure ANOVA was performed, but excluding the first 25% of the data (64 trials) from the rest, moderate-intensity and high-intensity exercise conditions (Larson et al., 2007). However, the effect of exercise on response accuracy and RT did not change after removal of these trials. The seated rest baseline condition has been completed in several other studies prior to the experimental exercise conditions (Hillman, Snook, & Jerome, 2003; Moraes et al., 2007). Nevertheless, future work should have the rest and exercise conditions completed in a counterbalanced order on separate days. These effects may also be avoided by providing more practice trials or a familiarization session prior to testing (Broglio et al., 2005; Davranche, Audiffren, & Denjean, 2006; Fischer & Schubert, 2008; Kamijo et al., 2007).
The presence of the order effect could be attributable to a number of factors, such as becoming more familiar with the environment, developing more efficient search strategies or repetition. However, in lieu of this result, the findings remain relevant in terms of theoretical significance for a few reasons. First, according to Öhman and Mineka (2001), one of the necessary criteria to support the fear module is that detection of threat is automatic and thus immune to learning or order effects. The current findings do not support the automaticity of a fear module (Lipp et al., 2004; Tipples et al., 2002). If the results are because of an order effect, they are relevant to the automaticity of threat detection and further illustrate the complexity of the factors involved. Second, in simple RT tests, performance has been shown to deteriorate over time, and exercise may, on some level, prevent the boredom thought to drive this effect (Feinstein, Brown, & Ron, 1994). Finally, in a repeated-measures visual search task similar in design and content, Larson et al. (2007) found a comparable trend for an improvement in both RT and accuracy that was compensated for by excluding the first block of trials and reporting the data from the remaining trials. The same type of analysis in the current data did not remove this effect. Thus, it is plausible that the large effect of exercise to reduce RT (generally by more than 50 ms) and improve accuracy (generally by about 10%) reflects a real effect of exercise that may have summated with those attributable to the aforementioned alternative explanations.
Implications
The implications of this study span broad theory conceptualization as well as behavioral training tactics. First, although the main effect for matrix type supports the claim of a fear-based module, there are a number of findings, such as the performance improvement over time, that abrogate this theory. Additionally, the results have implication for theories concerning the way exercise might affect simultaneously performed cognitive processes. Although threat detection may not be an example of a purely executive function task, it does involve making physical distinctions between classes of stimuli as well as a decision-making process in regard to the overall composition of the matrix. Thus, there is reason to believe that concurrently performed exercise does not inhibit all cognitive processes and questions the generalizability of the relationship to executive function processes. Though the mechanism is not clear, the overriding theme appears to be that exercise, whether through an activation of motor systems or through an improved ability to assess threat, facilitates one’s ability to respond to a visual threat-detection task.
The implications of the reported results also have application for behavioral training in athletics, armed forces, and other environments where individuals may be exposed to threat. These data would suggest that as opposed to sitting still in a dangerous setting, your body may be better prepared to identify threat if you are engaging in moderate- or high-intensity exercise. Therefore, it could be useful to examine training techniques to control heart rate if arousal levels are too low prior to patrolling a hostile neighborhood. This improvement in attention may lead to more rapid and efficient distinction between threatening and nonthreatening objects.
Future research in this body of literature should focus on three main factors. First, to support or disprove the existence of a fear module, researchers must collect more data from functional MRI. Responses to evolutionary significant threatening stimuli must be separate in their neural pathways than the responses to other stimuli, such as pleasant animals or more recently evolved ontogenetic material such as guns and bombs. Second, the current methods of measuring threat detection are not indicative of responses in a real life-threatening situation. Therefore, novel ways of testing threat should include realistic settings, such as virtual reality environments, as opposed to testing static visual stimuli in a laboratory setting.
Third, to research the mechanism through which exercise affects cognitive ability, researchers should address more variables that might be contributing to performance. For example, chemicals from the blood, such as catecholamines or cortisol, should be collected during dual-task exercise conditions to elucidate potential relationships. For example, is this improvement positively or negatively correlated to lactate accumulation or cortisol? Furthermore, replication of the used methods of our study should be done to include a true counterbalance of the completed orders across participants, and authors should consider providing a familiarization session to eliminate potential learning effects.
Conclusion
In summary, response accuracy and RT to detect threat in a complex visual array was enhanced during moderate- and high-intensity exercise when compared with a rest condition. This finding suggests that some of the physiological changes associated with exercise enhance a healthy physically active adult’s ability to visually detect threatening stimuli. Because there were no differences in performance during the two exercise conditions, despite higher subjectively rated and physiologically measured arousal during high-intensity exercise, it must be a mechanism other than or in addition to general arousal that drives these effects. It is possible that exercise may prime motor efferents networked to defensive motivational brain systems. These findings indicate that moderate- and high-intensity exercise do not interfere with visual target detection, and supports the hypothesis that exercise may facilitate the rapid detection of threat.
Footnotes
This work was completed in partial fulfillment for the requirements of the Master of Science degree for Morgan R. Shields.
Contributor Information
Morgan R. Shields, Department of Human Movement Sciences, University of Wisconsin-Milwaukee
Christine L. Larson, Department of Psychology, University of Wisconsin-Milwaukee
Ann M. Swartz, Department of Human Movement Sciences, University of Wisconsin-Milwaukee
J. Carson Smith, Department of Human Movement Sciences, University of Wisconsin-MilwaukeeDepartment of Health Sciences at the University of Wisconsin-Milwaukee.
References
- Audiffren M, Tomporowski PD, Zagrodnik J. Acute aerobic exercise and information processing: Energizing motor processes during a choice reaction time task. Acta Psychologica. 2008;129:410–419. doi: 10.1016/j.actpsy.2008.09.006. [DOI] [PubMed] [Google Scholar]
- Blair SN. How to assess exercise habits and physical fitness. In: Matarazzzo JD, Weiss SM, Herd JA, editors. Behavioral health. Chichester, England: Wiley; 1984. pp. 431–439. [Google Scholar]
- Borg G. Borg’s perceived exertion and pain scales. Champaign, IL: Human Kinetics; 1998. [Google Scholar]
- Broglio SP, Tomporowski PD, Ferrara MS. Balance performance with a cognitive task: A dual-task testing paradigm. Medicine and Science in Sports and Exercise. 2005;37:689–695. doi: 10.1249/01.mss.0000159019.14919.09. [DOI] [PubMed] [Google Scholar]
- Brosch T, Sharma D. The role of fear-relevant stimuli in visual search: A comparison of phylogenetic and ontogenetic stimuli. Emotion. 2005;5:360–364. doi: 10.1037/1528-3542.5.3.360. [DOI] [PubMed] [Google Scholar]
- Cave KR, Batty MJ. Searching for features to searching for threat: Drawing the boundary between preattentive and attentive vision. Visual Cognition. 2006;14:629–646. [Google Scholar]
- Center for the Study of Emotions and Attention [CSEA-NIMH] The international affective picture system: Digitized photographs Gainesville. FL: The Center for Research in Psychophysiology, University of Florida; 1999. [Google Scholar]
- Chmura J, Nazar K, Kaciuba-Uścilko Choice reaction time during graded exercise in relation to blood lactate and plasma catecholamine thresholds. International Journal of Sports Medicine. 1994;15:172–176. doi: 10.1055/s-2007-1021042. [DOI] [PubMed] [Google Scholar]
- Cook DB, O’Connor PJ, Eubanks SA, Smith JC, Lee M. Naturally occurring muscle pain during exercise: Assessment and experimental evidence. Medicine and Science in Sports and Exercise. 1997;29:999–1012. doi: 10.1097/00005768-199708000-00004. [DOI] [PubMed] [Google Scholar]
- Corbetta M, Shulman GL. Control of goal-directed and stimulus-driven attention in the brain. Nature Reviews Neuroscience. 2002;3:201–215. doi: 10.1038/nrn755. [DOI] [PubMed] [Google Scholar]
- Cotman CW, Berchtold NC. Exercise: A behavioral intervention to enhance brain health and plasticity. Trends in Neurosciences. 2002;25:295–301. doi: 10.1016/s0166-2236(02)02143-4. [DOI] [PubMed] [Google Scholar]
- Crabbe JB, Smith JC, Dishman RK. Emotional & electroencephalographic responses during affective picture viewing after exercise. Physiology & Behavior. 2007;90:394–404. doi: 10.1016/j.physbeh.2006.10.001. [DOI] [PubMed] [Google Scholar]
- Davranche K, Audiffren M, Denjean A. A distributional analysis of the effect of physical exercise on a choice reaction time task. Journal of Sports Sciences. 2006;24:323–329. doi: 10.1080/02640410500132165. [DOI] [PubMed] [Google Scholar]
- Dietrich A, Sparling PB. Endurance exercise selectively impairs prefrontal-dependent cognition. Brain and Cognition. 2004;55:516–524. doi: 10.1016/j.bandc.2004.03.002. [DOI] [PubMed] [Google Scholar]
- Dishman RK, Steinhardt M. Reliability and concurrent validity for a 7-d re-call of physical activity in college students. Medicine & Science in Sports & Exercise. 1988;20:14–25. doi: 10.1249/00005768-198802000-00003. [DOI] [PubMed] [Google Scholar]
- Feinstein A, Brown R, Ron M. Effects of practice serial tests of attention in healthy subjects. Journal of Clinical and Experimental Neuropsychology. 1994;16:436–447. doi: 10.1080/01688639408402654. [DOI] [PubMed] [Google Scholar]
- Fischer R, Schubert T. Valence processing bypassing the response selection bottleneck? Experimental Psychology. 2008;55:203–211. doi: 10.1027/1618-3169.55.3.203. [DOI] [PubMed] [Google Scholar]
- Fredrikson M. Reliability and validity of some specific fear questionnaires. Scandinavian Journal of Psychology. 1983;24:331–334. doi: 10.1111/j.1467-9450.1983.tb00507.x. [DOI] [PubMed] [Google Scholar]
- Godin G, Shepard RJ. A simple method to assess exercise behavior in the community. Canadian Journal of Applied Sports Science. 1985;10:141–146. [PubMed] [Google Scholar]
- Hillman CH, Snook EM, Jerome GJ. Acute cardiovascular exercise and executive control function. International Journal of Psychophysiology. 2003;48:307–314. doi: 10.1016/s0167-8760(03)00080-1. [DOI] [PubMed] [Google Scholar]
- Janelle CM, Singer RN, Williams AM. External distraction and attentional narrowing: Visual search evidence. Journal of Sport & Exercise Psychology. 1999;21:70–91. [Google Scholar]
- Kamijo K, Nishihira Y, Higashiura T, Kuroiwa K. The interactive effect of exercise intensity and task difficulty on human cognitive processing. International Journal of Psychophysiology. 2007;65:114–121. doi: 10.1016/j.ijpsycho.2007.04.001. [DOI] [PubMed] [Google Scholar]
- Klorman R, Weerts TC, Hastings JE, Melamed BC, Lang PJ. Psychometric description of some specific-fear questionnaires. Behavior Therapy. 1974;5:401–409. [Google Scholar]
- Lang PJ, Bradley MM, Cuthbert BN. Motivated attention: Affect, activation, and action. In: Lang PJ, Simons RF, Balaban MT, editors. Attention and orienting: Sensory and motivational processes. Mahwah, NJ: Erlbaum; 1997. pp. 97–135. [Google Scholar]
- Larson CL, Aronoff J, Stearns JJ. The shape of threat: Simple geometric forms evoke rapid and sustained capture of attention. Emotion. 2007;7:526–534. doi: 10.1037/1528-3542.7.3.526. [DOI] [PubMed] [Google Scholar]
- Lipp OV, Derakshan N, Waters AM, Logies S. Snakes and cats in the flower bed: Fast detection is not specific to pictures of fear-relevant animals. Emotion. 2004;4:233–250. doi: 10.1037/1528-3542.4.3.233. [DOI] [PubMed] [Google Scholar]
- Lobue V, DeLoache JS. Detecting the snake in the grass: Attention to fear-relevant stimuli by adults and young children. Psychological Science. 2008;19:284–289. doi: 10.1111/j.1467-9280.2008.02081.x. [DOI] [PubMed] [Google Scholar]
- Matthews G, Davies DR. Individual differences in energetic arousal and sustained attention: A dual-task study. Personality and Individual Differences. 2001;31:575–589. [Google Scholar]
- McMorris T, Collard K, Corbett J, Dicks M, Swain JP. A test of the catecholamines hypothesis for an acute exercise-cognition interaction. Pharmacology, Biochemistry, and Behavior. 2008;89:106–115. doi: 10.1016/j.pbb.2007.11.007. [DOI] [PubMed] [Google Scholar]
- Mogenson GJ, Yang CR. The contribution of basal forebrain to limbic-motor integration and the mediation of motivation to action. Advances in Experimental Medicine and Biology. 1991;295:267–290. doi: 10.1007/978-1-4757-0145-6_14. [DOI] [PubMed] [Google Scholar]
- Moraes H, Ferreira C, Deslandes A, Cagy M, Pompeu F, Ribeiro P, Piedade R. Beta and alpha electroencephalographic activity changes after acute exercise. Arquivos de Neuropsiquiatria. 2007;65:637–641. doi: 10.1590/s0004-282x2007000400018. [DOI] [PubMed] [Google Scholar]
- Nummenmaa L, Höynä J, Calvo MG. Eye movement assessment of selective attentional capture by emotional pictures. Emotion. 2006;6:257–268. doi: 10.1037/1528-3542.6.2.257. [DOI] [PubMed] [Google Scholar]
- Öhman A, Flykt A, Esteves F. Emotion drives attention: Detecting the snake in the grass. Journal of Experimental Psychology. 2001;130:466–478. doi: 10.1037/0096-3445.130.3.466. [DOI] [PubMed] [Google Scholar]
- Öhman A, Mineka S. Fears, phobias, and preparedness: Toward an evolved module of fear and fear learning. Psychological Review. 2001;108:483–522. doi: 10.1037/0033-295x.108.3.483. [DOI] [PubMed] [Google Scholar]
- Oldfield RC. The assessment and analysis of handedness: The Edinburgh inventory. Neuropsychologia. 1971;9:97–113. doi: 10.1016/0028-3932(71)90067-4. [DOI] [PubMed] [Google Scholar]
- Pesce C, Capranica L, Tessitore A, Figura F. Focusing of visual attention under submaximal physical load. International Journal of Sport and Exercise Psychology. 2003;1:275–292. [Google Scholar]
- Pontifex MB, Hillman CH. Neuroelectric and behavioral indices of interference control during acute cycling. Clinical Neurophysiology. 2007;118:570–580. doi: 10.1016/j.clinph.2006.09.029. [DOI] [PubMed] [Google Scholar]
- Schimmack U. Attentional interference effects of emotional pictures: Threat, negativity, or arousal. Emotion. 2005;5:55–66. doi: 10.1037/1528-3542.5.1.55. [DOI] [PubMed] [Google Scholar]
- Shvartz E, Reibold RC. Aerobic fitness norms for males and females aged 6 to 75 years: A review. Aviation, Space, and Environmental Medicine. 1990;61:3–11. [PubMed] [Google Scholar]
- Smith JC, O’Connor PJ. Physical activity does not disturb the measurement of startle and corrugator responses during affective picture viewing. Biological Psychology. 2003;63:293–310. doi: 10.1016/s0301-0511(03)00072-3. [DOI] [PubMed] [Google Scholar]
- Spielberger CD, Gorsuch RL, Lushene PR, Vagg PR, Jacons GA. Manual for the State-Trait Anxiety Inventory. Palo Alto, CA: Consulting Psychologists Press; 1983. [Google Scholar]
- Stamford BA, Weltman A, Moffatt R, Sady S. Exercise recovery above and below anaerobic threshold following maximal work. Journal of Applied Physiology. 1981;51:840–844. doi: 10.1152/jappl.1981.51.4.840. [DOI] [PubMed] [Google Scholar]
- Tipples J, Young AW, Quinlan P. Searching for threat. The Quarterly Journal of Experimental Psychology. 2002;55A:1007–1026. doi: 10.1080/02724980143000659. [DOI] [PubMed] [Google Scholar]
- Tomporowski PD, Hatfield BD. Effects of exercise on neurocognitive functions. International Journal of Sport and Exercise Psychology. 2005;3:263–279. [Google Scholar]
- U.S. Department of Health and Human Services. Physical activity and health: A report of the Surgeon General. Atlanta, GA: U.S. Department of Health and Human Services, Public Health Service, National Center for Chronic Disease Prevention and Health Promotion; 1996. [Google Scholar]
- Vuilleumier P. How brains beware: Neural mechanisms of emotional attention. Trends in Cognitive Sciences. 2005;9:585–594. doi: 10.1016/j.tics.2005.10.011. [DOI] [PubMed] [Google Scholar]