Abstract
A testing methodology was developed to expose photopolymer resins and measure the cured material to determine two key parameters related to the photopolymerization process: Ec (critical energy to initiate polymerization) and Dp (penetration depth of curing light). Five commercially available resins were evaluated under exposure from 365 nm and 405 nm light at varying power densities and energies. Three different methods for determining the thickness of the cured resin were evaluated. Caliper measurements, stylus profilometry, and confocal laser scanning microscopy showed similar results for hard materials while caliper measurement of a soft, elastomeric material proved inaccurate. Working curves for the five photopolymers showed unique behavior both within and among the resins as a function of curing light wavelength. Ec and Dp for the five resins showed variations as large as 10×. Variations of this magnitude, if unknown to the user and not controlled for, will clearly affect printed part quality. This points to the need for a standardized approach for determining and disseminating these, and perhaps, other key parameters.
Keywords: photopolymers, UV curing, working curves, stereo lithography, profilometry, confocal microscopy
1. Introduction
The use of additive manufacturing (AM) methods to create parts and products beyond the abilities of traditional subtractive or molding manufacturing methods has grown rapidly in recent years. AM, or 3D printing, holds the promise of nearly unlimited design and creation flexibility using either metal or soft material-based AM processes. This has led to broad-based implementation of the various processes to create objects from consumer-level trinkets to medical devices to in-service parts for automotive and aerospace applications. However, continued movement from proof-of-concept design evaluation applications (i.e., rapid prototyping) toward truly functional prototypes and volume production of reliable parts requires a more robust and rigorous investigation of starting material properties and the process parameters that impact final part quality.
One of the earliest introduced forms of 3D printing involves the curing of photosensitive liquid polymers using intense UV light sources. Variations of this approach include stereolithography (SL) and digital light projection (DLP) [1, 2]. Successful printing of objects by these methods requires some predetermined knowledge of the photocuring properties of the starting material (viscosity, critical energy for polymerization, photon penetration depth) and processing capabilities of the printer (photon wavelength, power density). Unfortunately, this information is often not provided or, if provided, few details are given as to how the values were determined or to what degree they are under control. The lack of this basic information or the unknown quality of the data could very likely impact the manufacturability and properties of the final product. Additionally, the magnitude of that impact is not yet known.
Principles laid out by Jacobs to describe the SL or DLP photopolymerization process [1] can be used to create a working curve that provides two key parameters that govern the polymerization of photosensitive resins: penetration depth of the curing light and the energy required for polymerization. The penetration of light follows a Beer-Lambert relationship:
| (1) |
where Pz is the power of light (usually in mW/cm2) at some depth, z, below the surface and P0 is the power at the surface. Dp is the depth at which the penetrating light intensity falls to 1/e of the surface intensity. The penetration depth will be resin-specific and is related to the resin’s absorbance characteristics related to the resin’s composition [3]. In practice the power terms are converted to energy and z becomes the cure depth when the appropriate amount on light is present. This leads to Jacobs’ basic working curve equation:
| (2) |
where Cd is the depth/thickness of cured resin, E0 is the energy of light at the surface, and Ec is the “critical” energy required to initiate polymerization [1]. A semilog plot of Cd vs. E0 produces a straight line curve with a slope of Dp and a x-intercept of Ec. Armed with Dp and Ec, exposure parameters can be chosen that optimize the printing process to achieve the desired part properties. For example, high resolution printing in a layer-by-layer printing process like SL or DLP relies on minimizing the thickness of the deposited and cured layer. Knowing Dp and Ec allows the user or printer manufacturer to choose the appropriate settings of light exposure (power, scan speed) and z-axis increments to optimize the curing conditions to achieve desired results.
Accurate determination of E0 is straightforward as there are numerous commercially available light power meters with good precision and traceability to industry standards. Determining Cd, however, is subject to more variability since there is no defined or consensus method for making the measurement. The most common and simplest method is to use micrometers or calipers to measure the thickness of the cured material [3-6]. Early versions of commercial stereolithography printers from 3D Systems included a built-in diagnostic methodology based on this approach, named WINDOWPANE [7]. Other approaches employ optical microscopy [8-10]. However, there does not appear to be any systematic evaluation of the measurement process itself or its impact on determining Dp and Ec. As a first step to address this issue, this investigation sets out to evaluate a methodology developed to expose photopolymers to UV light and measure the depth/thickness of the cured material. Once the approach has been validated the method will be used to determine Dp and Ec from several commercially available resins while varying the intensity and wavelength of the curing light.
2. Materials and methods
Commercially available photopolymer resins were obtained from several suppliers*. VeroWhitePlus (RGD835), TangoBlackPlus (FLX980), and VeroClear (RGD810) were obtained from Stratasys Ltd. (Eden Prairie, MN, USA). Formlabs Clear (FLGPCL02) was obtained from Formlabs (Somerville, MA, USA) and Standard Clear PR48 was obtained from Ember-Autodesk, Inc. (San Rafael, CA, USA). For curing experiments, all resins were used without modification.
UV-VIS spectrophotometry was performed using a UV-1800 spectrophotometer (Shimadzu Corporation, Columbia, MD, USA). Absorbance spectra were obtained from 250 to 450 nm in 1 nm steps. The Formlabs Clear and VeroClear resins were diluted to 20 % with isopropyl alcohol (IPA) prior to analysis. TangoBlackPlus was diluted to 10 % while VeroWhitePlus and PR48 were diluted to 2 % in IPA. Presumably, the differences in concentration and absorption characteristics of the photoabsorbers in each resin necessitated different dilution factors to keep the absorption spectra on a similar scale. The spectra were referenced to an IPA blank.
The resins were cured by exposure to UV light from a X-Cite 120Q mercury vapor arc lamp (Excelitas Technologies Corp., Mississauga, ON, CANADA). Light from the lamp was transmitted by a liquid light guide to a collimating microscope adapter that optimized the uniformity over a user-selected area. The collimating adapter and a bandpass filter were located 25 cm above the resin surface resulting in an illumination area approximately 20 mm in diameter. The lamp output power density (mW/cm2) was measured at the point of resin exposure using a S175C thermal sensor and PM100D power meter (Thorlabs, Inc., Newton, NJ, USA). The thermal sensor was zeroed without illumination prior to any intensity measurement. The average output power was collected over a period of several minutes before and after exposing the resin. Typical variation of an average power measurement over this time was ≈ 3 %. Ambient light power was estimated to contribute < 0.2 mW to the exposure. The intensity of the X-Cite 120Q source was adjustable by a built-in five stop iris with settings of 0%, 12 %, 25 %, 50 %, and 100 % transmission. Center wavelength, hard coated bandpass filters at (365 ± 5) nm or (405 ± 5) nm (Edmunds Optical, Inc., Barrington, NJ, USA) were used to select specific wavelengths of interest from the lamp output.
To create discrete structures for measuring resin cure parameters a series of masks with openings of various sizes and shapes were 3D printed using a Objet Connex500 polyjet printer (Stratasys, Eden Prairie, MN, USA). The masks were made from a printer-defined mixture of TangoBlackPlus and VeroWhitePlus resins that produced a rigid opaque part. For this study the printed mask consisted of a single 3 mm × 3 mm square opening in a 1 mm thick mask. The liquid photopolymer resin was contained in a well (52 mm (L) × 18 mm (W) × 2 mm (D)), made from the same material as the mask, within a larger structure that supported a glass slide at the same level as the surface of the resin. When in place the glass slide was in complete contact with the surface of the resin leaving no gaps or bubbles between the resin and slide. The mask was then placed on top of the glass slide and held in place by alignment pins printed in the space outside the well structure. Light from the arc lamp passed through a bandpass filter and cured the resin under the exposed areas. The aerial energy density of the exposure was varied by controlling the time the resin was exposed to the light. Exposure times ranged from 2 s to 210 s. After exposure to the UV light the mask was removed and the glass slide separated from contact with the resin. The slide was then placed in a centrifuge (Fisher Scientific, Accuspin 400) spinning at 105 radians/s for 5 minutes to force excess uncured resin to drain away from the cured structures. Some cured samples were then rinsed with IPA to further remove uncured resin. However, post-cure exposure to IPA can cause some cured materials to change dimensions (swell or shrink) and so exposure was minimized or avoided if possible. Samples were dried overnight before measuring the cured layer thickness. Prior to exposure experiments all uncured resins were kept in light tight containers and only the portions necessary for testing were removed and out in ambient conditions for < 30 mins. A schematic representation of the apparatus for this study is shown in Figure 1.
Figure 1.
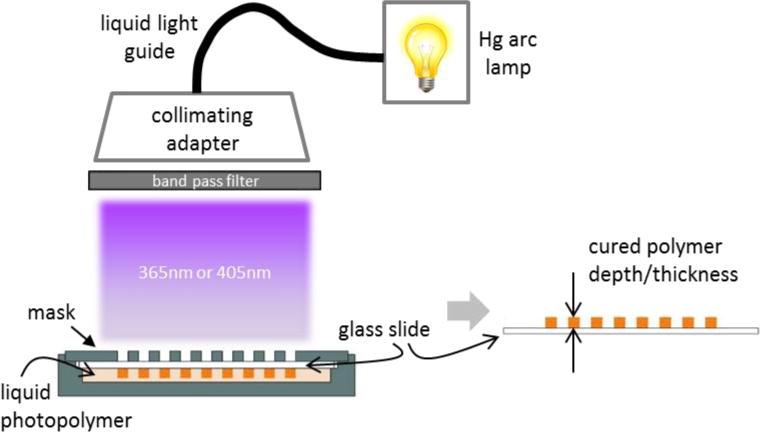
Set up for exposing resin to UV light
The thickness of the cured material, or step height relative to the slide surface, was determined by multiple methods: a hand-held digital caliper (EC799A-6/150, Starrett, Athol, MA, USA), stylus profilometry (Dektak XT, Bruker Nano Inc, Tucson, AZ, USA), and confocal laser scanning microscopy (LSM 800, Carl Zeiss Microscopy, Thornwood, NY, USA). The caliper and stylus profilometer measurements represent single spot or single line analyses while the confocal laser scanning microscopy provides a three dimensional surface map from which the average height over the entire cured resin surface can be obtained.
3. Results and Discussion
3.1 UV-VIS absorbance
The absorbance spectra for all five resins and an IPA blank (left axis), and the intensity output of the 120Q lamp (right axis) are shown in Figure 2. The dashed vertical lines represent the range of wavelengths passed by the 365 nm and 405 nm bandpass filters. All materials absorb strongly from 350 nm to 410 nm indicating they should be good candidates for photopolymerization at the available wavelengths. All resins except Standard Clear PR48 have absorbance peaks roughly centered with the wavelengths passed by the bandpass filters. The intensity from the 120Q light source is not constant with respect to wavelength over the ranges covered by the bandpass filters with peak intensities occurring at 369 nm and 407 nm.
Figure 2.
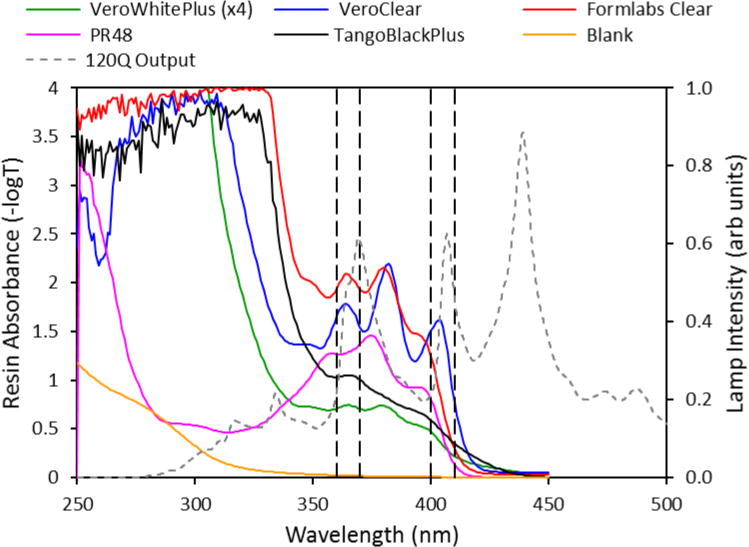
Absorbance spectra for all five resins and an IPA blank (left axis), and the intensity output of the 120Q lamp (right axis). The dashed vertical lines represent the wavelengths passed by the bandpass filters.
3.2 Measuring Cd
To evaluate different methods that could be used to measure Cd, test samples were created by exposing the resins VeroWhitePlus and TangoBlackPlus to 405 nm light at 2.3 mW/cm2 and 2.4 mW/cm2, respectively, for six exposure times from 5 s to 90 s. The thicknesses of all six cured structures were measured by calipers, stylus profilometry, and confocal laser scanning microscopy.
3.2.1 Caliper measurements
Calipers present the easiest, least costly, and least time consuming approach to measure Cd. The electronic slide calipers used for this study had a resolution of 0.01 mm., leading to a possible error of about ± 10 % when measuring the thinnest films created for this study. Repeated measurement of the cured structures took only a few minutes to complete. However, because the caliper measurement is a manual process relying on the user to pick the appropriate area on the structure to measure and apply the force needed to pinch the target structure between the jaws, the accuracy and precision - both from a single user and among multiple users – can vary. To investigate the magnitude of these possible errors five volunteers were asked to measure and report (n = 3) the thicknesses for each of the six structures of both VeroWhitePlus and TangoBlackPlus. The results are listed in Figure 3. For the hard material VeroWhitePlus (shore hardness D = 85) [11] the precision both within and among the volunteers is consistent and high (on average about ± 4 %). For the soft, elastomeric material TangoBlackPlus (shore hardness A = 35) [11] the flexible nature of the material makes the Cd measurement highly dependent on the amount of force used to pinch the structure in the jaws of the calipers. Because this force will likely vary among the different volunteers, the precision (about ± 14 %) is worse than observed for the harder VeroWhitePlus. The accuracy, as will be pointed out in the following sections, will also be affected.
Figure 3.
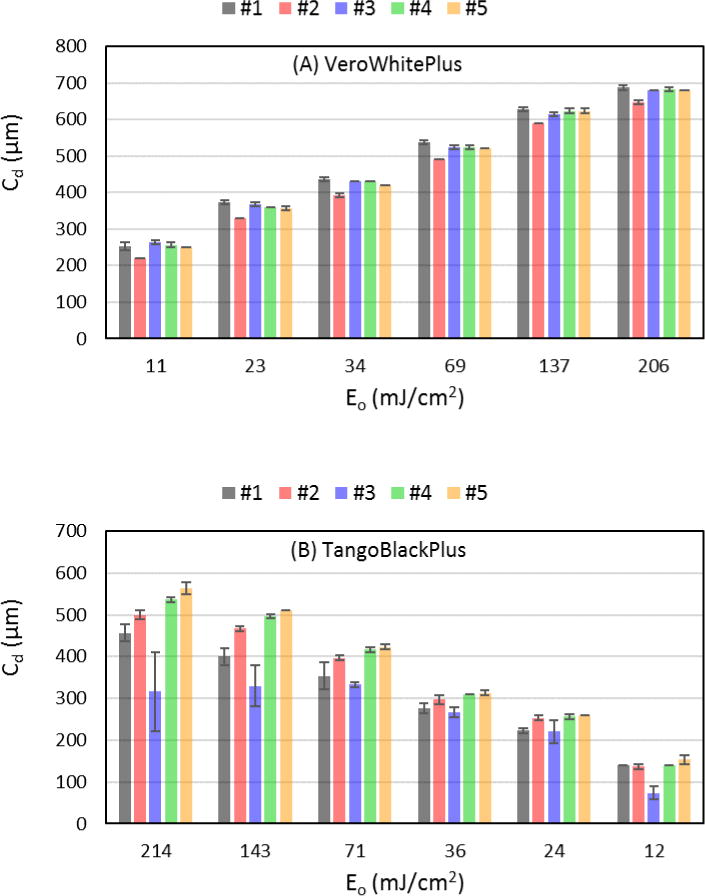
Cd measurements from VeroWhitePlus (A) and TangoBlackPlus (B) exposed to 405 nm light, taken by five volunteers using calipers. Error bars represent 1 σ standard deviation (n=3).
3.2.2 Stylus profilometry measurements
Variabilities like those observed during caliper measurements, due to differences in operator behavior, can be eliminated using an automated, instrumental approach. One approach would be to use stylus profilometry, where a small radius probe (2.5 µm) is placed in contact with the surface at low force (3 mg) and scanned in continuous motion over the surface to provide a 2D line scan or 3D map of the changes in surface topography with nm-scale resolution. An example of 2D line scans (6000 data points, 0.83 micrometers per point) collected across the center region of each VeroWhitePlus structure in the test sample are shown in Figure 4. The height measurements were calibrated against a NIST-traceable step height standard to ensure accuracy. The Cd values for VeroWhitePlus determined from the caliper and stylus profilometry methods are listed in Table 1. They are very similar, differing by ≤ 4 % (for the shortest structure). Repeated stylus profilometry scans (n = 5) of the exact same region of the VeroWhitePlus structure exposed to 34 mJ/cm2 showed a mean height of (434.6 ± 0.1) µm (0.02 % RSD). The precision is better than that observed for the caliper measurements. However, artifacts are observed when profiling the softer, more flexible TangoBlackPlus. As the stylus approaches the soft, tacky side of the structures it is difficult for the probe to slide cleanly up the edge onto the surface. Eventually, the tension between the probe and tacky surface is released and the probe rapidly springs up to an artificial high point before settling back down in contact with the surface. From that point the probe is able to trace the contours of the surface before descending the other side of the structure (Figure 5). This is most pronounced for the taller structures. The TangoBlackPlus Cd values determined from a region after the probe settles down are listed in Table 2. The line scans appear to show more surface roughness present on TangoBlackPlus structures than observed for VeroWhitePlus, especially for the structures with the highest energy exposures. Repeated scans (n = 5) of the structure exposed to 71 mJ/cm2 showed an average height of (451.0 ± 1.6) µm (0.4 % RSD), worse precision than observed for repeated measurement of the VeroWhitePlus structure. So it is possible that the roughness observed is a combination of inherent surface roughness and variability of the measurement.
Figure 4.
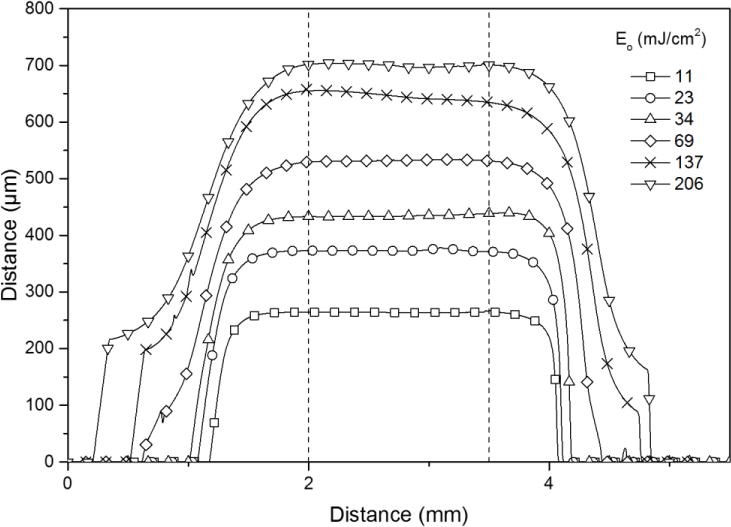
Stylus profilometry line scans across structures of VeroWhitePlus exposed to 405 nm light (2.3 mW/cm2). The dashed lines represent the region used to calculate average heights reported as Cd in Table 1.
Table 1.
Cd for VeroWhitePlus resin exposed to 405 nm light (2.3 mW/cm2).
| Exposure Energy, E0 (mJ/cm2) | Caliper* | Cd (µm) Stylus Profilometry | Confocal Microscopy |
|---|---|---|---|
| 11 | 249 | 264 | 263 |
| 23 | 357 | 373 | 362 |
| 34 | 422 | 435 | 435 |
| 69 | 519 | 532 | 534 |
| 137 | 615 | 646 | 649 |
| 206 | 675 | 700 | 703 |
mean of all measurements from five volunteers, n = 15
Figure 5.
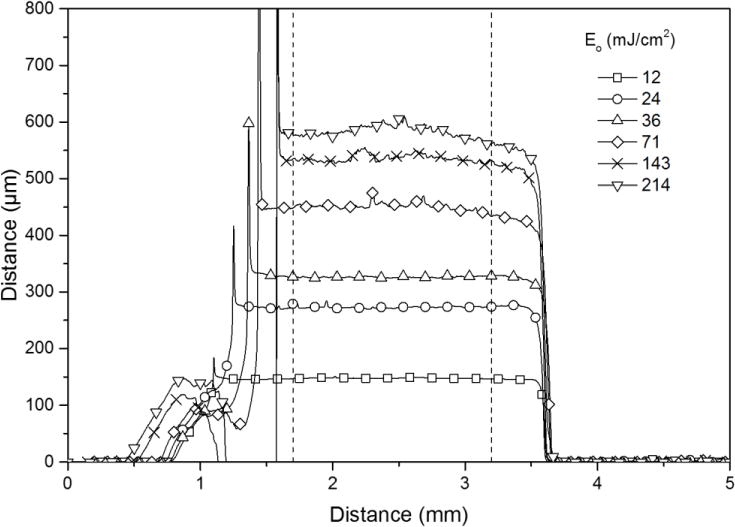
Stylus profilometry line scans across structures of TangoBlackPlus exposed to 405 nm light (2.4 mW/cm2). The dashed lines represent the region used to determine the heights reported in Table 2.
Table 2.
Cd for TangoBlackPlus resin exposed to 405 nm light (2.4 mW/cm2).
| Exposure Energy, E0 (mJ/cm2) | Caliper* | Cd (µm) Stylus Profilometry | Confocal Microscopy |
|---|---|---|---|
| 12 | 129 | 148 | 180 |
| 24 | 243 | 273 | 275 |
| 36 | 293 | 326 | 332 |
| 71 | 385 | 451 | 434 |
| 143 | 441 | 536 | 531 |
| 214 | 475 | 584 | 587 |
mean of all measurements from five volunteers, n = 15
Like the caliper, the profilometry line scans shown in Figures 4 and 5 represent a single measurement defined by the region of contact between either the caliper or stylus probe and the surface, as defined by the width of the jaws or diameter of the probe. As such the measurement uses only a narrow portion of the surface to determine the thickness or height of a large structure, potentially missing any variations present at other locations on the structure. 3D measurements are possible with stylus profilometers but can take 20 min to 60 min to collect, depending on resolution and scanned area requirements. But it is worth providing an example of this capability here. Figure 6 shows a 3D map and resulting contour plot of a structure of TangoBlackPlus exposed to 365 nm light for 180 s showing the variability in surface height over the surface of the 3 mm × 3 mm structure.
Figure 6.
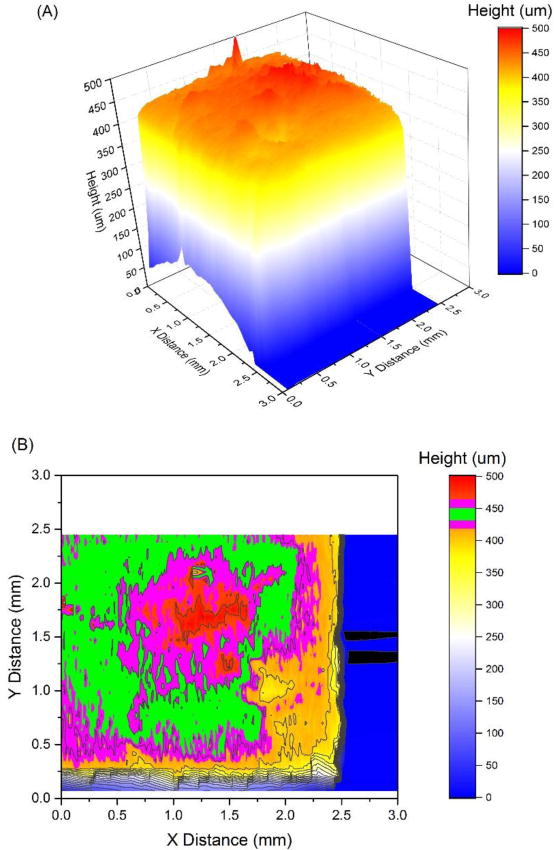
Stylus profilometry 3-D map (A) and contour plot (B) of TangoBlackPlus exposed to 365 nm light (1.9 mW/cm2, 339 mJ/cm2). The green and magenta bands in the contour plot (B) represent regions with ± 2 % and ± 5 % differences from the average height of 440.3 µm.
The map contains 35 scans, 3 mm long spaced by 70 µm. The average height inside a software-defined region of interest encompassing a large portion of the surface of the structure was (440.3 ± 17.9) µm (4 % RSD) with a max-min difference in height of about 130 µm. The contour plot in Figure 6 (B) highlights regions on the surface that would fall within ± 2 % (green) and ± 5 % (magenta) of the average. This visualization shows there are areas on the surface that would fall outside of the ± 5 % window and could potentially impact the accuracy of Cd if only a single caliper measurement or profilometry scan were collected from a non-representative region.
In addition to the previously mentioned issue of poor precision, another problem associated with caliper measurements of the soft, flexible TangoBlackPlus is apparent in the results listed in Table 2. The Cd values determined using calipers are lower than the values from stylus profilometry, as much as 20 % for the thickest structure. The difficulty in limiting and controlling the force used when engaging the caliper jaws results in extremely poor accuracy for the thicker soft material.
3.2.3 Confocal laser scanning microscopy measurements
Having presented some issues associated with contact-based methods of measuring thicknesses, it is worthwhile to investigate a non-contact approach like confocal laser scanning microscopy. The Zeiss LSM 800 equipped with a 405 nm laser using a 5×/0.16 NA objective lens and collecting an image stack at 4.8 µm intervals at 6.25 square micrometer per pixel was able to acquire 3D images of the test structures in minutes. An example is shown in Figure 7. Average step heights were calculated from similar 3D images from each test structure between regions of interest on the substrate and the surface of the structures. The results are listed in Tables 1 and 2. When using larger regions of interest to collect the step heights variations in surface topography can be averaged out and a more accurate value should be obtainable, unlike the situation for a single caliper or stylus profilometer scan. One artifact, visible in Figure 7 as dark regions surrounding the base of the structures, is the presence of dropouts or outliers for surfaces with sharp interfaces and slopes, where scattered light did not reach the detector. Awareness of this potential artifact allows the user to avoid those areas when selecting the regions of interest for measurements. Despite this issue, a non-contact 3D mapping approach, like confocal laser scanning microscopy, would be the desired method for determining structure heights or thicknesses, and thus Cd. However, equipment cost, complexity, and need for a skilled operator may make this approach less accessible for many individuals, companies, and laboratories.
Figure 7.
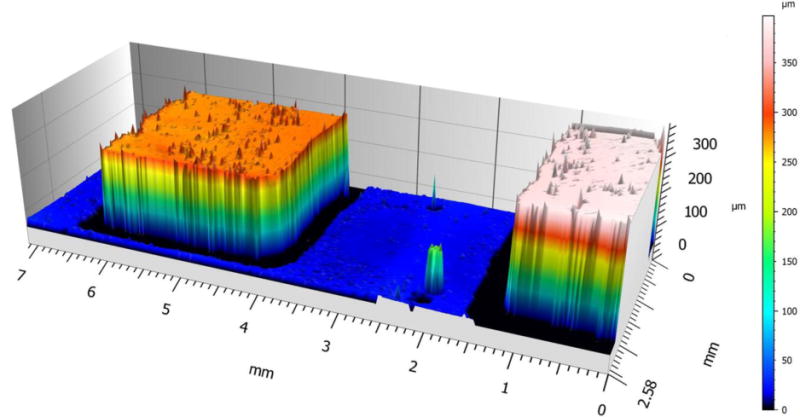
Confocal laser scanning microscope image of VeroWhitePlus exposed to 405 nm light (2.3 mW/cm2), 11 mJ/cm2 (left) and 23 mJ/cm2 (right).
3.2.4 Choosing the right method to determine Cd
Graphical representations of the data listed in Tables 1 and 2 can be used as a guide for choosing the appropriate method for measuring step heights or thicknesses. Figure 8 shows the working curves, Cd vs. E0, for VeroWhitePlus and TangoBlackPlus exposed to 405 nm light, where Cd was measured by the three methods described above. For the hard material, VeroWhitePlus, the working curves show excellent linearity. A comparison of the slopes of all three curves shows that the stylus and confocal methods are statistically the same (p = 0.52) but both are slightly different from the caliper method (p < 10−3). For the softer material, TangoBlackPlus, the trend is the same: good linearity for all three, and the stylus and confocal methods are the same (p = 0.27) but both differ from the caliper method (p < 5 × 10⁻⁴). Clearly measuring accurate Cd values from soft materials is best accomplished using a light force like stylus profilometry or, even better, a non-contact method like confocal microscopy. For harder materials the small differences in all three methods makes it difficult to recommend one method over the others. Given these considerations, and the relative ease of caliper and stylus measurements vs. confocal microscopy, the results presented in the next section were all based on Cd values determined by calipers for the hard materials (shore hardness ≈70 to 85) and stylus profilometry for the soft material (i.e., TangoBlackPlus). As evidenced by the results in Figure 8, the use of only caliper and stylus measurements should not greatly affect the results.
Figure 8.
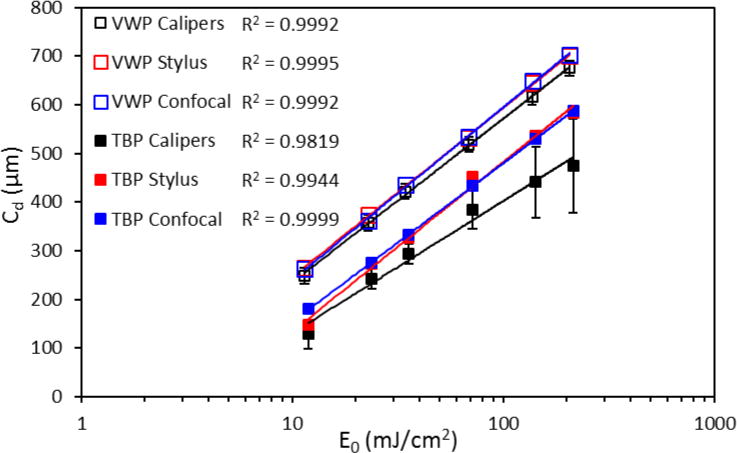
Working curves for VeroWhitePlus (VWP) and TangoBlackPlus (TBP) exposed to 405 nm light (2.3 and 2.4 mW/cm2, respectively).
3.3 Effect of light power density on Dp and Ec
Having established reliable methods for determining Cd from either hard or soft materials, a series of experiments were conducted to assess the effect of curing light power density on Dp and Ec. Jacob’s basic working curve model holds that Dp (the slope of the line) and Ec (the x-intercept), being purely parameters of the resin, should be independent of light power, spot size, or scan rate [1]. This assertion was tested by creating several working curves for the Formlabs Clear resin at different power densities of 405 nm light at exposure times of 2 s to 80 s. The curves shown in Figure 9 show good agreement over a 2.4× change in power density. The regression lines (R2 ≥ 0.998) provide Dp and Ec values (equation 2) for each power density that vary by about 10 % and 3 %, respectively. The magnitude of these variations is in line with the errors associated with measuring the power densities and thicknesses themselves. A similar small increase in Ec with increasing power density has been reported before [12]. This small deviation from the model that assumes Ec to be independent of changes in light power density is likely related to variations in the number of active radical species produced per photon of light absorbed, which will be determined by radical termination reactions in the resin. Although this is only one resin at one wavelength over a relatively small power density range the results suggest that, for this set up, small differences in power density should not impact the determination of Dp or Ec.
Figure 9.
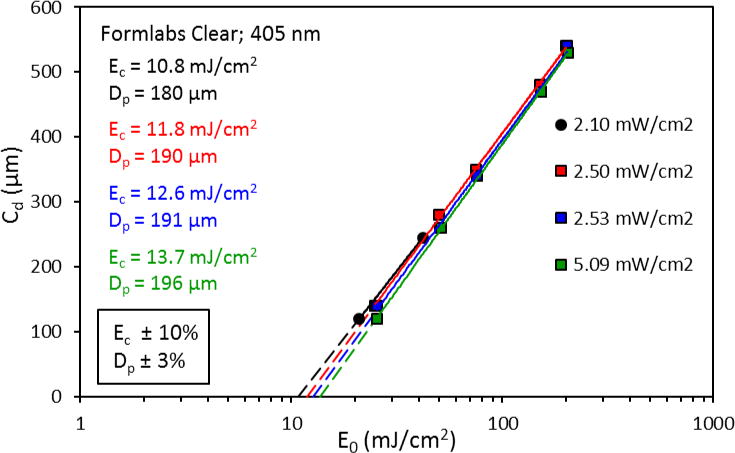
Dp and Ec values from working curves for Formlabs Clear as a function of light power density at 405 nm.
3.4 Effect of curing light wavelength on Dp and Ec
Working curves were obtained for all five resins at 356 nm and 405 nm. Working curves for some resins were collected multiple times over several months, but for this study all data points were combined to create one working curve per resin. The working curves are shown in Figure 10 and the Dp and Ec values are listed in Table 3. Not unexpectedly the values for Dp and Ec for the different resins vary over a large range. Cleary differences in the often proprietary composition of the resins play a key role in determining these values, i.e., photoinitiator type and concentration, monomer/oligomer type, pigments, etc. For VeroWhitePlus and VeroClear the curing light wavelength also greatly impacts the working curve. Both showed a variation in slope (Dp) of > 200 % as a function of wavelength, while the other resins varied only 20 % to 40 %. But even for resins with smaller variations in Dp their Ec values can show larger differences, e.g., Formlabs Clear had a 2x change in Ec for 365 nm vs. 405 nm. For all resins except Standard Clear PR48 both Dp and Ec increase going from 365 nm to 405 nm, but the magnitude of those increases is not the same for all of the resins.
Figure 10.
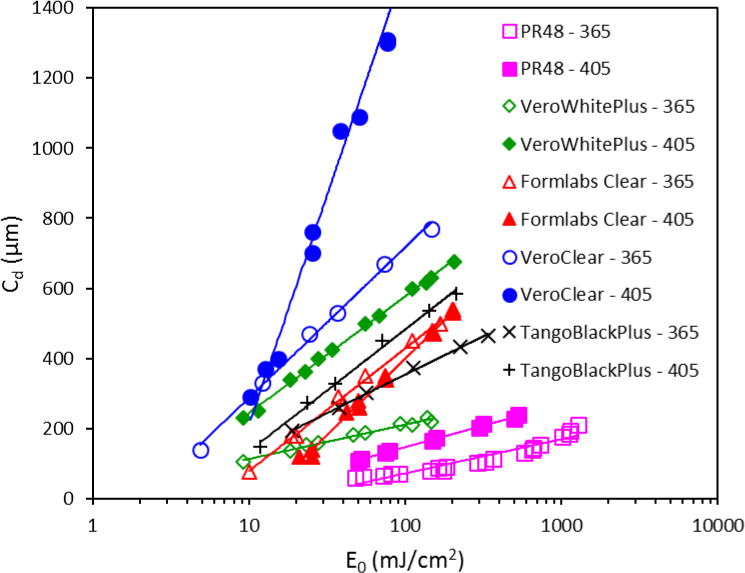
Working curves for five resins exposed to 365 nm and 405 nm light.
Table 3.
Dp and Ec values calculated from the working curves in Figure 10.
| Resin | Dp (µm) | Ec (mJ/cm2) | ||
|---|---|---|---|---|
| 365 nm | 405 nm | 365 nm | 405nm | |
| PR48 | 42 | 53 | 18.3 | 6.3 |
| VeroWhitePlus | 43 | 145 | 0.7 | 1.9 |
| Formlabs Clear | 146 | 192 | 5.2 | 12.6 |
| TangoBlackPlus | 95 | 151 | 2.4 | 4.1 |
| VeroClear | 186 | 568 | 2.1 | 6.9 |
The working curve for Standard Clear PR48 at 365 nm behaves differently from the other resins. Repeated measurements under a variety of different conditions of light power density and duration, and order of exposure times combined to show a working curve that does not follow the expected logarithmic behavior. This does not occur for exposure at 405 nm; the fit to a logarithmic least squares line is similar to the other resins. An expanded version of the curve for PR48 exposed to 365nm light is shown in Figure 11.
Figure 11.
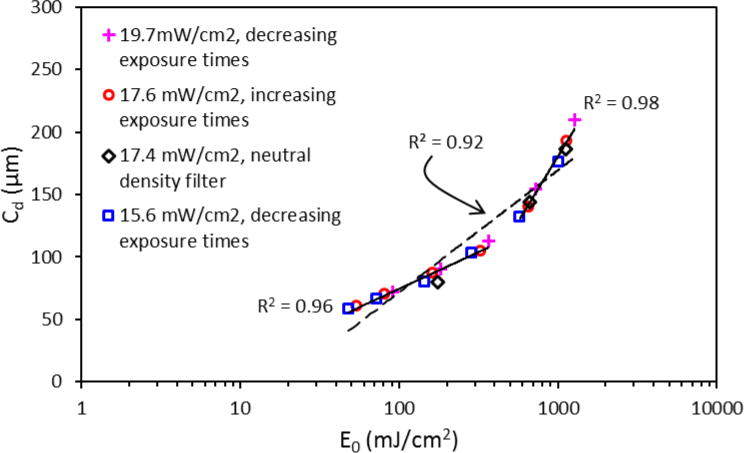
Working curve for Standard Clear PR48 at 365 nm. The dashed line is the logarithmic least squares fit of all the data points and the solid lines are logarithmic fits of two subsets of the data points.
The plot appears to be better fit by separating the data into two subsets, above and below Eo = 400 mJ/cm2. Clearly, the poor fit of the data to a single logarithmic regression line at 365 nm is problematic for determining accurate or meaningful Dp and Ec values like those listed in Table 3. Deviation from the expected behavior could be explained by changes in the absorptivity of the resin with increasing exposure, i.e., optical bleaching [13]. In this case, at high exposures cured material would have a reduced absorption coefficient compared to the uncured material allowing the light to penetrate deeper (Dp increases) changing the slope of the curve. A similar but opposite effect was observed and quantified during photocuring of thiolene-based optical adhesives [14]. Jacobs described another scenario that would lead to superlogarithmic behavior at increased exposures (E0): optical self-focusing where differences in the refractive indices of cured and uncured resin would redirect photons from the outer portions of a Gaussian-shaped focused laser beam to its centerline [15]. The increased photon dose would cure more resin, increasing Cd. This is not likely the case for explaining the results in Figure 11 because the light source was diffuse and collimated, not focused like a laser. Jacob recommended limiting exposures to conditions where Cd < 4Dp [15]. That recommendation would hold for the subset of data in Figure 11 that ranges from (40 to 400) mJ/cm2, resulting in Dp = 25.5 and Ec = 5.4. These new values for Standard Clear PR48 at 365 nm over that energy range would fall in line with the observed behavior of Ec and Dp for the other resins tested: both increase in going from 365 nm to 405 nm.
4. Conclusions
Continued development of additive manufacturing methods based on photocuring of photosensitive resins will benefit from the availability of more detailed information about the characteristics of the starting materials and its influence on the printing process. The methodology reported here allows for a systematic approach to obtaining two such critical parameters, Dp and Ec, from working curves based on accurate measurement of Cd for UV-cured resins. The results indicate caution should be exercised when using contact-based methods like calipers or micrometers to determine Cd, especially for soft elastomeric materials. The Dp and Ec values determined for five commercial resins showed a wide range of values that, when provided to designers and/or operators of 3D printers, may allow for improved printer performance through optimization of curing and stage movement parameters.
With regard to the possible errors associated with measuring Cd this work does not address the actual impact of such errors on the printed part properties. Errors in Cd will propagate to Ec and Dp. What’s not known is how large these errors have to get before the printer or part performance is compromised. This would require a printing system, either SL or DLP, that allows users to vary the printing parameters like laser wavelength, power, beam size, and scan speed, and z-axis step height increments. Systematic, controlled variations of these parameters would create a database of information that could be used to create predictive process models that would greatly reduce the trial and error approach frequently encountered in the 3D printing community.
Acknowledgments
The author would like to thank S. Muramoto and R. Ricker at the National Institute for Standards and Technology (NIST) for making stylus profilometry and confocal laser scanning microscopy measurements. Research performed in part at the NIST Center for Nanoscale Science and Technology.
Footnotes
Certain commercial equipment, instruments, or materials are identified in this paper in order to specify the experimental procedure adequately. Such identification is not intended to imply recommendation or endorsement by the National Institute of Standards and Technology, nor is it intended to imply that the materials or equipment identified are necessarily the best available for the purpose.
References
- 1.Jacobs PF. Fundamentals of stereo lithography. Proceedings of Solid Free Form Symposium. 1992:196–211. [Google Scholar]
- 2.Arnaud Bertsch SJ, Bernhard Paul, Renaud Philippe. Microstereolithography: a Review. Materials Research Society Symposium Proceedings. 2003;758 [Google Scholar]
- 3.Lee JH, Prud’homme RK, Aksay IA. Cure depth in photopolymerization: Experiments and theory. Journal of Materials Research. 2001;16(12):3536–3544. [Google Scholar]
- 4.Ullett JS, Schultz JW, Chartoff RP. Novel liquid crystal resins for stereolithography – processing parameters and mechanical analysis. Rapid Prototyping Journal. 2000;6(1):8–17. [Google Scholar]
- 5.Tille C, Bens A, Seitz H. Processing characteristics and mechanical properties of a novel stereolithographic resin system for engineering and biomedicine; Virtual Modelling and Rapid Manufacturing: Advanced Research in Virtual and Rapid Prototyping Proc 2nd Int Conf on Advanced Research in Virtual and Rapid Prototyping; 28 Sep–1 Oct 2005; Leiria, Portugal: CRC Press; 2005. pp. 311–316. [Google Scholar]
- 6.Arcaute K, Mann BK, Wicker RB. Stereolithography of three-dimensional bioactive poly(ethylene glycol) constructs with encapsulated cells. Annals of Biomedical Engineering. 2006;34(9):1429–1441. doi: 10.1007/s10439-006-9156-y. [DOI] [PubMed] [Google Scholar]
- 7.Nguyen H, Richter J, Jacobs PF. Chapter 10: Diagnostic Testing, in: Rapid Prototyping & Manufacturing: Fundamentals of Stereolithography. Society of Manufacturing Engineers. 1992:249–285. [Google Scholar]
- 8.Chan V, Zorlutuna P, Jeong JH, Kong H, Bashir R. Three-dimensional photopatterning of hydrogels using stereolithography for long-term cell encapsulation. Lab on a Chip. 2010;10(16):2062–2070. doi: 10.1039/c004285d. [DOI] [PubMed] [Google Scholar]
- 9.Elliott AM. The effects of quantum dot nanoparticles on the polyjet direct 3D printing process. PhD Thesis, Virginia Tech. 2014 [Google Scholar]
- 10.Zabti MM. Effects of light absorber on micro stereolithography parts. PhD Thesis, The University of Birmingham. 2012 [Google Scholar]
- 11.VeroWhitePlus and TangoBlackPlus Materials Specifications, Stratasys. 2015 [Google Scholar]
- 12.Hunziker M, Leyden R. Chapter 2: Basic Polymer Chemistry, in: Rapid Prototyping & Manufacturing: Fundamentals of Stereolithography. Society of Manufacturing Engineers. 1992:25–58. [Google Scholar]
- 13.Bernhard MHP, Hunziker M, Klingert B, Schulthess A, Steinmann B. Chapter 10: Three-dimensional laser polymerisation. In: Fouassier JP, Rabek JF, editors. Radiation Curing in Polymer Science and Technology: Practical aspects and applications. Springer; Netherlands: 1993. pp. 196–236. [Google Scholar]
- 14.Cabral JT, Hudson SD, Harrison C, Douglas JF. Frontal Photopolymerization for Microfluidic Applications. Langmuir. 2004;20(23):10020–10029. doi: 10.1021/la049501e. [DOI] [PubMed] [Google Scholar]
- 15.Jacobs PF. Rapid Prototyping & Manufacturing: Fundamentals of Stereolithography. Society of Manufacturing Engineers; 1992. Chapter 4: Fundamental Processes; pp. 79–110. [Google Scholar]


