

Abstract
Alzheimer’s disease (AD) features a dynamic sequence of amyloid deposition, neurodegeneration, and cognitive impairment. A significant fraction of AD brains also displays Lewy body pathology, suggesting that addition of classically Parkinson’s disease-related proteins to the AD biomarker panel may be of value. To determine whether addition of cerebrospinal fluid (CSF) total α-synuclein and its form phosphorylated at S129 (pS129) to the AD biomarker panel [Amyloid-β1-42 (Aβ42), tau, and phosphorylated tau (p-tau181)] improves its performance, we examined CSF samples collected longitudinally up to 7 years as part of the Alzheimer’s Disease Neuroimaging Initiative. From 87 AD, 177 mild cognitive impairment (MCI), and 104 age-matched healthy controls, 792 baseline and longitudinal CSF samples were tested for total α-synuclein, pS129, Aβ42, tau, and p-tau181. pS129, but not total α-synuclein, was weakly associated with diagnosis at baseline when t-tau/Aβ42 was included in the statistical model (β=0.0026, p=0.041, 95% CI [(0.0001)–(0.005)]). CSF α-synuclein predicted Alzheimer’s Disease Assessment Scale-Cognitive (β=−0.59, p=0.0015, 95% CI [(−0.96)–(−0.23)]), memory (β=0.4, p=0.00025, 95% CI [(0.16)–(0.59)]) and executive (0.62, <0.0001, 95% CI [(0.31)–(0.93)]) function composite scores, and progression from MCI to AD (β=0.019, p=0.0011, 95% CI [(0.002)–(0.20)]). pS129 was associated with executive function (β=−2.55, p=0.0085, 95% CI [(−4.45)–(−0.66)]). Lower values in the mismatch between α-synuclein and p-tau181 predicted faster cognitive decline (β=0.64, p=0.0012, 95% CI [(0.48)–(0.84)]). Longitudinal biomarker changes did not differ between groups, and may not reflect AD progression. The α-synuclein-p-tau181-Mismatch could better predict longitudinal cognitive changes than classical AD markers alone, and its pathological correlates should be investigated further.
Keywords: Alzheimer’s disease, Mild cognitive impairment, Cerebrospinal fluid, Biomarkers, α-synuclein, pS129-α-synuclein
INTRODUCTION
Alzheimer’s disease (AD), the most common cause of dementia, is a progressive degenerative disorder that affects over 35.5 million individuals worldwide, and this number is expected to double in the next 20 years[1, 2]. The socioeconomic burden on patients, families and healthcare systems highlights the urgent need to understand the disease process, and to develop disease-modifying treatments. The molecular pathology probably starts 10–20 years before patients develop dementia symptoms sufficient to prompt clinical diagnosis[3]. However, diagnosis of both AD and mild cognitive impairment (MCI), a condition with elevated risk for progressing to AD and thought to be a prodromal stage, remains based on clinical examination, neuroimaging, and, to a limited extent, cerebrospinal fluid (CSF) markers[4, 5]. It is likely, therefore, that accurately predicting AD or MCI will require diagnosing patients in earlier stages, when interventions are more likely to preserve neuron function; identification of markers capable of predicting imminent progression of MCI to AD is a question of significant interest.
The most frequently used CSF panel of biomarkers in AD includes amyloid beta 1–42 (Aβ42), a predominant component of amyloid plaques; total tau (t-tau) and hyperphosphorylated tau (p-tau), which are associated with neuronal damage and intracellular neurofibrillary tangles[6]. Low CSF Aβ42 in individuals with MCI likely indicates the presence of AD amyloid pathology, and predicts rapid progression to AD[7, 8]. Other studies have shown that t-tau and p-tau can also predict MCI[9–11]. Although Aβ and tau proteins are postulated to play a central role in AD pathogenesis, the pathophysiology is complex, leading to variability in clinical presentation in both AD and MCI[12, 13]. Understanding these factors is critical for successful early detection and intervention.
Contributing to the variability of AD is the occurrence of comorbid Lewy body (LB) pathology, the hallmark of another family of neurodegenerative diseases, including Parkinson’s disease (PD) and Dementia with Lewy bodies (DLB), in up to 50% of AD patients[9, 14]. α-Synuclein (α-syn), the major component of LBs, has also been found to play an important role in AD[15–17]. As a biomarker, CSF α-syn has been reported as unchanged or slightly increased in AD[18, 19]. Our previous study showed a strong association between CSF α-syn, t-tau and tau phosphorylated at threonine 181 (p-tau181), and confirmed the utility of α-syn in improving diagnostic sensitivity and specificity provided by Aβ42, t-tau and p-tau181[17]. Intriguingly, our previous study identified a subpopulation of AD patients in which the level of α-syn was lower than expected, given the normally high correlation of α-syn with tau. We hypothesized that this may reflect the subpopulation of AD subjects with concomitant LB pathology, and found that the mismatch (α-syn–p-tau181-Mis) between these two markers both correlated with worse cognitive outcomes, and improved the association of the t-tau/Aβ42 ratio with these measures when included in the model [17]. Importantly, most α-syn present in LBs is highly phosphorylated, especially at serine 129 (pS129) [15, 20–22], which is thought to alter aggregation and toxicity of α-syn[23, 24]. Notably, the CSF pS129 was significantly higher in PD patients than in healthy controls, and correlated with PD severity[16, 25], suggesting it may serve as a marker of PD pathology independently of total α-syn, which tends to be lower in the CSF of PD patients[18, 26–29]. However, the roles of these biomarkers in AD have not yet been completely probed, particularly considering pS129 in large, longitudinal cohorts.
The present study was designed to measure the levels of CSF total α-syn and pS129, and to examine their association with CSF t-tau, p-tau181 and Aβ42, in a large longitudinal cohort of AD, MCI, and cognitively normal (CN) subjects recruited as part of the Alzheimer’s Disease Neuroimaging Initiative (ADNI) study. This large cohort includes the longest follow-up reported to date, including additional sample collection and clinical assessment continuing up to 7 years. The aim of this study was to investigate whether analysis using a multiple biomarker panel including total α-syn and pS129, along with the standard AD-related CSF biomarkers, could provide a feasible tool for monitoring progression in people with AD and MCI.
MATERIALS and METHODS
Subjects and samples
CSF samples of subjects with clinical AD or MCI, and age-matched, healthy CN controls were obtained from the original ADNI. For the current study, a total of 792 CSF samples were longitudinally collected from 368 subjects, including 87 patients with AD, 177 patients with MCI, and 104 age-matched CN. Clinical data and values for t-tau, p-tau181, Aβ42, and APOE status used in the preparation of this article were obtained from the ADNI database (http://adni.loni.usc.edu). The ADNI was launched in 2003 as a public-private partnership, led by Principal Investigator Michael W. Weiner, MD. The primary goal of ADNI has been to test whether serial magnetic resonance imaging (MRI), positron emission tomography (PET), other biological markers, and clinical and neuropsychological assessment can be combined to measure the progression of MCI and early AD. Briefly, all subjects underwent evaluations consisting of medical history, physical, psychiatric and neurological examinations, and APOE genotyping. Cognitive performance was evaluated with Mini-Mental State Examination (MMSE), Alzheimer’s Disease Assessment Scale-Cognitive (ADAS-Cog13), and memory[30] and executive[30] composite scores at screening and yearly follow-up visits (MCI subjects had additional evaluations at 6 and 18 months). Spatial Pattern of Abnormality for Recognition of Early Alzheimer’s disease (SPARE-AD) was used as a composite MRI measure that reflects AD-like brain atrophy. The inclusion and exclusion criteria for healthy controls and patients with AD and MCI have been described previously, and can be found on the ADNI website (http://adni.loni.ucla.edu/wp-content/uploads/2010/09/ADNI GeneralProceduresManual.pdf).
Baseline lumbar puncture was performed within 28 days of the screening visit for all subjects. Follow up samples were collected at 12 (266 cases), 18 (1 case), 24 (81 cases), 30 (1 case), 48 (56 cases), 72 (18 cases) and 84 (1 case) months after screening. Because only a single subject had follow up at 84 months, studies were performed with and without inclusion of this subject; no changes to the outcomes were observed.
Luminex assays
Total α-syn and pS129 levels were detected by Luminex assays as previously described[25, 26]. The sensitivity (lower limit of quantification) was 0.01 ng/ml for the total α-syn assay, and 0.03 ng/ml for pS129. The inter-assay precision (run-to-run or plate-to-plate, determined with an internal standard—an aliquot of a pooled reference CSF—in each plate) was <20% for both assays, and the intra-assay precision was <10%.
Aβ42, t-tau, and p-tau181 were measured using the multiplex xMAP Luminex platform (Luminex Corp, Austin, TX) with Innogenetics (INNO-BIA AlzBio3; Ghent, Belgium) immunoassay kit–based reagents, as previously described[31, 32]. The data was obtained from the ADNI database (http://adni.loni.usc.edu).
CSF hemoglobin (Hgb) assays
Hgb levels were measured as previously described[26] with a human Hgb ELISA quantitation kit from Bethyl Lab Inc (Montgomery, TX, USA), according to the manufacturer’s instructions. Only samples with CSF Hgb < 200 ng/mL were used for total α-syn analysis, as previously evaluated and selected based on the association of high CSF Hgb and α-syn values[17].
Statistical analysis
Statistical analyses were performed with Prism 4.0 (GraphPad) and R v. 3.3.3[33]. Biomarker values with a right-skewed distribution underwent logarithmic (t-tau, p-tau181 and t-tau/Aβ42 ratio) and square-root (α-syn) transformations. Correlations between biomarkers are reported as Pearson correlation coefficients. For univariate analyses presented in Table 1 the following tests were applied: 1) one way ANOVAs for quantitative normally distributed variables, 2) Kruskall-Wallis and rank-based two way methods for non-normally distributed quantitative variables and 3) Chi-square tests for qualitative variables.
Table 1.
Demographic and clinical characteristics of the ADNI subjects at baseline
| Variables | CN (n=104) |
MCI (n=177) |
AD (n=87) |
p-value |
|---|---|---|---|---|
| Age | 75.7 (72–78.5) |
74.7 (69.4–79.4) |
75.8 (70.1–80.1) |
0.53 |
| Gender N (% male) | 52 (50%) | 117 (66%) | 49 (56%) | 0.024 |
| APOE ε4 N (% present) | 25 (24%) | 93 (53%) | 60 (69%) | <0.0001 |
| MMSE | 29 (29–30) |
27 (25–28) |
24 (22–25) |
<0.0001 |
| ADAS-Cog13 | 9.67 (6.58–12.67) |
18.67 (14.58–23.33) |
28.84 (23.08–34) |
<0.0001 |
| Aβ1-42 | 222 (162–254.5) |
146 (126.5–207.5) |
137 (118.5–159) |
<0.0001 |
| T-Tau | 61 (49–86) |
86 (65–120) |
111 (81–154) |
<0.0001 |
| P-Tau181 | 21 (16–29.5) |
31 (20–45) |
36 (29–49) |
<0.0001 |
| α-Syn(ng/ml) | 0.52 (0.44–0.68) |
0.6 (0.48–0.74) |
0.57 (0.48–0.73) |
0.16 |
| α-Syn excluding subjects with high Hgb | 0.48 (0.41–0.59) |
0.54 (0.45–0.65) |
0.54 (0.43–0.67) |
0.031 |
| pS129-α-syn(ng/ml) | 0.075 (0.062–0.083) |
0.069 (0.061–0.081) |
0.072 (0.065–0.083) |
0.080 |
| Hemoglobin | 91.33 (44.08–704.25) |
86.86 (41.91–836.65) |
90.83 (42.17–648.86) |
0.91 |
| “α-Syn-p-tau181-Mis excluding subjectswith high Hgb | 0.072 [(−0.44)–(0.68)] |
0.041 [(−0.62)–(0.60)] |
−0.29 [(−0.80)–(0.41)] |
0.053 |
| SPARE-AD | −1.46 [(−2.05)–(−0.99)] |
0.78 [(0.15)–(1.45)] |
1.34 [(0.79)–(1.72)] |
<0.0001 |
Cross-sectional association of CSF biomarkers with diagnosis was determined using a multivariable regression model adjusted for age, diagnosis, gender and APOE ε4 presence, both with and without t-tau/Aβ42 ratio included as a covariable. Distribution of residuals and absence of multicolinearity was tested in these models. Receiver operating characteristic (ROC) curves were generated to compare diagnostic groups based on a logistic regression model, which included age, gender and each of the three α-syn CSF biomarker measures. For prediction of longitudinal clinical changes (ADAS-Cog13, memory[30] and executive[34] function composite scores) of MCI subjects based on baseline CSF biomarker values, a mixed-effects model including age, gender, education and APOE ε4 presence was used with random intercept and slope. An interaction between α-syn and pS129 with time was included in these models, as the analysis main outcome. A significant association would indicate that rates of progression are associated with baseline biomarker values. We also analyzed models that added the t-tau/Aβ42 ratio * time interaction to the previously mentioned covariates to evaluate if these effects were independent and persisted once the tau/Aβ42 ratio was included in the model.
The mismatch between the expected α-syn levels for a given p-tau181 level (α-syn-p-tau181-Mis) was calculated as the standardized residual of the linear regression model that predicted α-syn based on p-tau181, therefore estimating if α-syn is lower or higher than expected based on the p-tau181 level.
To evaluate the association of baseline diagnosis with longitudinal changes in α-syn, pS129, and α-syn-p-tau181-Mis[17] during the follow up a mixed-effects model including age, gender, and APOE ε4 presence was used with random intercept and slope. An interaction between baseline diagnosis with time was included in these models, as the analysis main outcome. A significant association would indicate that longitudinal changes in α-syn and pS129 are associated with baseline diagnosis. A Cox hazards model, with age, gender, APOE ε4 presence, education and tau/Aβ42 ratio, as covariates, was used to study the conversion of MCI to AD for the different CSF biomarkers studied here. Concentration of α-syn was included in the model as a continuous variable. The studied CSF biomarkers were α-syn, pS129, and α-syn-p-tau181-Mis. Statistical tests were two-sided and significance was set at p<0.05.
RESULTS
Demographic and clinical characteristics of the ADNI subjects
A total of 368 ADNI subjects were included in the current study. Clinical and demographic characteristics of the subjects are summarized in Table 1. Gender, MMSE, ADAS-Cog13, t-tau, p-tau181, Aβ42 and APOE ε4 differed between the diagnostic groups at baseline. Similar to previous studies of the ADNI cohort[17], 40.5% (n=149) of the baseline samples had Hgb levels exceeding 200 ng/ml. As previous studies have demonstrated, CSF α-syn correlates with Hgb, suggesting a strong influence of blood contamination on the CSF level[26], and subjects with Hgb levels exceeding 200 ng/ml were thus excluded from analyses including α-syn values. During the course of follow up, 53.1% subjects who were classified as MCI at baseline converted to AD diagnosis (median follow-up 3 years, IQR 2.1-6.0 years).
Correlation among CSF biomarkers
CSF α-syn showed a moderate positive correlation with t-tau (r=0.63, p<0.0001), p-tau181 (r=0.54, p<0.0001), and a weak inverse correlation with Aβ42 (r=−0.15, p=0.026). CSF pS129 was moderately inversely correlated with p-tau181 (r=−0.29, p<0.0001) and α-syn (r=−0.38, p<0.0001) and weakly inversely correlated with t-tau (r=−0.16, p=0.0031) (Fig. 1).
Fig. 1.
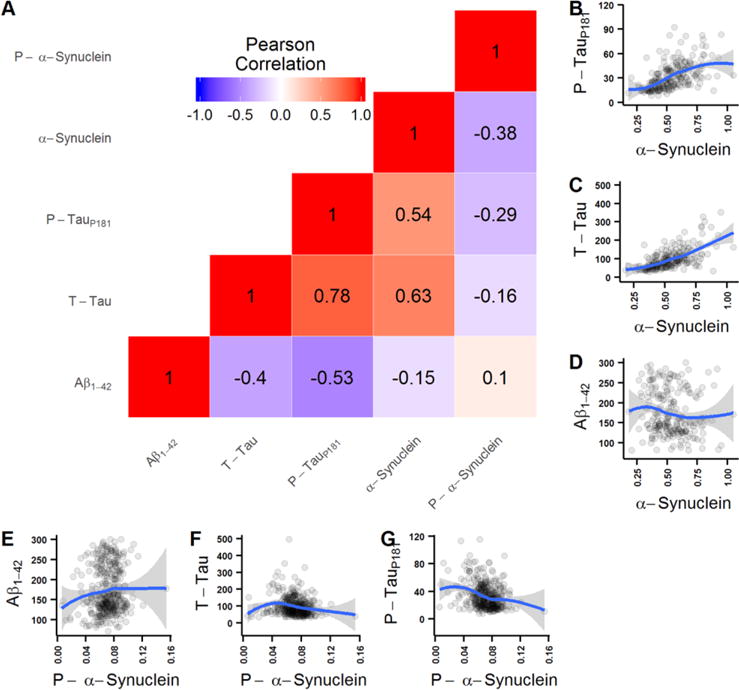
Correlation among CSF biomarkers. (A) correlation matrix with Pearson correlation coefficient values between all CSF biomarker pairs (red shading indicates positive correlation and blue shading negative correlation). (B-G) Scatterplots depicting values of the different biomarker pairs. Blue lines represent LOESS lines (LOcal regrESSion).
Association of CSF biomarkers with baseline diagnosis and longitudinal clinical changes
Cross-sectional values of total α-syn, pS129, and α-syn-p-tau181-Mis by diagnostic group are presented in Fig. 2. A multivariable regression model was used to examine the cross-sectional association of CSF analytes with baseline clinical diagnostic group. Total α-syn was not associated with diagnosis at baseline, unless APOE4 status was excluded from the model (Supplemental Table 1). pS129 was weakly associated with AD clinical diagnosis at baseline when t-tau/Aβ42 was included in the statistical model (Table 2). No other results differed when APOE4 status was excluded from the model. In the subset of subjects with Hgb <200 ng/ml (the same subjects examined for α-syn), pS129 was weakly associated with MCI when tau/Aβ42 was excluded from the model (Supplemental Table 2). Cross-sectional values overlapped substantially, and performed poorly in differentiating diagnostic groups (Fig. 3).
Fig. 2.
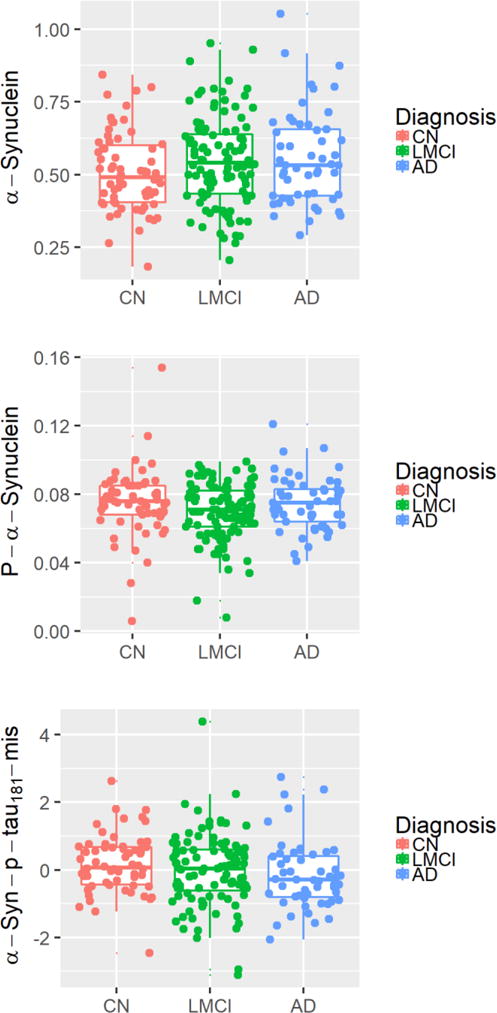
Cross-sectional values of biomarkers by diagnosis group. Baseline biomarker values are reported for (A) total α-syn, (B) pS129, and (C) α-syn-p-tau181-Mis for control, MCI, and AD subjects.
Table 2.
Cross-sectional association of CSF biomarkers with clinical diagnosis
| Adjusted for T-tau/Aβ42 | MCI | AD | |||
|---|---|---|---|---|---|
|
| |||||
| Coefficients | p-values | Coefficients | p-values | ||
| α-Syn | No | 0.043 [(−0.02)–(0.10)] |
0.17 | 0.048 [(−0.021)–(0.12)] |
0.18 |
| Yes | −0.039 [(−0.09)–(0.013)] |
0.14 | −0.056 [(−0.12)–(0.005)] |
0.32 | |
| pS129- α-syn | No | −0.0012 [(−0.003)–(0.0008)] |
0.23 | 0.00077 [(−0.002)–(0.003)] |
0.51 |
| Yes | 0.00001 [(−0.002)–(0.002)] |
0.99 | 0.0026 [(0.0001)–(0.005)] |
0.041 | |
| “α-Syn-p-tau181-Mis | No | −0.18 [(−0.51)–(0.14)] |
0.27 | −0.31 [(−0.69)–(0.067)] |
0.11 |
| Yes | −0.19 [(−0.53)–(0.15)] |
0.28 | −0.32 [(−0.73)–(0.085)] |
0.12 | |
Linear regression model is adjusted for age at baseline, gender, and APOE ε4 presence. Models with and without T-tau/Aβ1-42 ratio are listed as indicated in the second column.
Fig. 3.
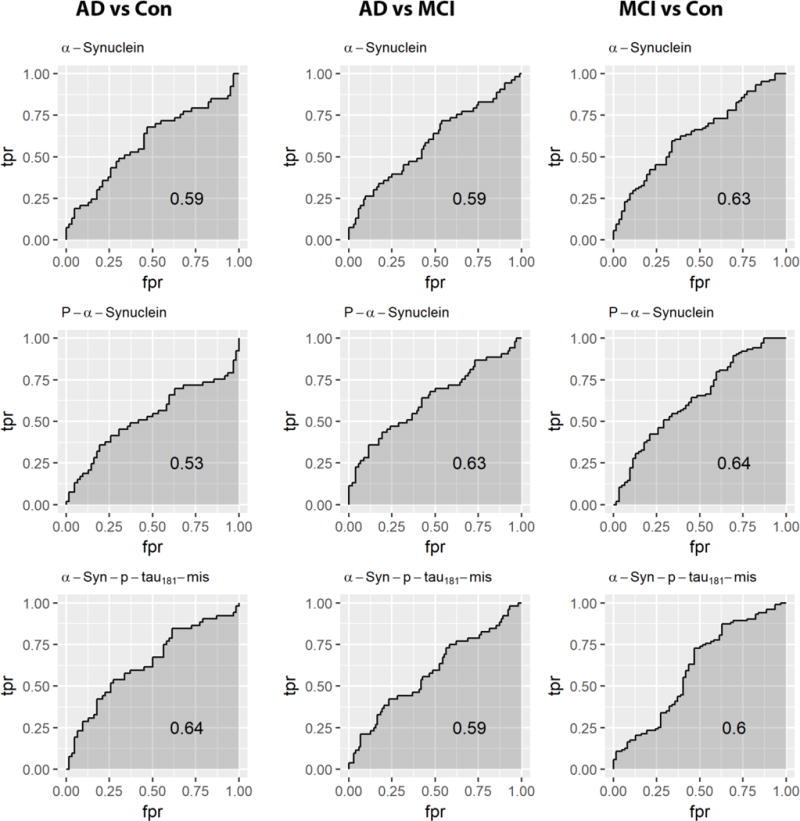
ROC curves for separation of subjects by diagnosis for each biomarker. Cross-sectional (A) total α-syn, (B) pS129, and (C) α-syn–p-tau181-Mis performed poorly in distinguishing diagnoses.
In the longitudinal analysis using a mixed-effects model, including MCI subjects with up to 7 yearly follow-up visits, CSF α-syn at baseline did not predict any clinical outcome when the t-tau/Aβ42 ratio was excluded from the model. A similar model including all subjects (with all diagnoses), and with diagnosis as a covariate, showed similar results (data not shown). However, when t-tau/Aβ42 ratio was included in the model, CSF α-syn predicted ADAS-Cog13, memory and executive function composite scores and MCI to AD progression. pS129 was associated with executive function composite score when including t-tau/Aβ42 ratio in the model, for both the whole cohort (Table 3), and the subset of subjects with Hgb<200 ng/ml (Supplemental Table 3). No conclusions were altered by excluding APOE4 status from the model (Supplemental Table 4).
Table 3.
Association of baseline CSF biomarker values with longitudinal clinical changes in MCI subjects. Reported as multivariate regression coefficient [95% confidence interval of coefficient] (p-value).
| Adjusted for T-tau/Aβ1-42*time | ADAS-Cog13 | Memory composite | Executive function composite | MCI progression to AD | |
|---|---|---|---|---|---|
| T-tau/Aβ1-42 | – | 0.32 [(0.26)–(0.38)] (0.0002) |
−0.20 [(−0.25)–(−0.15)] (<0.0001) |
−0.30 [(−0.37)–(−0.23)] (<0.0001) |
3.51 [(1.68)–(7.33)] (0.0008) |
| α-Syn | No | −0.12 [(−0.46)–(0.22)] (0.48) |
0.085 [(−0.12)–(0.29)] (0.42) |
0.17 [(−0.13)–(0.47)] (0.26) |
0.53 [(0.79)–(3.47)] (0.50) |
| Yes | −0.59 [(−0.96)–(−0.23)] 0.0015) |
0.4 [(0.16)–(0.59)] (0.00025) |
0.62 [(0.31)–(0.93)] (<0.0001) |
0.019 [(0.002)–(0.20)] (0.0011) |
|
| pS129- α-syn | No | 0.42 [(−2.08)–(2.93)] (0.74) |
−0.19 [(−1.82)–(1.45)] (0.82) |
−1.66 [(−3.69)–(0.36)] (0.11) |
0.074 [(0.00)–(27423)] (0.69) |
| Yes | 1.45 [(−0.89)–(3.80)] (0.22) |
−0.93 [(−2.44)–(0.58)] (0.23) |
−2.55 [(−4.45)–(−0.66)] (0.0085) |
55.76 [(0.00)–(445985)] (0.56) |
|
| “α-Syn-p-tau181-Mis | No | −0.070 [(−0.094)–(−0.046)] (0.0018) |
0.050 [(0.036)–(0.064)] (0.0002) |
0.070 [(0.050)–(0.090)] (0.00021) |
0.64 [(0.48)–(0.84)] (0.0049) |
| Yes | −0.065 [(−0.11)–(−0.02)] (0.0038) |
0.042 [(0.02)–(0.07)] (0.0012) |
0.066 [(−0.028)–(0.10)] (0.00061) |
0.64 [(0.49)–(0.84)] (0.0012) |
Model is adjusted for age at baseline, gender, education, and APOE 4 presence. Models with and without T-tau/Aβ1-42 ratio are listed as indicated in the second column.
While α-syn correlated significantly with p-tau181, some patients have high p-tau181 with quite low α-syn. In a previous study[17], we hypothesized that these subjects might represent a subset of AD subjects with concomitant LB pathology. We calculated the α-syn-p-tau181-Mis value, in which a value of 0 reflects α-syn values identical to those expected for that subject’s p-tau181 level, while positive values reflect higher than expected α-syn and negative values reflect lower than expected α-syn. We tested the association between α-syn-p-tau181-Mis and cognitive decline in AD and MCI subjects, and found that lower α-syn–p-tau181-Mis values with or without t-tau/Aβ42 as a covariate were associated with a faster decline in ADAS-Cog, memory and executive function composite (Fig. 4 A-C), and predicted faster progression from MCI to AD dementia (Fig. 4D).
Fig. 4.
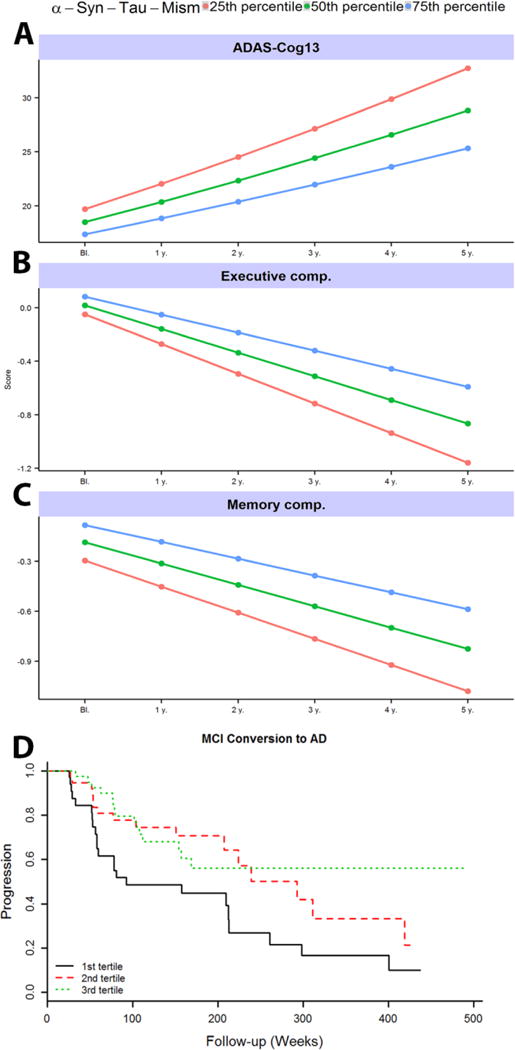
α-syn–p-tau181-Mis is associated with AD progression. A-C) Association of baseline α-syn–p-tau181-Mis with clinical progression during follow-up. Modeled progression by quartile shows faster progression for those with lower (i.e., more negative) α-syn–p-tau181-Mis values. D) Association of the α-syn–p-tau181-Mis with progression from MCI to AD. Cox hazard model results were calculated using quantitative values, but for graphical representation we present results for α-syn–p-tau181-Mis tertiles.
Longitudinal associations of CSF biomarkers with clinical measures
Longitudinal changes in CSF α-syn, pS129, and α-syn–p-tau181-Mis values did not differ between subjects designated CN, MCI, and AD at baseline. When baseline t-tau/Aβ42 was considered, no interacting effect with longitudinal changes in any of the markers was observed, indicating that the baseline t-tau/Aβ42 ratio does not predict progression of α-syn in CN, MCI, or AD subjects (data not shown). We next considered whether longitudinal changes in CSF total α-syn, pS129, or α-syn–p-tau181-Mis might differ between MCI subjects who progressed to clinical AD over the course of follow-up, compared to those whose diagnosis remained stable. Among the 133 subjects included in the pS129 model, 51 subjects were stable and 82 progressed, while 33 of the 77 subjects with Hgb<200 ng/ml who were included in the total α-syn and α-syn–p-tau181-Mis analyses remained stable over follow up (data not shown). No differences in the longitudinal progression of total α-syn, pS129 or α-syn–p-tau181-Mis were observed between these groups (data not shown). Results did not change when the single subject with 84 months follow-up was excluded (data not shown).
DISCUSSION
Up to 50% of patients with AD dementia also have LB pathology at autopsy[9, 14]. Both the mechanisms and implications of this finding remain incompletely defined, but suggestions that neurodegeneration-related proteins may interact, and that α-syn, Aβ and tau may mutually accelerate their accumulation and aggregation, are abundant[19, 35]. Both AD and PD feature impaired cellular mechanisms for clearing abnormal proteins, contributing to the burden of pathological proteins and their deleterious effects on neurons[36–38]. There is also evidence that intra-axonal α-syn and intraneuronal tau aggregates are associated with axonopathy and cellular dysfunction[39].
Translation of these findings to usefulness as biomarkers has been challenging. Patients with AD or MCI show increased CSF levels of α-syn[12, 17, 18], perhaps due to release from damaged neurons[40, 41], as has been hypothesized for the increased levels of CSF tau in AD. Fewer studies have examined α-syn across the transition from MCI to AD dementia; however, in one longitudinal study, CSF α-syn was higher in MCI subjects with a shorter duration of symptoms, but did not differ across diagnostic groups[42]. Here, we also find a significant difference in CSF α-syn levels between CN, AD and MCI. However, a biomarker that only correlated with existing biomarkers, such as total or p-tau, would be of limited use. Moreover, the cross-sectional measurements of markers overlapped substantially between groups, and perform only poorly in differentiating AD from control. Our previous finding that baseline α-syn–p-tau181-Mis was associated with a faster decline in cognitive function provided intriguing potential for a novel marker, which might distinguish subgroups of faster vs slower progressing patients. We have further expanded this analysis, demonstrating that lower α-syn–p-tau181-Mis is associated both with faster progression of cognitive decline and conversion from MCI to AD. Notably, low α-syn–p-tau181-Mis indicates an α-syn level that is lower than expected, given the high correlation of α-syn and tau in AD. Because CSF α-syn is generally found to be lower in PD patients, in contrast to the unchanged or higher levels in AD patients in most well-controlled studies, we hypothesized that a lower α-syn–p-tau181-Mis value may serve as a marker for those AD subjects with concomitant LB pathology. We initially attempted to seek support for this hypothesis by examining the few ADNI cases with pathological analysis available, and found that of the two available at the time, both showed LB pathology and had negative α-syn–p-tau181-Mis values. Since then, a small number of additional cases have come to autopsy; however, too few cases exist to perform reliable statistical analyses. Definitive confirmation of this hypothesis will require a complete cohort with matched CSF and histopathological analysis, and thus cannot be performed until such samples become available. Moreover, association of biomarker and histopathology also has limitations as a technique for examining the underlying correlations between brain and biofluid levels of analytes of interest, as substantial time may elapse between biofluid sampling and collection of tissue at autopsy. Thus, even once such samples become available, these studies must be complemented by further strategies such as mechanistic studies using in vitro and in vivo models.
Hyperphosphorylation is a feature of abnormal tau in AD and of α-syn in PD (most α-syn in LBs is pS129) [15, 20, 21, 29]. CSF pS129 has been associated with PD[15, 20–22], but its role in AD remains unclear, despite the frequency of LB pathology in AD brains. CSF total α-syn and pS129 appear to behave differently[43]; indeed, in the current study, pS129 correlated negatively with total α-syn, suggesting that differing, potentially competing processes may determine the compartments in which each form of α-syn is located in AD, including potential differences between pure AD and mixed pathology underlying the clinical symptoms. However, in this study, pS129, unlike total α-syn, predicted clinical outcomes only for executive function impairment. These findings are consistent with the clinical observation of faster cognitive decline in the LB variant of AD or AD with concomitant LBD[44, 45], and suggest that coincident pathologies might trigger cognitive deficits at lower thresholds[46, 47]. Intriguingly, a major distinction between cognitive impairment most often observed in PD compared to AD is the greater frequency of deficits in executive function rather than in memory[48]. That pS129 is associated only with this type of impairment may hint at its role in a mechanism specific to a particular pathway of cognitive decline. The hypothesis that pS129 may exacerbate cognitive deficits in AD through interactions between α-syn, pS129, Aβ and tau is well supported experimentally [49, 50] and clinically, with the finding that AD type pathology is also frequent in patients with PD, PD dementia and DLB [47, 51]. However, while this association is plausible given the known pathophysiology of α-syn protein, the association in our study was not highly significant, and further studies in additional cohorts should be performed to validate this finding.
A major strength of the current study is that prolonged follow up times available for many subjects (up to 7 years), allow us to examine the natural course of progression in total α-syn, pS129 or the α-syn–p-tau181-Mis value. However, none of the biomarkers differed in longitudinal progression based on baseline diagnosis. We also considered whether α-syn progression in CSF may be associated with the conversion from MCI to AD. We observed no differences between subjects who remained stably within the MCI diagnosis group compared to those who converted to AD. Thus, changes in α-syn may be unlikely to serve as biomarkers for the progression of AD, whether because they occur earlier in the course of the disease, or because they do not follow a simple trajectory. Nonetheless, as discussed above, α-syn does appear to be altered in AD, and further examination of its changes, perhaps starting even earlier in the disease process, should be examined.
In interpreting this study, several considerations were made to minimize the effects of confounding variables. CSF α-syn is influenced by blood contamination, prompting the use of Hgb to exclude contaminated samples. A relatively large proportion of ADNI CSF samples contained significant Hgb [12, 17]; their exclusion decreases the practical sample size, but ensures the quality of the data set. Cohort heterogeneity may also influence the outcomes, as some of those diagnosed with AD lack biochemical markers of AD pathology (that is, they have t-tau/Aβ42 within the range of CN subjects) [52, 53]. Although the ADNI cohort is better characterized than most, substantial variability among those with AD symptoms remains. However, while this complicates characterization of longitudinal changes in biochemical markers, it also allows the identification of subsets within the clinical category, as we hypothesize in subjects with low α-syn–p-tau181-Mis scores. While complete understanding of such subcategories is not possible for studies such as this, they can be useful for hypothesis generation to be tested at later times.
In conclusion, our studies confirm a strong association between CSF α-syn and t-tau and p-tau, as well as the association of α-syn and α-syn–p-tau181-Mis with longitudinal clinical outcomes. α-syn-p-tau181-Mis subjects represent a subgroup of AD that may show more rapid clinical progression, potentially due to LB pathology in these subjects. pS129 may be useful to predict deficits in executive function, and the distinctiveness of its behavior from that of total α-syn suggests differences in the underlying biology of α-syn isoforms. Further longitudinal studies will be important to uncover and understand additional CSF factors that reflect individual disease progression, and they may aid in the development of novel neuroprotective therapies.
Supplementary Material
Acknowledgments
We deeply appreciate those who have donated blood for our studies. This study was supported by grants from the National Institutes of Health (NIH) (U01 NS082137 and U01 NS091272 to JZ).
Data collection and sharing for this project was funded by the Alzheimer’s Disease Neuroimaging Initiative (ADNI) (National Institutes of Health Grant U01 AG024904) and DOD ADNI (Department of Defense award number W81XWH-12-2-0012). ADNI is funded by the National Institute on Aging, the National Institute of Biomedical Imaging and Bioengineering, and through generous contributions from the following: AbbVie, Alzheimer’s Association; Alzheimer’s Drug Discovery Foundation; Araclon Biotech; BioClinica, Inc.; Biogen; Bristol-Myers Squibb Company; CereSpir, Inc.; Cogstate; Eisai Inc.; Elan Pharmaceuticals, Inc.; Eli Lilly and Company; EuroImmun; F. Hoffmann-La Roche Ltd and its affiliated company Genentech, Inc.; Fujirebio; GE Healthcare; IXICO Ltd.; Janssen Alzheimer Immunotherapy Research & Development, LLC.; Johnson & Johnson Pharmaceutical Research & Development LLC.; Lumosity; Lundbeck; Merck & Co., Inc.; Meso Scale Diagnostics, LLC.; NeuroRx Research; Neurotrack Technologies; Novartis Pharmaceuticals Corporation; Pfizer Inc.; Piramal Imaging; Servier; Takeda Pharmaceutical Company; and Transition Therapeutics. The Canadian Institutes of Health Research is providing funds to support ADNI clinical sites in Canada. Private sector contributions are facilitated by the Foundation for the National Institutes of Health (www.fnih.org). The grantee organization is the Northern California Institute for Research and Education, and the study is coordinated by the Alzheimer’s Therapeutic Research Institute at the University of Southern California. ADNI data are disseminated by the Laboratory for Neuro Imaging at the University of Southern California.
Footnotes
Authors’ disclosures available online (http://j-alz.com/manuscript-disclosures/17-1013).
References
- 1.World Health Organization. Dementia: a Public Health Priority. Geneva: 2012. http://www.who.int/mental_health/publications/dementia_report_2012/en. [Google Scholar]
- 2.Shekhar S, Kumar R, Rai N, Kumar V, Singh K, Upadhyay AD, Tripathi M, Dwivedi S, Dey AB, Dey S. Estimation of Tau and Phosphorylated Tau181 in Serum of Alzheimer’s Disease and Mild Cognitive Impairment Patients. PLoS One. 2016;11:e0159099. doi: 10.1371/journal.pone.0159099. [DOI] [PMC free article] [PubMed] [Google Scholar]
- 3.Hulette CM, Welsh-Bohmer KA, Murray MG, Saunders AM, Mash DC, McIntyre LM. Neuropathological and neuropsychological changes in “normal” aging: evidence for preclinical Alzheimer disease in cognitively normal individuals. J Neuropathol Exp Neurol. 1998;57:1168–1174. doi: 10.1097/00005072-199812000-00009. [DOI] [PubMed] [Google Scholar]
- 4.Petersen RC. Early diagnosis of Alzheimer’s disease: is MCI too late? Curr Alzheimer Res. 2009;6:324–330. doi: 10.2174/156720509788929237. [DOI] [PMC free article] [PubMed] [Google Scholar]
- 5.Roberts R, Knopman DS. Classification and epidemiology of MCI. Clin Geriatr Med. 2013;29:753–772. doi: 10.1016/j.cger.2013.07.003. [DOI] [PMC free article] [PubMed] [Google Scholar]
- 6.Blennow K, Hampel H, Weiner M, Zetterberg H. Cerebrospinal fluid and plasma biomarkers in Alzheimer disease. Nat Rev Neurol. 2010;6:131–144. doi: 10.1038/nrneurol.2010.4. [DOI] [PubMed] [Google Scholar]
- 7.Toledo JB, Vanderstichele H, Figurski M, Aisen PS, Petersen RC, Weiner MW, Jack CR, Jr, Jagust W, Decarli C, Toga AW, Toledo E, Xie SX, Lee VM, Trojanowski JQ, Shaw LM. Factors affecting Abeta plasma levels and their utility as biomarkers in ADNI. Acta Neuropathol. 2011;122:401–413. doi: 10.1007/s00401-011-0861-8. [DOI] [PMC free article] [PubMed] [Google Scholar]
- 8.Yau WY, Tudorascu DL, McDade EM, Ikonomovic S, James JA, Minhas D, Mowrey W, Sheu LK, Snitz BE, Weissfeld L, Gianaros PJ, Aizenstein HJ, Price JC, Mathis CA, Lopez OL, Klunk WE. Longitudinal assessment of neuroimaging and clinical markers in autosomal dominant Alzheimer’s disease: a prospective cohort study. Lancet Neurol. 2015;14:804–813. doi: 10.1016/S1474-4422(15)00135-0. [DOI] [PMC free article] [PubMed] [Google Scholar]
- 9.Nelson PT, Alafuzoff I, Bigio EH, Bouras C, Braak H, Cairns NJ, Castellani RJ, Crain BJ, Davies P, Del Tredici K, Duyckaerts C, Frosch MP, Haroutunian V, Hof PR, Hulette CM, Hyman BT, Iwatsubo T, Jellinger KA, Jicha GA, Kovari E, Kukull WA, Leverenz JB, Love S, Mackenzie IR, Mann DM, Masliah E, McKee AC, Montine TJ, Morris JC, Schneider JA, Sonnen JA, Thal DR, Trojanowski JQ, Troncoso JC, Wisniewski T, Woltjer RL, Beach TG. Correlation of Alzheimer disease neuropathologic changes with cognitive status: a review of the literature. J Neuropathol Exp Neurol. 2012;71:362–381. doi: 10.1097/NEN.0b013e31825018f7. [DOI] [PMC free article] [PubMed] [Google Scholar]
- 10.Mattsson N, Zetterberg H, Hansson O, Andreasen N, Parnetti L, Jonsson M, Herukka SK, van der Flier WM, Blankenstein MA, Ewers M, Rich K, Kaiser E, Verbeek M, Tsolaki M, Mulugeta E, Rosen E, Aarsland D, Visser PJ, Schroder J, Marcusson J, de Leon M, Hampel H, Scheltens P, Pirttila T, Wallin A, Jonhagen ME, Minthon L, Winblad B, Blennow K. CSF biomarkers and incipient Alzheimer disease in patients with mild cognitive impairment. JAMA. 2009;302:385–393. doi: 10.1001/jama.2009.1064. [DOI] [PubMed] [Google Scholar]
- 11.Hansson O, Zetterberg H, Buchhave P, Londos E, Blennow K, Minthon L. Association between CSF biomarkers and incipient Alzheimer’s disease in patients with mild cognitive impairment: a follow-up study. Lancet Neurol. 2006;5:228–234. doi: 10.1016/S1474-4422(06)70355-6. [DOI] [PubMed] [Google Scholar]
- 12.Korff A, Liu C, Ginghina C, Shi M, Zhang J. alpha-Synuclein in Cerebrospinal Fluid of Alzheimer’s Disease and Mild Cognitive Impairment. J Alzheimers Dis. 2013;36:679–688. doi: 10.3233/JAD-130458. [DOI] [PMC free article] [PubMed] [Google Scholar]
- 13.Parkkinen L, Soininen H, Alafuzoff I. Regional distribution of alpha-synuclein pathology in unimpaired aging and Alzheimer disease. J Neuropathol Exp Neurol. 2003;62:363–367. doi: 10.1093/jnen/62.4.363. [DOI] [PubMed] [Google Scholar]
- 14.Lippa CF, Schmidt ML, Lee VM, Trojanowski JQ. Antibodies to alpha-synuclein detect Lewy bodies in many Down’s syndrome brains with Alzheimer’s disease. Ann Neurol. 1999;45:353–357. doi: 10.1002/1531-8249(199903)45:3<353::aid-ana11>3.0.co;2-4. [DOI] [PubMed] [Google Scholar]
- 15.Anderson JP, Walker DE, Goldstein JM, de Laat R, Banducci K, Caccavello RJ, Barbour R, Huang J, Kling K, Lee M, Diep L, Keim PS, Shen X, Chataway T, Schlossmacher MG, Seubert P, Schenk D, Sinha S, Gai WP, Chilcote TJ. Phosphorylation of Ser-129 is the dominant pathological modification of alpha-synuclein in familial and sporadic Lewy body disease. J Biol Chem. 2006;281:29739–29752. doi: 10.1074/jbc.M600933200. [DOI] [PubMed] [Google Scholar]
- 16.Stewart T, Sossi V, Aasly JO, Wszolek ZK, Uitti RJ, Hasegawa K, Yokoyama T, Zabetian CP, Leverenz JB, Stoessl A, Wang Y, Ginghina C, Liu C, Cain KC, Auinger P, Kang U, Jensen P, Shi M, Zhang J. Phosphorylated inverted question mark-synuclein in Parkinson inverted question marks disease: correlation depends on disease severity. Acta Neuropathol Commun. 2015;3:7. doi: 10.1186/s40478-015-0185-3. [DOI] [PMC free article] [PubMed] [Google Scholar]
- 17.Toledo JB, Korff A, Shaw LM, Trojanowski JQ, Zhang J. CSF alpha-synuclein improves diagnostic and prognostic performance of CSF tau and Abeta in Alzheimer’s disease. Acta Neuropathol. 2013;126:683–697. doi: 10.1007/s00401-013-1148-z. [DOI] [PMC free article] [PubMed] [Google Scholar]
- 18.Hall S, Ohrfelt A, Constantinescu R, Andreasson U, Surova Y, Bostrom F, Nilsson C, Hakan W, Decraemer H, Nagga K, Minthon L, Londos E, Vanmechelen E, Holmberg B, Zetterberg H, Blennow K, Hansson O. Accuracy of a panel of 5 cerebrospinal fluid biomarkers in the differential diagnosis of patients with dementia and/or parkinsonian disorders. Arch Neurol. 2012;69:1445–1452. doi: 10.1001/archneurol.2012.1654. [DOI] [PubMed] [Google Scholar]
- 19.Reesink FE, Lemstra AW, van Dijk KD, Berendse HW, van de Berg WD, Klein M, Blankenstein MA, Scheltens P, Verbeek MM, van der Flier WM. CSF alpha-synuclein does not discriminate dementia with Lewy bodies from Alzheimer’s disease. J Alzheimers Dis. 2010;22:87–95. doi: 10.3233/JAD-2010-100186. [DOI] [PubMed] [Google Scholar]
- 20.Fujiwara H, Hasegawa M, Dohmae N, Kawashima A, Masliah E, Goldberg MS, Shen J, Takio K, Iwatsubo T. alpha-Synuclein is phosphorylated in synucleinopathy lesions. Nat Cell Biol. 2002;4:160–164. doi: 10.1038/ncb748. [DOI] [PubMed] [Google Scholar]
- 21.Saito Y, Kawashima A, Ruberu NN, Fujiwara H, Koyama S, Sawabe M, Arai T, Nagura H, Yamanouchi H, Hasegawa M, Iwatsubo T, Murayama S. Accumulation of phosphorylated alpha-synuclein in aging human brain. J Neuropathol Exp Neurol. 2003;62:644–654. doi: 10.1093/jnen/62.6.644. [DOI] [PubMed] [Google Scholar]
- 22.Walker DG, Lue LF, Adler CH, Shill HA, Caviness JN, Sabbagh MN, Akiyama H, Serrano GE, Sue LI, Beach TG. Changes in properties of serine 129 phosphorylated alpha-synuclein with progression of Lewy-type histopathology in human brains. Exp Neurol. 2013;240:190–204. doi: 10.1016/j.expneurol.2012.11.020. [DOI] [PMC free article] [PubMed] [Google Scholar]
- 23.Samuel F, Flavin WP, Iqbal S, Pacelli C, Sri Renganathan SD, Trudeau LE, Campbell EM, Fraser PE, Tandon A. Effects of Serine 129 Phosphorylation on alpha-Synuclein Aggregation, Membrane Association, and Internalization. J Biol Chem. 2016;291:4374–4385. doi: 10.1074/jbc.M115.705095. [DOI] [PMC free article] [PubMed] [Google Scholar]
- 24.Tenreiro S, Reimao-Pinto MM, Antas P, Rino J, Wawrzycka D, Macedo D, Rosado-Ramos R, Amen T, Waiss M, Magalhaes F, Gomes A, Santos CN, Kaganovich D, Outeiro TF. Phosphorylation modulates clearance of alpha-synuclein inclusions in a yeast model of Parkinson’s disease. PLoS Genet. 2014;10:e1004302. doi: 10.1371/journal.pgen.1004302. [DOI] [PMC free article] [PubMed] [Google Scholar]
- 25.Wang Y, Shi M, Chung KA, Zabetian CP, Leverenz JB, Berg D, Srulijes K, Trojanowski JQ, Lee VM, Siderowf AD, Hurtig H, Litvan I, Schiess MC, Peskind ER, Masuda M, Hasegawa M, Lin X, Pan C, Galasko D, Goldstein DS, Jensen PH, Yang H, Cain KC, Zhang J. Phosphorylated alpha-synuclein in Parkinson’s disease. Sci Transl Med. 2012;4:121ra120. doi: 10.1126/scitranslmed.3002566. [DOI] [PMC free article] [PubMed] [Google Scholar]
- 26.Hong Z, Shi M, Chung KA, Quinn JF, Peskind ER, Galasko D, Jankovic J, Zabetian CP, Leverenz JB, Baird G, Montine TJ, Hancock AM, Hwang H, Pan C, Bradner J, Kang UJ, Jensen PH, Zhang J. DJ-1 and alpha-synuclein in human cerebrospinal fluid as biomarkers of Parkinson’s disease. Brain. 2010;133:713–726. doi: 10.1093/brain/awq008. [DOI] [PMC free article] [PubMed] [Google Scholar]
- 27.Kang JH, Irwin DJ, Chen-Plotkin AS, Siderowf A, Caspell C, Coffey CS, Waligorska T, Taylor P, Pan S, Frasier M, Marek K, Kieburtz K, Jennings D, Simuni T, Tanner CM, Singleton A, Toga AW, Chowdhury S, Mollenhauer B, Trojanowski JQ, Shaw LM. Association of cerebrospinal fluid beta-amyloid 1-42, T-tau, P-tau181, and alpha-synuclein levels with clinical features of drug-naive patients with early Parkinson disease. JAMA Neurol. 2013;70:1277–1287. doi: 10.1001/jamaneurol.2013.3861. [DOI] [PMC free article] [PubMed] [Google Scholar]
- 28.Mollenhauer B, Locascio JJ, Schulz-Schaeffer W, Sixel-Doring F, Trenkwalder C, Schlossmacher MG. alpha-Synuclein and tau concentrations in cerebrospinal fluid of patients presenting with parkinsonism: a cohort study. Lancet Neurol. 2011;10:230–240. doi: 10.1016/S1474-4422(11)70014-X. [DOI] [PubMed] [Google Scholar]
- 29.Tokuda T, Salem SA, Allsop D, Mizuno T, Nakagawa M, Qureshi MM, Locascio JJ, Schlossmacher MG, El-Agnaf OM. Decreased alpha-synuclein in cerebrospinal fluid of aged individuals and subjects with Parkinson’s disease. Biochem Biophys Res Commun. 2006;349:162–166. doi: 10.1016/j.bbrc.2006.08.024. [DOI] [PubMed] [Google Scholar]
- 30.Crane PK, Carle A, Gibbons LE, Insel P, Mackin RS, Gross A, Jones RN, Mukherjee S, Curtis SM, Harvey D, Weiner M, Mungas D. Development and assessment of a composite score for memory in the Alzheimer’s Disease Neuroimaging Initiative (ADNI) Brain Imaging Behav. 2012;6:502–516. doi: 10.1007/s11682-012-9186-z. [DOI] [PMC free article] [PubMed] [Google Scholar]
- 31.Kang JH, Korecka M, Figurski MJ, Toledo JB, Blennow K, Zetterberg H, Waligorska T, Brylska M, Fields L, Shah N, Soares H, Dean RA, Vanderstichele H, Petersen RC, Aisen PS, Saykin AJ, Weiner MW, Trojanowski JQ, Shaw LM. The Alzheimer’s Disease Neuroimaging Initiative 2 Biomarker Core: A review of progress and plans. Alzheimers Dement. 2015;11:772–791. doi: 10.1016/j.jalz.2015.05.003. [DOI] [PMC free article] [PubMed] [Google Scholar]
- 32.Shaw LM, Vanderstichele H, Knapik-Czajka M, Clark CM, Aisen PS, Petersen RC, Blennow K, Soares H, Simon A, Lewczuk P, Dean R, Siemers E, Potter W, Lee VM, Trojanowski JQ. Cerebrospinal fluid biomarker signature in Alzheimer’s disease neuroimaging initiative subjects. Ann Neurol. 2009;65:403–413. doi: 10.1002/ana.21610. [DOI] [PMC free article] [PubMed] [Google Scholar]
- 33.R Core Team. R Foundation for Statistical Computing. Vienna, Austria: 2017. [Google Scholar]
- 34.Gibbons LE, Carle AC, Mackin RS, Harvey D, Mukherjee S, Insel P, Curtis SM, Mungas D, Crane PK. A composite score for executive functioning, validated in Alzheimer’s Disease Neuroimaging Initiative (ADNI) participants with baseline mild cognitive impairment. Brain Imaging Behav. 2012;6:517–527. doi: 10.1007/s11682-012-9176-1. [DOI] [PMC free article] [PubMed] [Google Scholar]
- 35.Jellinger KA. Interaction between alpha-synuclein and other proteins in neurodegenerative disorders. Scientific World Journal. 2011;11:1893–1907. doi: 10.1100/2011/371893. [DOI] [PMC free article] [PubMed] [Google Scholar]
- 36.Majd S, Power JH, Grantham HJ. Neuronal response in Alzheimer’s and Parkinson’s disease: the effect of toxic proteins on intracellular pathways. BMC Neurosci. 2015;16:69. doi: 10.1186/s12868-015-0211-1. [DOI] [PMC free article] [PubMed] [Google Scholar]
- 37.Spires-Jones TL, Attems J, Thal DR. Interactions of pathological proteins in neurodegenerative diseases. Acta Neuropathol. 2017;134:187–205. doi: 10.1007/s00401-017-1709-7. [DOI] [PMC free article] [PubMed] [Google Scholar]
- 38.Tsigelny IF, Crews L, Desplats P, Shaked GM, Sharikov Y, Mizuno H, Spencer B, Rockenstein E, Trejo M, Platoshyn O, Yuan JX, Masliah E. Mechanisms of hybrid oligomer formation in the pathogenesis of combined Alzheimer’s and Parkinson’s diseases. PLoS One. 2008;3:e3135. doi: 10.1371/journal.pone.0003135. [DOI] [PMC free article] [PubMed] [Google Scholar]
- 39.Li X, James S, Lei P. Interactions Between alpha-Synuclein and Tau Protein: Implications to Neurodegenerative Disorders. J Mol Neurosci. 2016;60:298–304. doi: 10.1007/s12031-016-0829-1. [DOI] [PubMed] [Google Scholar]
- 40.Bellani S, Sousa VL, Ronzitti G, Valtorta F, Meldolesi J, Chieregatti E. The regulation of synaptic function by alpha-synuclein. Commun Integr Biol. 2010;3:106–109. doi: 10.4161/cib.3.2.10964. [DOI] [PMC free article] [PubMed] [Google Scholar]
- 41.Scott DA, Tabarean I, Tang Y, Cartier A, Masliah E, Roy S. A pathologic cascade leading to synaptic dysfunction in alpha-synuclein-induced neurodegeneration. J Neurosci. 2010;30:8083–8095. doi: 10.1523/JNEUROSCI.1091-10.2010. [DOI] [PMC free article] [PubMed] [Google Scholar]
- 42.Berge G, Sando SB, Albrektsen G, Lauridsen C, Moller I, Grontvedt GR, Brathen G, White LR. Alpha-synuclein measured in cerebrospinal fluid from patients with Alzheimer’s disease, mild cognitive impairment, or healthy controls: a two year follow-up study. BMC Neurol. 2016;16:180. doi: 10.1186/s12883-016-0706-0. [DOI] [PMC free article] [PubMed] [Google Scholar]
- 43.Majbour NK, Chiasserini D, Vaikath NN, Eusebi P, Tokuda T, van de Berg W, Parnetti L, Calabresi P, El-Agnaf OM. Increased levels of CSF total but not oligomeric or phosphorylated forms of alpha-synuclein in patients diagnosed with probable Alzheimer’s disease. Sci Rep. 2017;7:40263. doi: 10.1038/srep40263. [DOI] [PMC free article] [PubMed] [Google Scholar]
- 44.Kraybill ML, Larson EB, Tsuang DW, Teri L, McCormick WC, Bowen JD, Kukull WA, Leverenz JB, Cherrier MM. Cognitive differences in dementia patients with autopsy-verified AD, Lewy body pathology, or both. Neurology. 2005;64:2069–2073. doi: 10.1212/01.WNL.0000165987.89198.65. [DOI] [PMC free article] [PubMed] [Google Scholar]
- 45.Olichney JM, Galasko D, Salmon DP, Hofstetter CR, Hansen LA, Katzman R, Thal LJ. Cognitive decline is faster in Lewy body variant than in Alzheimer’s disease. Neurology. 1998;51:351–357. doi: 10.1212/wnl.51.2.351. [DOI] [PubMed] [Google Scholar]
- 46.Chui HC, Zarow C, Mack WJ, Ellis WG, Zheng L, Jagust WJ, Mungas D, Reed BR, Kramer JH, Decarli CC, Weiner MW, Vinters HV. Cognitive impact of subcortical vascular and Alzheimer’s disease pathology. Ann Neurol. 2006;60:677–687. doi: 10.1002/ana.21009. [DOI] [PMC free article] [PubMed] [Google Scholar]
- 47.Irwin DJ, White MT, Toledo JB, Xie SX, Robinson JL, Van Deerlin V, Lee VM, Leverenz JB, Montine TJ, Duda JE, Hurtig HI, Trojanowski JQ. Neuropathologic substrates of Parkinson disease dementia. Ann Neurol. 2012;72:587–598. doi: 10.1002/ana.23659. [DOI] [PMC free article] [PubMed] [Google Scholar]
- 48.Emre M, Aarsland D, Brown R, Burn DJ, Duyckaerts C, Mizuno Y, Broe GA, Cummings J, Dickson DW, Gauthier S, Goldman J, Goetz C, Korczyn A, Lees A, Levy R, Litvan I, McKeith I, Olanow W, Poewe W, Quinn N, Sampaio C, Tolosa E, Dubois B. Clinical diagnostic criteria for dementia associated with Parkinson’s disease. Mov Disord. 2007;22:1689–1707. doi: 10.1002/mds.21507. quiz 1837. [DOI] [PubMed] [Google Scholar]
- 49.Obi K, Akiyama H, Kondo H, Shimomura Y, Hasegawa M, Iwatsubo T, Mizuno Y, Mochizuki H. Relationship of phosphorylated alpha-synuclein and tau accumulation to Abeta deposition in the cerebral cortex of dementia with Lewy bodies. Exp Neurol. 2008;210:409–420. doi: 10.1016/j.expneurol.2007.11.019. [DOI] [PubMed] [Google Scholar]
- 50.Swirski M, Miners JS, de Silva R, Lashley T, Ling H, Holton J, Revesz T, Love S. Evaluating the relationship between amyloid-beta and alpha-synuclein phosphorylated at Ser129 in dementia with Lewy bodies and Parkinson’s disease. Alzheimers Res Ther. 2014;6:77. doi: 10.1186/s13195-014-0077-y. [DOI] [PMC free article] [PubMed] [Google Scholar]
- 51.Jellinger KA, Attems J. Prevalence and impact of vascular and Alzheimer pathologies in Lewy body disease. Acta Neuropathol. 2008;115:427–436. doi: 10.1007/s00401-008-0347-5. [DOI] [PubMed] [Google Scholar]
- 52.Kang JH, Korecka M, Toledo JB, Trojanowski JQ, Shaw LM. Clinical utility and analytical challenges in measurement of cerebrospinal fluid amyloid-beta(1-42) and tau proteins as Alzheimer disease biomarkers. Clin Chem. 2013;59:903–916. doi: 10.1373/clinchem.2013.202937. [DOI] [PMC free article] [PubMed] [Google Scholar]
- 53.Mo Y, Stromswold J, Wilson K, Holder D, Sur C, Laterza O, Savage MJ, Struyk A, Scheltens P, Teunissen CE, Burke J, Macaulay SL, Brathen G, Sando SB, White LR, Weiss C, Cowes A, Bush MM, DeSilva G, Darby DG, Rainey-Smith SR, Surls J, Sagini E, Tanen M, Altman A, Luthman J, Egan MF. A multinational study distinguishing Alzheimer’s and healthy patients using cerebrospinal fluid tau/Abeta42 cutoff with concordance to amyloid positron emission tomography imaging. Alzheimers Dement (Amst) 2017;6:201–209. doi: 10.1016/j.dadm.2017.02.004. [DOI] [PMC free article] [PubMed] [Google Scholar]
Associated Data
This section collects any data citations, data availability statements, or supplementary materials included in this article.