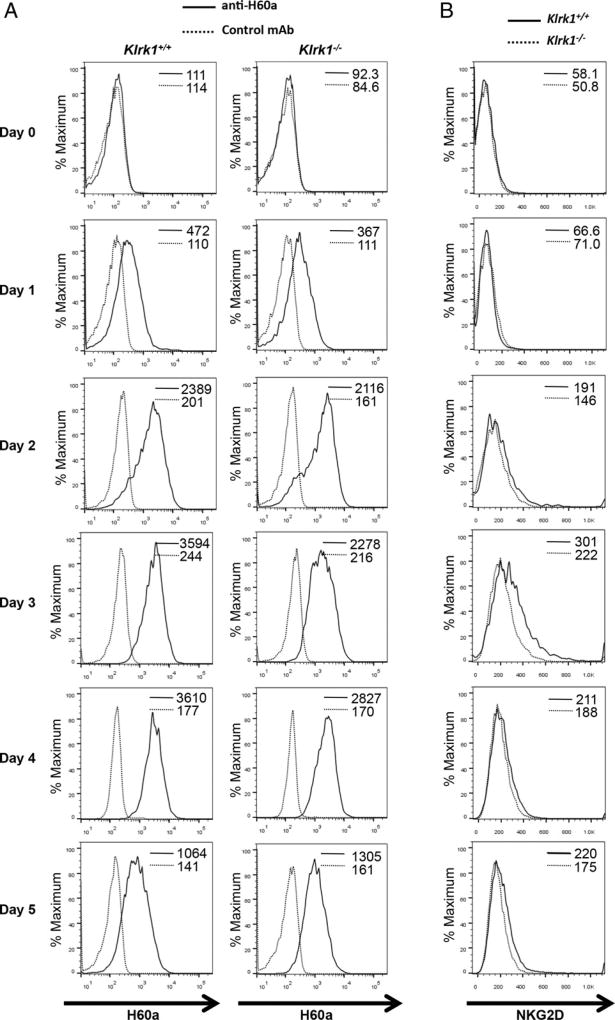
FIGURE 3. NOD CD8+ T cells express both H60a and NKG2D upon activation.
Expression of (A) H60a and (B) NKG2D on CD8+ T cells purified from 6 to 8 wk old Klrk1−/− and wild-type NOD mice activated with anti-CD3ε and anti-CD28 Abs. Mean fluorescence intensity of staining is shown. Data are representative of at least four independent experiments.

