

Abstract
Treatments for autoimmunity - diseases where the immune system mistakenly attacks self-molecules - are not curative and leave patients immunocompromised. New studies aimed at more specific treatments reveal development of inflammation or tolerance is influenced by the form self-antigens are presented. Using a mouse model of multiple sclerosis (MS), we show for the first time that quantum dots (QDs) can be used to generate immunological tolerance by controlling the density of self-antigen on QDs. These assemblies display dense arrangements of myelin self-peptide associated with disease in MS, are uniform in size (<20 nm), and allow direct visualization in immune tissues. Peptide-QDs rapidly concentrate in draining lymph nodes, co-localizing with macrophages expressing scavenger receptors involved in tolerance. Treatment with peptide-QDs reduces disease incidence 10-fold. Strikingly, the degree of tolerance - and the underlying expansion of regulatory T cells - correlates with the density of myelin molecules presented on QDs. A key discovery is that higher numbers of tolerogenic particles displaying lower levels of self-peptide are more effective for inducing tolerance than fewer particles each displaying higher densities of peptide. QDs conjugated with self-antigens could serve as a new platform to induce tolerance, while visualizing QD therapeutics in tolerogenic tissue domains.
Keywords: quantum dots and nanoparticles, vaccine and immunotherapy, modeling and simulation, theranostics, autoimmunity, tolerance
Graphical abstract
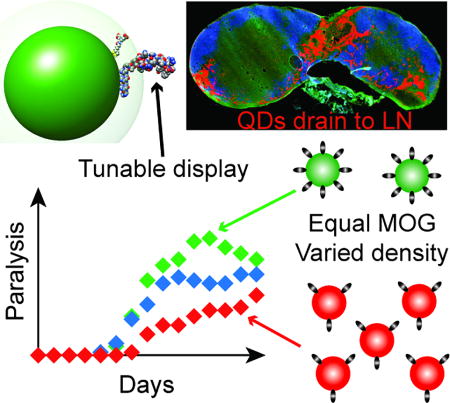
Quantum dots decorated with myelin peptides induce tolerance in a mouse model of multiple sclerosis. These nanoscale constructs rapidly drain to lymph nodes – tissues that coordinate immune function. The degree of tolerance, and the expansion of regulatory T cells capable of controlling disease, directly correlates to the density of peptide ligand displayed on the quantum dots.
1. Introduction
In multiple sclerosis (MS), self-reactive antibodies and T cells attack the myelin sheath insulating the central nervous system (CNS).[1, 2] Existing therapies can suppress these effects, but are not curative and leave patients immunocompromised.[3, 4] One promising strategy to overcome these hurdles is generation of regulatory T cells (TREGS). These cells can act in a myelin-specific manner to restrain the inflammatory response against myelin without non-specific suppression.[5–7] New studies focused on more specific treatments reveal that the development of inflammation or tolerance against self-molecules is influenced by the concentration and form of antigen reaching the tissues that coordinate immune function, namely, lymph nodes (LNs) and the spleen.[5, 8–11] Thus, tunable control over the display of these self-ligands could enable more specific and effective therapies.[12] Along these lines, three recent discoveries motivated our strategy to test QDs as a nanoscale scaffold to promote tolerance. First, several reports demonstrate sub-30 nm nanoparticles drain very efficiently through lymphatic vessels and accumulate in LNs.[13, 14] Second, new studies reveal that changing the way myelin is processed and presented to the immune system can drive tolerance instead of inflammation.[15–18] For example, one group induced T cell tolerance by treatment with large microparticles decorated with myelin peptide that trafficked to macrophages expressing a scavenger receptor (MARCO) normally involved in uptake and removal of particulate debris.[15] This altered trafficking activates apoptotic clearance pathways that bias responses against these peptides toward tolerance. Lastly, two seminal papers reveal direct connections between LNs and the CNS.[19, 20] This discovery suggests engineering the response to self-antigens in LNs during T cell priming could provide a direct route to generate TREGS that subsequently migrate to the CNS to control pathogenic T cells (e.g., TH1, TH17) attacking myelin.
QDs offer many attractive properties to achieve the goals above.[21] Their broad absorption, tunable photoluminescence, and strong resistance to photobleaching enable powerful deep-tissue imaging.[22–24] Structurally, QDs serve as a central platform for high-avidity display of biomolecules.[25] We recently showed QDs remain bright while displaying controlled numbers of peptides in cells and complex tissues (e.g., brain) with no overt toxicity,[26, 27] similar to other QD toxicity studies.[28, 29] Of note, QDs allow facile tracking and drainage through lymphatics.[30] We thus hypothesized that QDs displaying defined densities of the myelin oligodendrocyte glycoprotein peptide (MOG, MEVGWYRSPFSRVVHLYRNGK) – a self-peptide sequence attacked during MS – would allow efficient visualization of trafficking to lymphoid tissues, while altering the processing and trafficking of MOG to promote TREGs that control disease in a mouse model of MS.
QDs modified with myelin or control peptides exhibited tunable, uniform features – peptide display density and size, for example. These materials were non-toxic to primary immune cells and did not trigger any intrinsic inflammatory responses. In mice, the peptide-QDs rapidly drained to lymph nodes following injection, and were co-localized with macrophages expressing scavenger receptors involved in tolerance. MOG-QD treatment in mice induced with a mouse model of MS drastically reduced disease severity and incidence, while QDs modified with control peptide sequences did not. Importantly, these therapeutic effects were tunable and directly correlated with not just the dose, but with the density of MOG ligands assembled on the QD surfaces.
2. Results and Discussion
2.1 Self-peptides can be assembled at high densities on QD surfaces
We began our studies using 625 nm emitting CdSe/ZnS core/shell QDs (Figure S1) with a diameter of 9.2 ± 0.8 nm (Figure 1a). We have previously shown this system is useful in biological contexts because these QDs can be made biocompatible using the zwitterionic CL4 ligand (Figure S2).[27] For peptide assembly, we employed metal-affinity driven coordination to the QD surface (Kd~10−9 M), which is nearly instantaneous upon simple mixing of QDs with peptide.[25] Since this assembly follows a Poisson distribution, the actual number of peptides loaded per QD is close to the input peptide:QD ratio, except at very low densities (<4 peptides/QD).
Figure 1.

MOG-QDs offer tunable display of MOG peptide ligands. a) TEM image of 9.2 ± 0.8 nm CdSe/ZnS core/shell 625 emitting QDs. b) Structural simulation of the MOG-QD to scale with an energy minimized CL4 ligand attached to the surface with an extension of ~1.1 nm. c) Electrophoretic mobility of MOG-QDs was assessed in a 1% agarose gel run in 1× TBE buffer. d) MOG-QD size was measured by DLS. e) MOG-QD size was compared to rate of diffusion. f) Simulation was used to confirm MOG loading densities. Data in (e) represent mean ± s.d.
To facilitate assembly, MOG was synthesized with an N-terminus sequence of HHHHHSAAAAAG, where (H)5 participates in Zn-coordination, S acts as a flexible hinge to display the peptide away from the QD surface, and (A)5 forms a rigid alpha-helical spacer terminated by the G residue. These interactions were simulated using an energy-minimized approach, revealing the conformation in Figure 1b. Although many conformations for the (His)5S(Ala)5G N-terminal portion are possible, the outcome for this segment of the full-length peptide attached to the QDs has been confirmed experimentally in our previous work by Förster resonance energy transfer (FRET).[25, 26, 31–34] With respect to the peptide attachment point on the QD surface, previous FRET studies in conjunction with modeling have confirmed that the peptides distribute around the QD surface in a random manner and do not disproportionally assemble in any given area.[35] Thus this system creates an opportunity to understand the role of ligand density on the induction of tolerance. To confirm this capability experimentally, QD modification was carried out at increasing ratios of fluorescent MOG peptide, then purified by ultracentrifugation, and quantified by fluorimetry. These studies revealed tunable modification of QDs up to a density of 150 MOG peptides per QD (Figure S3).
2.2 MOG-QD exhibit uniform diameters ideal for lymphatic trafficking
We next characterized how different levels of modification of QDs with MOG self-antigens impacted particle size and mobility. Electrophoretic mobility in agarose gels confirmed an inverse relationship between the MOG:QD conjugation ratio and migration (Figure 1c). Since MOG peptide has a net charge of +4, the observed patterns are consistent with a less negative charge as the MOG:QD ratio increases until charge balance is approached and migration stops. These effects were further confirmed with zeta potential measurements that revealed less negative charges as a function of increasing MOG:QD ratios (Figure S4). Dynamic light scattering (DLS) indicated MOG-QD conjugates were monodisperse (Figure 1d), with control over MOG conjugation to QDs further shown by hydrodynamic diameters (HD) increasing from 15.0 ± 0.24 nm to 21.0 ± 0.63 nm over MOG:QD functionalization ratios of 1:1 to 100:1 (Figure 1e, blue). The diffusion coefficient decreased correspondingly over this same set of ratios (Figure 1e, red). MOG-QDs prepared at ratios up to 100:1 exhibited HD of approximately 20 nm, optimal for drainage to LNs.[13, 14] Thus, within an immunologically-relevant size range, QDs with a variety of ligands densities could be generated. In particular, in the cell and animal studies below, a range of 17:1 to 65:1 MOG:QD ratios were used. Experimental measurements of the density of peptide ligands displayed on the QDs (Figure S3) were also in good agreement with simulations of peptide-QD assembly for ratios of 17:1 and 65:1, corresponding to conjugates with 17 ± 4 peptides and 52 ± 7 peptides assembled per QD (Figure 1f).
While recent studies aimed at inducing tolerance have used microparticles or larger nanoparticles (~100–500 nm),[7, 15, 16] the results above highlight unique features of QDs, including 5–50 fold smaller diameters (<20 nm) for efficient concentration in LNs. This size range is particularly noteworthy in the context of lymphatic drainage. Seminal work has shown that even particles on the size range of 100 nm drain inefficiently to LNs, while a diameter of 20 nm dramatically improves lymphatic trafficking.[14] Further, MOG-QD particles also self-assemble, allowing facile administration without need for complicating stabilizers, reactions, or purification steps. With respect to loading, in contrast to the typical loading levels of several or tens of micrograms of peptide per milligram of nanoparticle carrier, the MOG-QDs above offer loading as high as 550 µg peptide/mg QD for 130:1 MOG:QD, as well as direct tuning of surface display density. Using QDs as shuttles for self-peptides also opens a new dimension as a tool for autoimmune research, enabling visualization and tracking of therapeutic conjugates without photobleaching, additional probes, or dissociation of dyes from a carrier.
2.3 MOG-QD drive efficient presentation of self-antigen to T cells without inflammation
To exploit the unique features of QDs for modulating immunity, we first investigated uptake and antigen processing of MOG-QDs using conjugates at the highest antigen density we characterized, 150:1 (Figure S4, Figure S5). Dendritic cells (DCs) isolated from mouse spleens were incubated with MOG-QDs or co-cultured with MOG-QDs and transgenic T cells recognizing MOG when displayed by DCs (Figure 2a). As expected, flow cytometry analysis of DC cultures revealed efficient, dose-dependent uptake of QDs (Figure 2b, Figure S6), but these conjugates – lacking inflammatory signals – did not activate DCs, as indicated by the expression levels of CD40 (Figure 2c), CD86 (Figure 2d), and CD80 (Figure S7). This finding is important because many common polymeric carriers (e.g., poly(lactide-co-glycolide) exhibit intrinsic features – such as charge or repetitive monomers – that can activate innate immune pathways and cause inflammation.[36] These outcomes could worsen disease in the context of autoimmunity.
Figure 2.

DCs can phagocytose MOG-QDs and process and present MOG to T cells. a) DCs were incubated with MOG-QDs and transgenic 2D2 T cells that proliferate in response to MOG. b) DC uptake of MOG-QDs was quantified by fluorescent intensity by flow cytometry. DC activation was measured by expression of CD40 (c) and CD86 (d) activation markers. e) Viability was assessed by DAPI staining 72 hours after cell treatment. f) 2D2 T cell proliferation was quantified by proliferation dye dilution by flow cytometry. Data in (b)–(f) represent the mean (N=3) ± s.d. Statistical significance was determined by one-way ANOVA with p values ≤ 0.05 considered significant (****p<.0001; ns = not significant).
We next tested if MOG displayed on QDs is processed and presented in a manner that is accessible to myelin-reactive CD4+ T cells from 2D2 transgenic mice. When 2D2 T cells encounter MOG presented by DCs with the correct co-stimulatory signals, these cells proliferate. In these studies, DCs were incubated with a fixed number of QDs, but displaying different densities – either 17 or 52 peptides per QD – of MOG ligand or an irrelevant peptide ligand from ovalbumin (CTRL). To drive co-stimulatory signaling, DCs were also treated with a common molecular adjuvant (CpG). DAPI staining was used to evaluate the effect of MOG-QD treatment on cell viability in co-cultures relative to treatment with free MOG (Figure 2e). This DNA binding stain enters leaky (i.e., damages) cell membranes more efficiently than cells with intact membranes. Thus Figure 2e suggested MOG-QDs did not cause toxicity by this measure. During T cell co-culture, MOG-QDs caused high levels of proliferation, indicated by a dramatic dilution of signal from a fluorescence reporter as successive generations of T cells divided (Figure 2f, Figure S8). These levels were equivalent to values measured for free MOG, while neither CTRL-QDs nor free CTRL peptide caused proliferation (Figure 2f). This result demonstrates that conjugation of MOG to QDs does not interfere with the ability of DCs to process and present peptides, and that these materials can support antigen-specific T cell proliferation. In mice and humans, naïve MOG-specific CD4+ T cells have the capacity to develop into either inflammatory phenotypes (e.g., TH1, TH17) or TREGS, depending on the form of antigen presentation (e.g., soluble vs. particulate) and the other signals encountered during T cell differentiation.[3, 5, 9] Thus, we next employed a common mouse model of MS to test if MOG-QDs traffic to tolerogenic domains of lymph nodes and polarize T cells to promote tolerance as a function of the density of ligands displayed.
2.4 Draining Lymph Node Imaging and Analysis
We began by administering MOG-QDs to C57BL/6 mice by subcutaneous (s.c.) injection, then used fluorescence microscopy to assess lymphatic drainage. After 24 hours the draining and non-draining inguinal LNs (iLNs) were harvested, sectioned, and stained for common lymphocytes (B cells, B220; T cells, CD3). The draining iLN from injected mice exhibited striking levels of MOG-QDs in the medullary sinus (asterisk) and subcapsular sinuses (arrows), as well as less concentrated, widespread distribution in the T cell zone/paracortex (Figure 3a). The non-draining iLN showed a miniscule, but detectable, level of MOG-QD fluorescence, while signal was absent in iLNs from untreated mice (Figure 3a). Flow cytometry confirmed these results, revealing high levels of MOG-QDs only in the draining iLNs (Figure 3b,c). Further, there was no difference in DAPI staining levels in the cells of tissues containing MOG-QDs compared to LNs of untreated mice (Figure 3d).
Figure 3.

MOG-QDs drain to the iLN and induce tolerance in EAE. a) iLNs were removed 24 hours after MOG-QD injection, stained for T and B cells, and visualized by fluorescent microscopy. MOG-QD signal in iLNs was quantified by flow cytometry (b) and (c). d) Viability of the LNs following MOG-QD injection was assessed by DAPI staining. e) iLN sections from this study were additionally stained for macrophage markers and the scavenger receptor MARCO. Data in (c) and (d) represent samples (N=3) ± s.d., with statistical significance determined by one-way ANOVA with post-test corrections for multiple comparisons. P values ≤ 0.05 were considered significant (****p<.0001; ns = not significant).
To determine if MOG-QDs might traffic to marginal zone macrophages and tolerance-inducing scavenger receptors, we stained iLNs for F4/80 and MARCO, respectively. Interestingly, MOG-QDs were frequently co-localized with both macrophages and MARCO throughout the iLN (Figure 3e). This co-localization was also observed among the low levels of QDs in non-draining iLN, while QD signal was absent in control iLNs from untreated mice (Figure S9). These experiments support an intriguing idea arising in the field, that altering the trafficking of self-antigen can promote tolerance by directing self-peptides to tissues and pathways (e.g., MARCO) already primed to generate regulatory responses, instead of inflammatory responses. Recent studies with large polymer nanoparticle or microparticles conjugated with self-antigen reveal this conjugation leads to trafficking to macrophages expressing MARCO.[15–17] This discovery is supported by natural immune mechanisms that direct fragments from apoptotic cells to particular regulatory microdomains in LNs that help maintain tolerance against self-cells (e.g. recycling red blood cells).[37] Our findings demonstrate that MOG-QDs drain very efficiently through lymphatics, allowing direct visualization of co-localization with macrophages and scavenger receptors involved in apoptotic clearance and promotion of tolerance against antigens reaching these domains.[38]
2.5 MOG-QDs improve EAE, while QDs or MOG alone, or CTRL-QDs do not
To provide an initial indication of the therapeutic potential of MOG-QDs, we first induced mice with experimental autoimmune encephalomyelitis (EAE), a myelin-driven model of MS that results in loss of motor function and development of total paralysis over 2–3 weeks.[6, 7, 39] Two days later, mice received a single s.c. injection of MOG-QDs or one of several control treatments: free MOG, CTRL-QDs, or QDs only (Figure 4a). The groups were then monitored daily for both paralysis and weight loss, a common symptom of disease. Paralysis was measured using a standard clinical disease scoring rubric in which increased clinical score corresponds to more severe paralysis. Compared with untreated mice and control groups receiving QDs only, free MOG, or CTRL-QDs, the MOG-QDs conferred a striking therapeutic effect on both disease progression (Figure 4b) and weight loss (Figure S10). For clarity, statistics are only shown comparing MOG-QDs against the untreated control group. Regardless of time point, however, none of the groups except MOG-QDs caused significant differences in clinical scores when comparing treatments. Mice treated with MOG-QDs also exhibited substantially decreased disease incidence (Figure 4c). Further, there were no differences in disease incidence between untreated mice and those receiving the other treatments. Importantly, the lack of efficacy with the CTRL-QDs suggests MOG-QDs promote tolerance in a myelin-dependent manner. With clear indications of the role of each component, we sought to understand how the density of peptide displayed by QDs impacted T cell function, tolerance, and therapeutic effect.
Figure 4.

a) Mice were induced with EAE on days 0 and 1 and injected with MOG-QDs or component controls on day 2. b) Disease progression was monitored by clinical score through day 21. c) Disease onset was defined as the first day a mouse displayed symptoms. Incidence was tracked through day 21. Data in (b) represent samples (N=8) ± s.e.m. p values ≤ 0.05 were considered significant (**p<.01, ***p<.001, ****p<.0001).
2.6 MOG-QD control disease in a dose-dependent manner
We first investigated the role of MOG dose on the extent of tolerance induced by MOG-QD treatment. Mice were again induced with EAE and received an injection of MOG-QDs on day 2 (Figure 5a). While the mass of QD was fixed in these studies, two different MOG ligand densities, 17:1 and 52:1 (MOG:QD), were displayed on these QD, altering the dose of MOG while keeping the number of QDs constant. Compared with untreated mice, both MOG-QD treatments conferred therapeutic effects. Interestingly, the higher dose nearly eliminated disease-induced paralysis, as indicated by a markedly lower clinical score (Figure 5b), while the lower dose caused a significant, but lesser therapeutic effect. Relative to this lower dose, the higher MOG dose conferred efficacy that was statistically significant at several points during peak disease (e.g., day 17, day 19). The higher MOG dose (MOG-QD 52:1) also drove a 10-fold reduction in disease incidence – 1 out of 10 mice – compared to 100% incidence in untreated mice, and 40% incidence in mice treated with the lower MOG dose (MOG-QD 17:1) (Figure 5c). Compared to untreated mice, the incidences at the end of the study were significantly lower for both the 17:1 (p<.01) and 52:1 treatments (p<.0001). At the peak of disease (day 17), untreated mice exhibited a mean clinical score of 3.0 (complete hind limb paralysis), while mice treated with QD formulations exhibited mean scores of 1.0 (loss of tail function) and 0.5 (limp tip of tail), for the low and high ligand densities, respectively (Figure 5d). MOG-QD treatment also significantly reduced weight loss (Figure S11).
Figure 5.

MOG-QD treatment expands TREGS and increased MOG dose enhances tolerance. Mice were induced with EAE and treated with MOG-QDs (17:1 or 52:1) (a). Mice were monitored daily using a standard clinical EAE scoring rubric (b), where disease onset is the first day that symptoms arise (c). At peak disease (day 17), mean score was compared between groups (d). In a separate similar experiment, the iLNs of mice were harvested to stain for TREGS (e) and (f) and the TH1 phenotype (g). Data in b, c, and d represent the mean (N=10) ± s.e.m. Data in f and g represent the mean (N=5) ± s.d. Statistical significance for b was determined by two-way ANOVA with post-test corrections for multiple comparisons. For day 21 in c, and d, f, and g, one-way ANOVA with post-test corrections for multiple comparisons was used. Log-rank tests were used in analysis of disease incidence in c. For all tests, p values ≤ 0.05 were considered significant (*p<.05, **p<.01, ****p<.0001; ns = not significant). In b, all asterisks indicate statistical significance for comparisons of either MOG-QD treatment group against untreated mice. # indicates significance of p<0.05 for comparisons of MOG-QD (17:1) against MOG-QD (52:1).
2.7 MOG-QD expand regulatory T cells without increasing inflammatory TH1 cells
We hypothesized that efficacy in controlling disease might result from MOG-QD driven expansion of TREGs (CD4+/CD25+/Foxp3+). Thus mice with EAE were treated with MOG-QDs (17:1 or 52:1) on day 2 as in Figure 5a, then iLNs were harvested and analyzed by flow cytometry on day 9. As hypothesized, MOG-QDs significantly expanded the number of TREGS at the higher density, and caused an upward trend at the lower density (Figure 5e,f). Similar results were measured in the frequency of TREGS (Figure S12). Since uncontrolled delivery of myelin peptides during autoimmunity could exacerbate disease,[5] we sought to confirm MOG-QDs do not expand inflammatory TH1 cells (i.e., Tbet+ among CD4+ T cells). These studies revealed no significant increases in TH1 populations between treated and untreated groups (Figure 5g).
2.8 Tolerance and efficacy during EAE correlates inversely with peptide display density
To directly investigate the role of ligand density, we next prepared MOG-QDs at three ligand densities, then injected groups of mice with EAE using constant masses of MOG, but displaying these doses on different numbers of QDs (i.e., fixed dose of MOG, varying number of QDs) (Figure 6a). Intriguingly, over the course of the study, mice receiving a 25:1 MOG:QD dose (i.e., the fewest number of peptides per QD) exhibited the lowest clinical scores, with scores increasingly in order for 52:1 and 65:1 (i.e., the greatest number of peptides per QD) (Figure 6b). These differences were statistically significant at several points, including the peak of disease (day 17). At this time, mice receiving 25:1 MOG:QDs exhibited a mean score 3-fold lower than mice treated with 65:1 MOG:QDs (Figure 6c). Additionally, mice injected with the lowest ligand density of MOG:QDs showed both delayed disease onset and lower incidence compared with all other groups (Figure 6d). An additional indicator of EAE severity is body weight loss. For this metric, a similar trend to that measured for clinical score was observed, where mice treated with 25:1 MOG:QDs maintained the highest percentage of original body weight, and weight loss increased as the number of MOG peptides per QD increased (Figure 6e).
Figure 6.

Tolerance is dependent on MOG ligand density. Mice were induced with EAE on days 0 and 1, followed by treatment with MOG-QDs of varying QD dose on day 2 (a). Disease progression was again monitored by clinical score (b) and peak disease was compared at day 17 (c). Disease incidence was assessed by onset of symptoms (d) and body weight loss was tracked through day 21 (e). Data in b-e represent the mean (N=5) ± s.e.m. Statistical significance for c was determined by one-way ANOVA with post-test corrections for multiple comparisons and log-rank tests were used in d. For all tests, p values ≤ 0.05 were considered significant (*p<.05, **p<.01).
Because most therapies for MS and other autoimmune diseases are broadly suppressive, there is intense research to generating more selective therapies. The immune system offers this potential, and the control biomaterials could provide toward this goal has spurred great interest at this interface. However, fundamental questions, such as what delivery kinetics, combinations and densities of cargos, and tissues to target are just arising.[8] Thus, in addition to the specific innovation using QDs to tune tolerance – and the potential for future theranostic applications, our work adds a fundamental discovery to the field: that a higher number of tolerogenic particles displaying lower levels of self-peptide is more effective for inducing tolerance than fewer particles displaying high densities of peptide. This finding provides guidance for future strategies that a large number of low-density/dose events may lead to more effective control of autoimmune or inflammatory reactions then larger doses distributed among fewer particles or carriers.
3. Conclusions
Our studies show for the first time that QDs can be harnessed to promote tolerance by designing peptide-QD displaying self-antigen at tunable densities. Importantly, the extent of efficacy is directly linked to the density of peptide ligands on the QD, with lower levels of self-antigen displayed on a larger number of QDs driving the most efficient tolerance. Since lymph nodes, spleens, and other immune tissues integrate local signals across the body, this finding may reflect a mechanism achieved by providing a large number of therapeutic events, even if each QD only displays a low level of the self-antigen. These outcomes, along with the antigen-specific expansion of myelin-reactive T cells in co-culture studies – and the lack of efficacy using CTRL-QDs - suggest that the tolerance generated by MOG-QDs is myelin-specific. Since we observed strong local expansion of TREGs in LNs, a possible mechanism for tolerance is the migration of these cells to the CNS to control inflammatory TH17 and TH1 cells.[2, 5, 40] Mechanistic studies will need to confirm the myelin-specific nature of tolerance, and test if this approach can be used to reverse paralysis once disease is already established. However, our current findings support QDs as a powerful experimental tool to track vaccine-like autoimmune therapies through the lymphatic system while simultaneously promoting tolerance with tunable control. Such features could enable approaches that provide new insight into how immune cells migrate or are sequestered to tolerogenic agents, and to precisely tune the level of tolerance needed for a particular autoimmune disease while minimizing the dose or level of immune modulation needed for efficacy.
4. Experimental Section
Materials
MOG modified for attachment to QDs (HHHHHSAAAAAGMEVGWYRSPFSRVVHLYRNGK, denoted “MOG” in the the text) and a similarly-modified control peptide from ovalbumin (HHHHHSAAAAAGISQAVHAAHAEINEAGR; denoted “CTRL” in text) were synthesized by Genscript (Piscataway, NJ). Molecular Biology Grade Water and RPMI-1640 media were purchased from Lonza (Allendale, NJ). Fetal bovine serum (FBS) was supplied by Corning (Tewksbury, MA). 2-Mercaptoethanol and Amicon Ultra Centrifugal Filters were purchased from Sigma Aldrich (St. Louis, MO). HEPES, non-essential amino acids, and 40 µm cell strainers were purchased from VWR (Radnor, PA). OPC oligonucleotide purification cartridges, L-Glutamine, Penicillin-Streptomycin, and 4',6-diamidino-2-phenylindole (DAPI) were purchased from Thermo Fisher Scientific (Grand Island, NY). Spleen Dissociation Medium and CD4 negative selection kits were from STEMCELL Technologies (Vancouver, British Columbia, Canada). CD11c microbeads were purchased from Miltenyi Biotec (Cambridge, MA). CpG adjuvant (5’-TCC ATG ACG TTC CTG ACG TT-3’) was synthesized by IDT (Coralville, IA). Fluorescent antibody conjugates for flow cytometry were purchased from BD (San Jose, CA). eFlour 670 prolfieration dye was supplied by affymetrix eBioscience (San Diego, CA). FITC CD45R/B220 (BD), CD3e (abcam, Cambridge, MA), DL405 IgG (Jackson Immunoresearch, West Grove, PA), F4/80 (BD), Biotinylated MARCO (R&D Systems, Minneapolis, MN), and Streptavadin Alexa 488 (Jackson Immunoresearch) were used for immunohistochemical staining of iLN sections. EAE induction kits were supplied by Hooke Laboratories (Lawrence, MA).
Cells and animals
All primary cells were harvested from female C57BL/6 mice (4–12 weeks, stock #000664) and male C57BL/6-Tg(Tcra2D2,Tcrb2D2)1Kuch/J (2D2) mice (10–16 weeks, stock #006912) purchased from Jackson Laboratories (Bar Harbor, ME). 2D2 mice display transgenic CD4+ T cell receptors specific for MOG residues 35–55. Mice induced with EAE were female C57BL/6 mice (10–12 weeks, stock #000664). All animals were cared for in compliance with Federal, State, and local guidelines, and using protocols reviewed and approved by the University of Maryland's Institutional Animal Care and Use Committee (IACUC).
Characterization of quantum dots and peptide-QD assemblies
The 625 nm emitting QDs and their cap-exchange with CL4 ligands have been previously described.[41] Peptides were desalted prior to QD conjugation as described.[42] MOG peptide has a net charge of +4 at pH 7. MOG and CTRL were assembled on QDs by mixing solutions of desalted peptide in molecular biology grade water with QDs at defined molar ratios. TEM, gel electrophoresis, and DLS analysis were performed as described.[41]
Quantification of peptide loading on QDs
We utilized an established fluorescence method to to verify peptide binding to QDs by the same mechanism.[43] A Cy3-labeled peptide terminating in a (His)6 motif was self-assembled to the QDs across a range of ratios including 0, 10, 25, 50, 75, 100, 125, and 150 peptides/QD in 100 µL of PBS. Equal amounts of free dye-labeled peptide without QD were added to the same volume of PBS as controls. Following self-assembly, all samples were loaded into 0.5 mL Amicon Ultra Centrifugal Filters with a 50,000 NMWL and centrifuged at 14,000×g for 10 min. The amount of free dye-labeled peptide from the QD samples was then compared to that from the unbound dye-labeled peptide only control samples using UV absorbance.
Simulation of MOG-QD peptide assembly
The MOG-QD peptide assembly was simulated in silico in a manner similar to that we described previously for other peptides.[31, 32, 44–46] These structures and calculations were prepared using Chimera and Chem-3D Ultra 11.0. Energy was minimized using the MM2 module and the most probable conformation when attached to the QD were selected. A hard sphere was used to represent the quantum dot (QD) core/shell structure, which was covered with the surface-functionalizing ligand at an extension estimated from dynamic light scattering (DLS) measurements and energy minimization. The core MOG peptide structure was taken directly from the crystallographic structure 1PKO in the Protein Data Bank.[47] The remaining (His)5S(Ala)5G N-terminal portion was docked to the QD surface via the (His)5 sequence with the (Ala)5G portion in an energy-minimized alpha helical conformation. Probabilities for peptide ligand density distributions were calculated using a Poisson distribution as previously described and confirmed experimentally.[48]
Dendritic cell isolation and flow cytometry
CD11c+ dendritic cells (DCs) were isolated from the spleens of female C57BL/6 mice through positive selection with Spleen Dissociation Media (STEMCELL) and CD11c Microbeads (Miltenyi). DC purities after isolation varied slightly across experiments, but were 90% or greater. DCs were plated in a 96 well plate at 100,000 cells per well and cultured in RPMI 1640 media supplemented with 10% FBS, 2 mM L-glutamine, 1× non-essential amino acids, 10 mM HEPES buffer, 1× penicillin and streptomycin, and 55 µM β-mercaptoethanol at 37°C and 5% CO2. For uptake studies, DCs were incubated with 150:1 MOG-QDs for 2 hours, stained with DAPI, and examined by flow cytometry (BD Cantoll, San Jose, CA) for presence of MOG-QDs and viability. Viability was determined by cells staining negative for DAPI. Data were analyzed with FlowJo v.10 (TreeStar, Ashland, OR).
DC Activation, T cell co-culture, and flow cytometry
Isolated DCs were treated with CpG to induce the expression of costimulatory factors and either MOG or CTRL in soluble or QD-conjugated form and cultured for 24 hours. DC activation was then analyzed by staining for CD40, CD80, and CD85 markers. Stained cells were analyzed by flow cytometry. CD4+ T cells were then isolated from the spleens of 2D2 mice via a negative selection kit (STEMCELL) and labelled with eFlour 670 proliferation dye. 300,000 T cells were then added to the wells containing treated DCs. After 72 hours, cell viability was assessed by DAPI staining and T cell proliferation was analyzed by a decrease in fluorescent signal as dye is diluted in daughter cells during successive generations. Cells in all in vitro studies were treated with a dose of QDs ranging from 0.44 to 40 picomoles and a dose of MOG ranging from 0.25 to 10 µg.
Analysis of QD drainage in mice
Mice were injected with MOG-QDs and 24 hours later, the draining and non-draining iLNs were harvested for analysis. LNs were passed through a 40 µm strainer to create a single cell suspension. Cells were then stained with DAPI and analyzed by flow cytometry for viability (i.e., DAPI−) and presence of fluorescent MOG-QDs. Additional iLNs were frozen, sectioned, and fixed for staining. In one analysis, sections were stained for T cells (CD3e) and B cells (B220). In an additional study, sections were stained with antibodies for macrophages (F4/80) and the scavenger receptor MARCO. iLN sections were visualized by fluorescent microscopy (Olympus IX-83) for presence of MOG-QDs, T cells, B cells, macrophages, and MARCO. ImageJ was used for image processing and analaysis. All images in a particular study were analyzyed in an identical manner that was applied to the entire image area.
EAE induction and monitoring
C57BL/6 mice (female, 10–12 weeks) were induced with EAE following a defined protocol from Hooke Labs. Briefly, mice were injected s.c. with an emulsion of MOG and complete Freund’s adjuvant (CFA) at the upper and lower back on day 0. Pertussis toxin was also administered intraperitoneally 2 and 24 hours after MOG/CFA injection. Beginning at day 7, mice were weighed to detect changes from day 0 body weight (a symptom of disease) and scored for disease severity with respect to paralysis. A standard clinical scoring rubric was used: 0 – no symptoms, 1 – limp tail, 2 – weakness of hind legs, 3 – hind limb paralysis, 4 – hind limb paralysis and partial front limb paralysis, 5 – moribund.[6, 7, 15] Disease incidence was defined as the first day a mouse displayed symptoms of paralysis.
MOG-QD treatment
Mice induced with EAE were randomly divided into groups of 8–10 mice each. A control group was left untreated in each experiment. In one experiment, additional groups were treated by s.c. injection at the tailbase with 0.2 nanomoles QDs, 70 µg MOG, 70 µg CTRL peptide on 0.2 nanomoles QDs (100:1), or 70 µg MOG peptide on 0.2 nanomoles QDs (100:1). Similar experiments contained two treatment groups: 14.3 µg MOG on 0.4 nanomoles QDs (17:1) or 73 µg MOG on 0.2 nanomoles QDs (52:1). The final experiment design contained three treatment groups: 70 µg MOG on 0.5 nanomoles QDs (25:1), 70 µg MOG on 0.4 nanomoles QDs (52:1), or 70 µg MOG on 0.3 nanomoles QDs (65:1).
EAE T cell readout
Mice were induced with EAE and treated with MOG-QDs as described above. On day 9, the iLNs were removed for analysis by flow cytometry. iLNs were mashed through a 40 µm strainer to create a single cell suspension and stained for T cell surface markers (CD4+, CD25+) and transcription factors (Tbet+, Foxp3+). Tbet and Foxp3 are common transcription factors used to identify TH1 and TREG, respectively. Cells were examined with flow cytometry and data were again analyzed with FlowJo v.10.
Statistics
One-way ANOVA with a Tukey post-test was used to compare three or more groups for in vitro studies and overall disease metrics from in vivo studies. For in vivo studies, two-way ANOVA was used to compare three groups monitored over time, with post-test corrections for multiple comparisons. Log-rank tests were used in analysis of disease incidence. For all tests, p values ≤ 0.05 were considered significant. For all figures, *p<.05, **p<.01, ***p<.001, ****p<0.0001, #p<.05.
Supplementary Material
Acknowledgments
This work was supported in part by the National Multiple Sclerosis Society Award # RG-1501-02968 and NSF CAREER Award # 1351688. K.LH. is a SMART Graduate Fellow funded by ASD/R&E, Defense – Wide/PE0601120D8Z National Defense Education Program (NDEP)/BA-1, Basic Research. L.H.T. is a NSF Graduate Fellow (# DGE1322106). J.I.A. is a trainee on NIH Grant # T32 AI089621 and a Graduate Fellow of the American Association of Pharmaceutical Scientists. C.M.J. is a Damon Runyon-Rachleff Innovator supported by the Damon Runyon Foundation (# DRR3415), and a Young Investigator of the Alliance for Cancer Gene Therapy (# 15051543) and the Melanoma Research Alliance (# 348963). I.L.M. acknowledges NRL base funding and the NRL Nanosciences Institute.
Footnotes
Supporting Information is available from the Wiley Online Library.
Contributor Information
Krystina L. Hess, Fischell Department of Bioengineering, University of Maryland, 8228 Paint Branch Drive, College Park, MD 20742, USA
Eunkeu Oh, Optical Sciences Division, Code 5600, U.S. Naval Research Laboratory, 4555 Overlook Ave, SW, Washington DC 20375, USA; Sotera Defense Solutions, Inc., Columbia, MD 21046, USA.
Lisa H. Tostanoski, Fischell Department of Bioengineering, University of Maryland, 8228 Paint Branch Drive, College Park, MD 20742, USA
James I. Andorko, Fischell Department of Bioengineering, University of Maryland, 8228 Paint Branch Drive, College Park, MD 20742, USA
Kimihiro Susumu, Optical Sciences Division, Code 5600, U.S. Naval Research Laboratory, 4555 Overlook Ave, SW, Washington DC 20375, USA; Sotera Defense Solutions, Inc., Columbia, MD 21046, USA.
Dr. Jeffrey R. Deschamps, Center for Bio/Molecular Science and Engineering Code 6900 U.S. Naval Research Laboratory, 4555 Overlook Ave SW, Washington DC 20375, USA
Dr. Igor L. Medintz, Center for Bio/Molecular Science and Engineering Code 6900 U.S. Naval Research Laboratory, 4555 Overlook Ave SW, Washington DC 20375, USA
Prof. Christopher M. Jewell, Fischell Department of Bioengineering, University of Maryland, 8228 Paint Branch Drive, College Park, MD 20742, USA Department of Microbiology and Immunology, University of Maryland Medical School, 685 West Baltimore Street, HSF-I Suite 380, Baltimore, MD, 21201, USA; Marlene and Stewart Greenebaum Cancer Center, 22 South Greene Street, Baltimore, MD 21201, USA; United States Department of Veterans Affairs, 10. N Green Street, Baltimore, Maryland 21201, United States.
References
- 1.McFarland HF, Martin R. Nat. Immunol. 2007;8:913. doi: 10.1038/ni1507. [DOI] [PubMed] [Google Scholar]
- 2.Comabella M, Khoury SJ. Clin. Immunol. 2012;142:2. doi: 10.1016/j.clim.2011.03.004. [DOI] [PubMed] [Google Scholar]
- 3.Bluestone JA, Bour-Jordan H, Cheng M, Anderson M. J. Clin. Invest. 2015;125:2250. doi: 10.1172/JCI78089. [DOI] [PMC free article] [PubMed] [Google Scholar]
- 4.Piehl F. J. Intern. Med. 2014;275:364. doi: 10.1111/joim.12204. [DOI] [PubMed] [Google Scholar]
- 5.Lutterotti A, Martin R. Expert Opin. Investig. Drugs. 2014;23:9. doi: 10.1517/13543784.2014.844788. [DOI] [PubMed] [Google Scholar]
- 6.Gammon JM, Tostanoski LH, Adapa AR, Chiu Y-C, Jewell CM. J. Controlled Release. 2015;210:169. doi: 10.1016/j.jconrel.2015.05.277. [DOI] [PubMed] [Google Scholar]
- 7.Clemente-Casares X, Blanco J, Ambalavanan P, Yamanouchi J, Singha S, Fandos C, Tsai S, Wang J, Garabatos N, Izquierdo C, Agrawal S, Keough MB, Yong VW, James E, Moore A, Yang Y, Stratmann T, Serra P, Santamaria P. Nature. 2016;530:434. doi: 10.1038/nature16962. [DOI] [PubMed] [Google Scholar]
- 8.Tostanoski LH, Gosselin EA, Jewell CM. Discov. Med. 2016;21:403. [PubMed] [Google Scholar]
- 9.Gratz IK, Rosenblum MD, Maurano MM, Paw JS, Truong HA, Marshak-Rothstein A, Abbas AK. J. Immunol. 2014;192:1351. doi: 10.4049/jimmunol.1301777. [DOI] [PMC free article] [PubMed] [Google Scholar]
- 10.Tostanoski LH, Chiu YC, Andorko JI, Guo M, Zeng X, Zhang P, Royal W, 3rd, Jewell CM. ACS Nano. 2016 doi: 10.1021/acsnano.6b04001. [DOI] [PMC free article] [PubMed] [Google Scholar]
- 11.Hess KL, Andorko JI, Tostanoski LH, Jewell CM. Biomaterials. 2016;118:51. doi: 10.1016/j.biomaterials.2016.11.052. [DOI] [PMC free article] [PubMed] [Google Scholar]
- 12.Zhang P, Chiu YC, Tostanoski LH, Jewell CM. ACS Nano. 2015;9:6465. doi: 10.1021/acsnano.5b02153. [DOI] [PubMed] [Google Scholar]
- 13.Swartz MA, Hubbell JA, Reddy ST. Semin. Immunol. 2008;20:147. doi: 10.1016/j.smim.2007.11.007. [DOI] [PubMed] [Google Scholar]
- 14.Reddy ST, van der Vlies AJ, Simeoni E, Angeli V, Randolph GJ, O'Neil CP, Lee LK, Swartz MA, Hubbell JA. Nat. Biotechnol. 2007;25:1159. doi: 10.1038/nbt1332. [DOI] [PubMed] [Google Scholar]
- 15.Getts DR, Martin AJ, McCarthy DP, Terry RL, Hunter ZN, Yap WT, Getts MT, Pleiss M, Luo X, King NJ, Shea LD, Miller SD. Nat. Biotechnol. 2012;30:1217. doi: 10.1038/nbt.2434. [DOI] [PMC free article] [PubMed] [Google Scholar]
- 16.Getts DR, Terry RL, Getts MT, Deffrasnes C, Muller M, van Vreden C, Ashhurst TM, Chami B, McCarthy D, Wu H, Ma J, Martin A, Shae LD, Witting P, Kansas GS, Kuhn J, Hafezi W, Campbell IL, Reilly D, Say J, Brown L, White MY, Cordwell SJ, Chadban SJ, Thorp EB, Bao S, Miller SD, King NJ. Sci. Transl. Med. 2014;6:219ra7. doi: 10.1126/scitranslmed.3007563. [DOI] [PMC free article] [PubMed] [Google Scholar]
- 17.Kontos S, Kourtis IC, Dane KY, Hubbell JA. Proc. Natl. Acad. Sci. U.S.A. 2013;110:E60. doi: 10.1073/pnas.1216353110. [DOI] [PMC free article] [PubMed] [Google Scholar]
- 18.Tostanoski LH, Chiu YC, Gammon JM, Simon T, Andorko JI, Bromberg JS, Jewell CM. Cell Rep. 2016;16:2940. doi: 10.1016/j.celrep.2016.08.033. [DOI] [PMC free article] [PubMed] [Google Scholar]
- 19.Louveau A, Smirnov I, Keyes TJ, Eccles JD, Rouhani SJ, Peske JD, Derecki NC, Castle D, Mandell JW, Lee KS, Harris TH, Kipnis J. Nature. 2015;523:337. doi: 10.1038/nature14432. [DOI] [PMC free article] [PubMed] [Google Scholar]
- 20.Aspelund A, Antila S, Proulx ST, Karlsen TV, Karaman S, Detmar M, Wiig H, Alitalo K. J. Exp. Med. 2015;212:991. doi: 10.1084/jem.20142290. [DOI] [PMC free article] [PubMed] [Google Scholar]
- 21.Probst CE, Zrazhevskiy P, Bagalkot V, Gao X. Adv. Drug. Deliv. Rev. 2013;65:703. doi: 10.1016/j.addr.2012.09.036. [DOI] [PMC free article] [PubMed] [Google Scholar]
- 22.Algar WR, Susumu K, Delehanty JB, Medintz IL. Anal. Chem. 2011;83:8826. doi: 10.1021/ac201331r. [DOI] [PubMed] [Google Scholar]
- 23.Rosenthal SJ, Chang JC, Kovtun O, McBride JR, Tomlinson ID. Chem. Biol. 2011;18:10. doi: 10.1016/j.chembiol.2010.11.013. [DOI] [PMC free article] [PubMed] [Google Scholar]
- 24.Andrasfalvy BK, Galinanes GL, Huber D, Barbic M, Macklin JJ, Susumu K, Delehanty JB, Huston AL, Makara JK, Medintz IL. Nat. Methods. 2014;11:1237. doi: 10.1038/nmeth.3146. [DOI] [PMC free article] [PubMed] [Google Scholar]
- 25.Blanco-Canosa JB, Wu M, Susumu K, Petryayeva E, Jennings TL, Dawson PE, Algar WR, Medintz IL. Coord. Chem. Rev. 2014;263–264:101. [Google Scholar]
- 26.Boeneman K, Delehanty JB, Blanco-Canosa JB, Susumu K, Stewart MH, Oh E, Huston AL, Dawson G, Ingale S, Walters R, Domowicz M, Deschamps JR, Algar WR, DiMaggio S, Manono J, Spillmann CM, Thompson D, Jennings TL, Dawson PE, Medintz IL. ACS Nano. 2013;7:3778. doi: 10.1021/nn400702r. [DOI] [PMC free article] [PubMed] [Google Scholar]
- 27.Agarwal R, Domowicz MS, Schwartz NB, Henry J, Medintz I, Delehanty JB, Stewart MH, Susumu K, Huston AL, Deschamps JR, Dawson PE, Palomo V, Dawson G. ACS Chem. Neurosci. 2015;6:494. doi: 10.1021/acschemneuro.5b00022. [DOI] [PMC free article] [PubMed] [Google Scholar]
- 28.Hauck TS, Anderson RE, Fischer HC, Newbigging S, Chan WC. Small. 2010;6:138. doi: 10.1002/smll.200900626. [DOI] [PubMed] [Google Scholar]
- 29.Ye L, Yong KT, Liu L, Roy I, Hu R, Zhu J, Cai H, Law WC, Liu J, Wang K, Liu J, Liu Y, Hu Y, Zhang X, Swihart MT, Prasad PN. Nat. Nanotechnol. 2012;7:453. doi: 10.1038/nnano.2012.74. [DOI] [PubMed] [Google Scholar]
- 30.Kim S, Lim YT, Soltesz EG, De Grand AM, Lee J, Nakayama A, Parker JA, Mihaljevic T, Laurence RG, Dor DM, Cohn LH, Bawendi MG, Frangioni JV. Nat. Biotechnol. 2004;22:93. doi: 10.1038/nbt920. [DOI] [PMC free article] [PubMed] [Google Scholar]
- 31.Prasuhn DE, Deschamps JR, Susumu K, Stewart MH, Boeneman K, Blanco-Canosa JB, Dawson PE, Medintz IL. Small. 2010;6:555. doi: 10.1002/smll.200901845. [DOI] [PubMed] [Google Scholar]
- 32.Medintz IL, Clapp AR, Brunel FM, Tiefenbrunn T, Tetsuo Uyeda H, Chang EL, Deschamps JR, Dawson PE, Mattoussi H. Nat. Mater. 2006;5:581. doi: 10.1038/nmat1676. [DOI] [PubMed] [Google Scholar]
- 33.Medintz IL, Konnert JH, Clapp AR, Stanish I, Twigg ME, Mattoussi H, Mauro JM, Deschamps JR. Proc. Natl. Acad. Sci. U.S.A. 2004;101:9612. doi: 10.1073/pnas.0403343101. [DOI] [PMC free article] [PubMed] [Google Scholar]
- 34.Algar WR, Malonoski A, Deschamps JR, Blanco-Canosa JB, Susumu K, Stewart MH, Johnson BJ, Dawson PE, Medintz IL. Nano Lett. 2012;12:3793. doi: 10.1021/nl301727k. [DOI] [PMC free article] [PubMed] [Google Scholar]
- 35.Algar WR, Ancona MG, Malanoski AP, Susumu K, Medintz IL. ACS Nano. 2012;6:11044. doi: 10.1021/nn304736j. [DOI] [PubMed] [Google Scholar]
- 36.Andorko JI, Hess KL, Jewell CM. AAPS J. 2015;17:323. doi: 10.1208/s12248-014-9708-2. [DOI] [PMC free article] [PubMed] [Google Scholar]
- 37.Warren KJ, Iwami D, Harris DG, Bromberg JS, Burrell BE. J. Clin. Invest. 2014;124:2204. doi: 10.1172/JCI73683. [DOI] [PMC free article] [PubMed] [Google Scholar]
- 38.Arredouani MS, Franco F, Imrich A, Fedulov A, Lu X, Perkins D, Soininen R, Tryggvason K, Shapiro SD, Kobzik L. J. Immunol. 2007;178:5912. doi: 10.4049/jimmunol.178.9.5912. [DOI] [PubMed] [Google Scholar]
- 39.Korn T, Reddy J, Gao W, Bettelli E, Awasthi A, Petersen TR, Backstrom BT, Sobel RA, Wucherpfennig KW, Strom TB, Oukka M, Kuchroo VK. Nat. Med. 2007;13:423. doi: 10.1038/nm1564. [DOI] [PMC free article] [PubMed] [Google Scholar]
- 40.Bailey SL, Schreiner B, McMahon EJ, Miller SD. Nat Immunol. 2007;8:172. doi: 10.1038/ni1430. [DOI] [PubMed] [Google Scholar]
- 41.Susumu K, Oh E, Delehanty JB, Blanco-Canosa JB, Johnson BJ, Jain V, Hervey WJ, Algar WR, Boeneman K, Dawson PE, Medintz IL. J. Am. Chem. Soc. 2011;133:9480. doi: 10.1021/ja201919s. [DOI] [PubMed] [Google Scholar]
- 42.Sapsford KE, Farrell D, Sun S, Rasooly A, Mattoussi H, Medintz IL. Sensors and Actuators B: Chemical. 2009;139:13. [Google Scholar]
- 43.Medintz IL, Clapp AR, Mattoussi H, Goldman ER, Fisher B, Mauro JM. Nat. Mater. 2003;2:630. doi: 10.1038/nmat961. [DOI] [PubMed] [Google Scholar]
- 44.Boeneman K, Deschamps JR, Buckhout-White S, Prasuhn DE, Blanco-Canosa JB, Dawson PE, Stewart MH, Susumu K, Goldman ER, Ancona M, Medintz IL. ACS Nano. 2010;4:7253. doi: 10.1021/nn1021346. [DOI] [PMC free article] [PubMed] [Google Scholar]
- 45.Medintz IL, Pons T, Susumu K, Boeneman K, Dennis A, Farrell D, Deschamps JR, Melinger JS, Bao G, Mattoussi H. J. Phys. Chem. C Nanomater. Interfaces. 2009;113:18552. doi: 10.1021/jp9060329. [DOI] [PMC free article] [PubMed] [Google Scholar]
- 46.Medintz IL, Sapsford KE, Clapp AR, Pons T, Higashiya S, Welch JT, Mattoussi H. J. Phys. Chem. B. 2006;110:10683. doi: 10.1021/jp060611z. [DOI] [PubMed] [Google Scholar]
- 47.Breithaupt C, Schubart A, Zander H, Skerra A, Huber R, Linington C, Jacob U. Proc. Natl. Acad. Sci. U.S.A. 2003;100:9446. doi: 10.1073/pnas.1133443100. [DOI] [PMC free article] [PubMed] [Google Scholar]
- 48.Pons T, Medintz IL, Wang X, English DS, Mattoussi H. J. Am. Chem. Soc. 2006;128:15324. doi: 10.1021/ja0657253. [DOI] [PubMed] [Google Scholar]
Associated Data
This section collects any data citations, data availability statements, or supplementary materials included in this article.