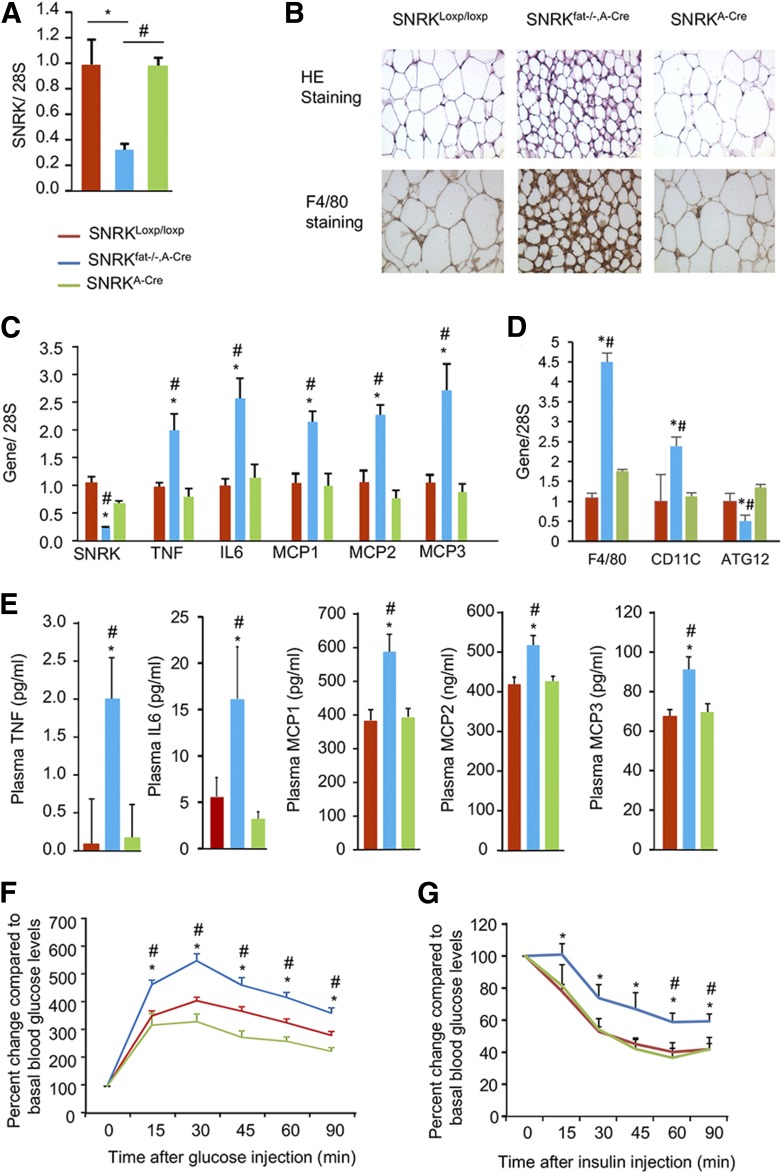
Figure 4.
Characterization of adipose tissue–specific SNRK knockout (SNRKfat−/−, A-Cre) and littermate control (SNRKloxp/loxp, SNRKA-Cre) mice. A: SNRK gene expression in WAT of SNRKloxp/loxp, SNRKfat−/−, A-Cre, and SNRKA-Cre mice (n = 3 or 4 mice/per group). B: Histology of the subcutaneous WAT depot stained with hematoxylin-eosin (HE; upper panels) or F4/80 antibody (lower panels). C: Expression of cytokine and chemokine genes in primary adipocytes isolated from SNRKfat−/−, A-Cre and littermate control mice (n = 7–12 mice/group). D: Expression of F4/80, CD11c, and ATG12 genes in gonadal WAT from SNRKfat−/−, A-Cre and littermate control mice (n = 4 mice/group). E: Plasma cytokine and chemokine levels in SNRKfat−/−, A-Cre and littermate control mice (n = 7–12 mice/group). F: Glucose tolerance test results from SNRKfat−/−, A-Cre mice and littermate control mice fed a chow diet (n = 7–12 mice/group). G: Insulin tolerance test results from SNRKfat−/−, A-Cre mice (n = 8 mice/group) and littermate control mice fed (n = 5–9 mice/group) fed an HFD for 20 weeks. *P < 0.05, SNRKfat−/−, A-Cre vs. SNRKloxp/loxp; #P < 0.05, SNRKfat−/−, A-Cre vs. SNRKA-Cre. IL, interleukin.

