

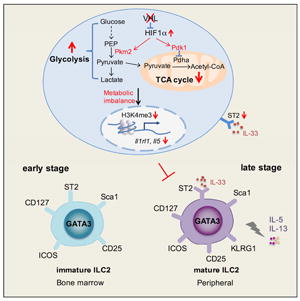
SUMMARY
Group 2 innate lymphoid cells (ILC2s) are a specialized subset of lymphoid effector cells that are critically involved in allergic responses; however, the mechanisms of their regulation remain unclear. We report that conditional deletion of the E3 ubiquitin ligase VHL in innate lymphoid progenitors minimally affected early-stage bone marrow ILC2s but caused a selective and intrinsic decrease in mature ILC2 numbers in peripheral non-lymphoid tissues, resulting in reduced type 2 immune responses. VHL deficiency caused the accumulation of hypoxia-inducible factor 1α (HIF1α) and attenuated interleukin-33 (IL-33) receptor ST2 expression, which was rectified by HIF1α ablation or inhibition. HIF1α-driven expression of the glycolytic enzyme pyruvate kinase M2 downmodulated ST2 expression via epigenetic modification and inhibited IL-33-induced ILC2 development. Our study indicates that the VHL-HIF-glycolysis axis is essential for the late-stage maturation and function of ILC2s via targeting IL-33-ST2 pathway.
Graphical Abstract
INTRODUCTION
Innate lymphoid cells (ILCs) are specialized subsets of lymphoid effector cells lacking classical antigen receptors, which are mainly found at barrier surfaces such as the lungs, intestine, skin, as well as adipose tissue and some mucosal-associated tissues(Klose and Artis, 2016; Spits et al., 2013). ILCs play important roles in immune defense, inflammation, metabolic homeostasis, and tissue remodeling(Klose and Artis, 2016). Recent studies have revealed a delicate development process for ILC lineage commitment; ILCs originate from common lymphoid progenitors (CLPs) in fetal liver and adult bone marrow(Cherrier et al., 2012; Wong et al., 2012), which firstly develop into α-lymphoid precursors (αLPs) upon up-regulation of transcription factors ID2, NFIL3 and TOX(Klose et al., 2014; Seehus et al., 2015; Seillet et al., 2014). αLPs then differentiate into either natural killer cell progenitors (NKPs) upon expression of transcription factors T-bet and EOMES(Daussy et al., 2014), or common helper innate lymphoid progenitors (CHILPs) upon expression of transcription factors TCF1 and GATA3(Yagi et al., 2014; Yang et al., 2015). CHILPs are a heterogeneous population that comprises ILC precursors (ILCPs) and lymphoid tissue-inducer (LTi) precursors. Lineage-tracing approaches and single-cell transcriptional analysis have defined that the transcription factor PLZF is the decisive regulator for the bifurcation of ILCs and LTi cell lineages(Constantinides et al., 2014; Ishizuka et al., 2016).
ILCs can be categorized into three subsets on the basis of transcriptional and functional similarities paralleled to T helper (Th) cell subsets(Spits et al., 2013; Zook et al., 2016). Group 1 ILCs express T-bet, and comprise conventional NK cells (cNKs) and interferon-γ (IFN-γ) producing ILC1s. Group 2 ILCs express GATA3, RORα and BCL11b, include several ILC2 populations found in different organs, and produce type 2 cytokines such as interleukin-4 (IL-4), IL-5, IL-9, IL-13 and epidermal growth factor amphiregulin (AREG). Group 3 ILCs express RORγt, which include LTi cells and IL-17 and/or IL-22 producing ILC3s. Among those ILCs, ILC2s can be activated by epithelium-derived cytokines such as IL-33, IL-25 and thymic stromal lymphopoietin (TSLP), and play important roles in anti-helminth infection and inflammatory responses such as allergic diseases(Fan and Rudensky, 2016).
The von Hippel–Lindau (VHL) disease is an inherited tumorigenic disease, which is generally found in kidney, central nervous system, retina and pancreas. The VHL protein is the core of an E3 ubiquitin ligase complex, which contains elongin C, elongin B, cullin2 and RING-box protein RBX1(Gossage et al., 2015). Hypoxia-inducible factor α-subunit (HIFα) is the most important substrate for VHL E3 complex. Under normoxia conditions, HIFα is hydroxylated by oxygen-dependent prolyl hydroxylases (PHDs), then recognized by VHL, and targeted for poly-ubiquitylation and proteasomal degradation. Under hypoxia conditions, HIFα cannot be hydroxylated; the stabilized HIFα dimerizes with HIF1β, and then translocates into the nucleus to initiate the transcriptional regulation of diverse target genes by binding to hypoxia-response elements (HREs)(Schofield and Ratcliffe, 2004).
Previous studies have shown that HIF transcription factors play important roles in controlling immune cell metabolism, lymphocyte differentiation, and immune responses (Palazon et al., 2014). Thymocyte-specific deletion of Vhl results in a severe defect in lymphocyte development due to increased cell death mediated by HIF1α(Biju et al., 2004). HIF1α balances T cell fate determination by promoting Th17 generation while impairing differentiation towards T regulatory (Treg) cells(Dang et al., 2011; Shi et al., 2011). Loss of VHL enhances HIF1α-mediated CD8+ T cell glycolysis and facilitates the effector responses to persistent viral infection(Doedens et al., 2013). Our recent work has revealed that VHL is a key regulator in maintaining the stability and function of Treg cells via HIF1α(Lee et al., 2015). However, whether VHL-HIF pathway is involved in the regulation of ILCs remains unknown. To address this issue, we generated VHL conditional knockout mice to selectively delete VHL expression in ILCPs and demonstrated that VHL plays a pivotal and selective role in the development and function of ILC2s through the HIF1α pathway.
RESULTS
Deletion of Vhl results in impaired ILC2 development
ILCs develop from CLPs through a CHILP stage, which contain a population of ILCPs expressing high level of PLZF(Constantinides et al., 2014; Ishizuka et al., 2016; Klose et al., 2014). We first assessed the expression of Vhl and PLZF-encoding Zbtb16 mRNA in hematopoietic progenitors and ILC2s in the bone marrow, as well as mature ILCs in the lungs and intestine by quantitative real-time PCR. Vhl was ubiquitously expressed in these cells, whereas Zbtb16 was distinctively highly expressed in CHILPs (Figure S1A). A previous lineage-tracing study has revealed that almost all ILC2s are traced by PLZF expression in the lineage commitment process, whereas ILC1s and ILC3s are labeled to a lesser extent(Constantinides et al., 2014). To understand whether VHL is involved in the development and function of ILCs, we crossed Vhlfl/fl mice with Zbtb16-cre mice, and analyzed the ILC populations in different organs by gating with various cell surface markers including the lineage markers for T, B, NK and myeloid cells, and commonly used markers including CD90.2, CD127, Sca1, ST2, KLRG1 and ICOS. Transcriptional analysis displayed defective expression of Vhl in bone marrow, lung, and intestinal ILC2s, but not in myeloid cells and ILC1s and ILC3s in Vhlfl/fl Zbtb16-cre mice (Figure S1B-S1D). As most ILC2s (~95%) in bone marrow do not express KLRG1, they are generally recognized as ILC2 precursors (ILC2Ps) or immature ILC2s (Hoyler et al., 2012; Yang et al., 2013). We found that Vhlfl/fl Zbtb16-cre mice had normal numbers of ILC2s in the bone marrow compared with their wild-type counterparts (Figure 1A). However, further detailed flow cytometric analysis revealed different profiles of ILC2-specific surface markers, with lower expression of Sca1, ICOS and Il17Rβ, and higher expression of CD44 and CD25 on bone marrow ILC2s from Vhlfl/fl Zbtb16-cre mice than those from wild-type mice (Figure S1E). We found a decrease in both frequencies and numbers of ILC2s in multiple peripheral non-lymphoid tissues, including the lungs, small and large intestine, and epididymal white adipose tissue (EWAT) (Figure 1A and 1B). However, other ILC populations were not affected, including ILC1s, ILC3s and LTi cells in the intestine, except for a decrease of ILC1s in the large intestine (Figure 1C and 1D). Although NKT cell frequencies and numbers decreased significantly in the liver of Vhlfl/fl Zbtb16-cre mice, they were present at normal frequencies and numbers in the thymus and lungs compared to control mice, together with normal frequencies of lung T and B cells (Figure S1F-H). Together, these data indicated VHL as a selective and potent regulator for the development of mature ILC2s.
Figure 1. VHL is required for ILC2 development.
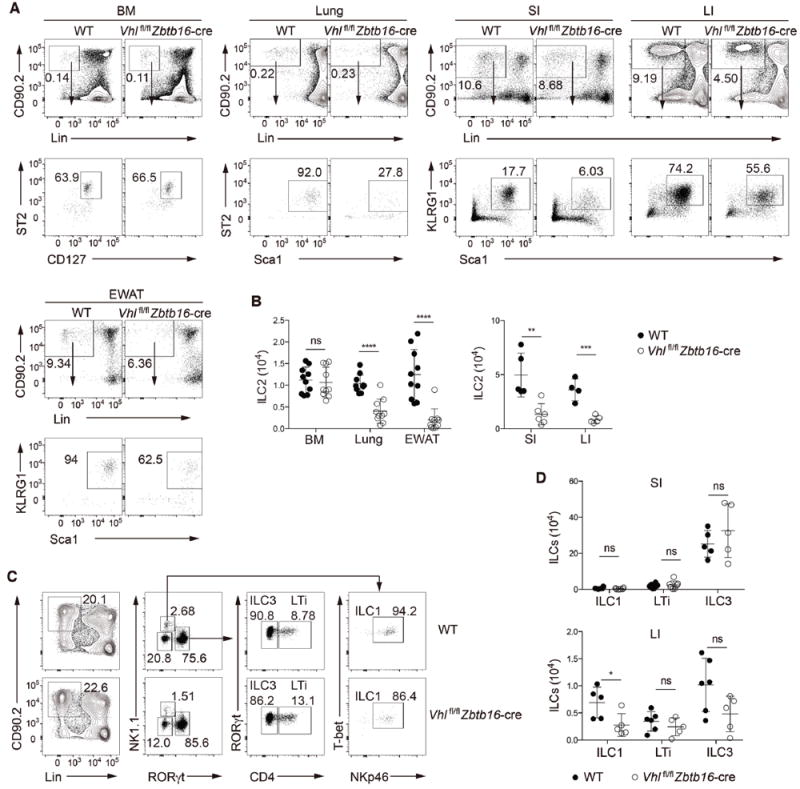
(A) Gating strategy and flow cytometric analysis of ILC2s from bone marrow (BM) and peripheral non-lymphoid tissues of wild-type (WT) and Vhlfl/fl Zbtb16-cre mice. BM ILC2s were identified as CD45+Lin−CD90.2+CD127+ST2+; lung ILC2s as CD45+Lin−CD90.2+Sca1hiST2+; and ILC2s from lamina propria of small intestine (SI) and large intestine (LI) and from epididymal white adipose tissue (EWAT) as CD45+Lin−CD90.2+Sca1hiKLRG1+. Lineage-negative gating (Lin) includes markers for CD3, CD5, CD4, CD8, TCRβ, TCRgγδ, NK1.1, CD11b, B220, TER119, Gr-1 and CD11c. Numbers indicate the frequency of flow cytometric events, arrows from outlined areas at top indicate gated cells analyzed below.
(B) Total numbers of ILC2s in the BM, lungs, EWAT, SI and LI of WT and Vhlfl/fl Zbtb16-cre mice (n = 4-10 per group).
(C) Gating strategy and flow cytometric analysis of different ILC subsets in LPLs from small intestine of WT and Vhlfl/fl Zbtb16-cre mice. ILC1s were identified as CD45+Lin−CD90.2+RORγt−NK1.1+T-bet+NKp46+, ILC3s as CD45+Lin−CD90.2+RORγt+CD4−, and LTi cells as CD45+Lin−CD90.2+RORγt+CD4+. Lin includes markers for CD3, CD5, CD8, TCRβ, TCRγδ, CD11b, B220, TER119, Gr-1 and CD11c. Numbers indicate the frequency of flow cytometric events, arrows from outlined areas at left indicate gated cells analyzed at right.
(D) Total numbers of ILC1s, LTi cells, and ILC3s from the SI (top) and LI (bottom) of WT and Vhlfl/fl Zbtb16-cre mice (n = 4-6 per group).
Each symbol (B,D) represents an individual mouse. Data are represented as mean ± SD. ns, not significant; *P < 0.05, **P < 0.01, ***P < 0.001, and ****P < 0.0001 (two-tailed unpaired t-test). Data are pooled from or representative of two to four independent experiments. See also Figure S1.
ILC2-mediated immune responses in Vhlfl/fl Zbtb16 mice are compromised
As VHL appeared to be most strictly required for ILC2 generation among ILC subsets, we focused on exploring the role of VHL in the development and function of ILC2s by using a papain-induced lung inflammation model. Upon intranasal administration of papain, the total numbers of ILC2s, and the cell surface expression of ST2 and KLRG1 in lung ILC2s were reduced in Vhlfl/fl Zbtb16-cre mice compared with the control mice (Figure 2A-2D). The eosinophil infiltration in the bronchoalveolar lavage fluid (BALF) and in the lungs were substantially reduced (Figure 2E and 2F), as well as airway mucus accumulation and leukocyte infiltration as revealed by histochemical staining (Figure S2A-S2C) in Vhlfl/fl Zbtb16-cre mice compared with control mice. The numbers of ILC2s in the lung-draining mediastinal lymph nodes were also lower in Vhlfl/fl Zbtb16-cre mice (Figure S2D). The papain-enhanced lung ILC2 proliferation in wild-type mice, as indicated by the elevated frequency of Ki-67+ ILC2s, was severely impaired in Vhlfl/fl Zbtb16-cre mice (Figure S2E and S2F). In addition, we observed a reduction in the frequencies and total numbers of IL-5 and/or IL-13 producing lung ILC2s in Vhlfl/fl Zbtb16-cre mice compared to wild-type mice (Figure 2G-2I). Similarly, the concentrations of IL-5 and IL-13 in the BALF were significantly decreased in Vhlfl/fl Zbtb16-cre mice in comparison to wild-type controls (Figure 2J). Taken together, these data established that VHL deficiency resulted in functionally impaired lung ILC2s and attenuated airway inflammation upon papain challenge.
Figure 2. VHL deficiency abrogates ILC2-mediated lung inflammation upon papain challenge.
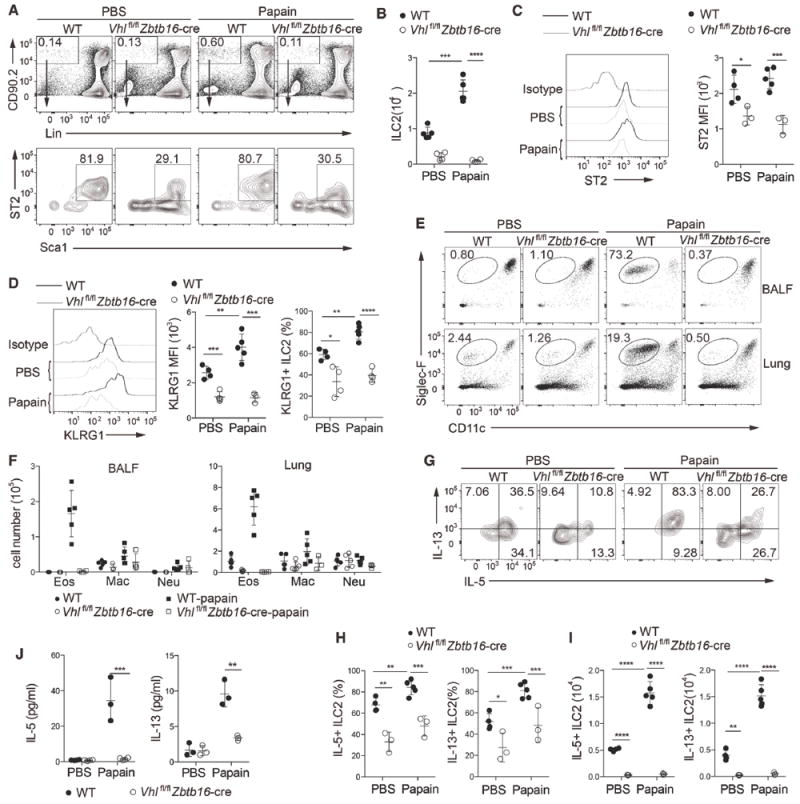
WT and Vhlfl/fl Zbtb16-cre mice were challenged with 25 μg of papain or PBS on day 0, 1 and 3 intranasally, and analyzed on day 4.
(A) Representative flow cytometric analysis of lung ILC2s, gated as CD45+Lin−CD90.2+Sca1hiST2+ in WT and Vhlfl/fl Zbtb16-cre mice treated with PBS or papain. Numbers indicate the frequency of flow cytometric events, arrows from outlined areas at top indicate gated cells analyzed below.
(B) Total numbers of lung ILC2s as assessed in A (n = 4-5 per group).
(C) Flow cytometric analysis of ST2 expression (left) and quantification of ST2 mean fluorescence intensity (MFI) (right) in pre-gated lung ILC2s as in A.
(D) Flow cytometric analysis of KLRG1 expression (left) and quantification of KLRG1 MFI (middle) in pre-gated lung ILC2s as in A, and total frequencies of lung ILC2s that express KLRG1 (right).
(E) Flow cytometric analysis of eosinophils (CD11c−/loSiglec-F+) among CD45+ cells in bronchoalveolar lavage fluid (BALF) (top) and lungs (bottom). Numbers indicate the frequency of flow cytometric events.
(F) Quantification of total eosinophils (Eos; CD45+CD11c−/loSiglec-F+), macrophages (Mac; CD45+CD11chiSiglec-F+), and neutrophils (Neu; CD45+CD11b+Ly-6G+) in BALF (left) and lung tissue (right) (n = 3-5 per group).
(G) Flow cytometry analyzing the intracellular expression of IL-5 and IL-13 from lung ILC2s stimulated with PMA plus ionomycin. Numbers in quadrants indicate percent cells in each throughout.
(H,I) Frequencies (H) and total numbers (I) of IL-5+ or IL-13+ cells in lung ILC2s (n = 3-5 per group).
(J) Concentrations of IL-5 and IL-13 in BALF (n = 3 per group).
Each symbol (B-D,F,H-J) represents an individual mouse. Data are represented as mean ± SD. *P < 0.05, **P < 0.01, ***P < 0.001, and ****P < 0.0001 (two-tailed unpaired t-test). Data are pooled from or representative of two to four independent experiments. See also Figure S2.
VHL deficiency attenuates the responsiveness of ILC2s to IL-33
ILC2s express several receptors for cell differentiation, homeostasis and effector functions, including IL-33 receptor ST2, IL-25 receptor IL17Rβ and TSLP receptor TSLPR(Licona-Limon et al., 2013). Previous reports have demonstrated that IL-33 is the most competent effector cytokine for the activation and expansion of ILC2s(Barlow et al., 2013; Huang et al., 2015). In naïve mice, most ILC2s in the bone marrow lack KLRG1 expression. Intraperitoneal administration of IL-33 promoted the expansion and activation of bone marrow ILC2s in wild-type mice, indicated by increased total cell numbers (Figure 3A and 3B) and elevated expression of ST2 and KLRG1, as well as the significantly increased proportion of KLRG1-expressing ILC2s (Figure 3C and 3D). However, IL-33 had a negligible effect on bone marrow ILC2s of Vhlfl/fl Zbtb16-cre mice, as the total numbers were not increased (Figure 3B) and the ST2 expression level remained significantly lower than the counterpart upon IL-33 treatment (Figure 3C). Meanwhile, although IL-33 also drove elevated KLRG1 expression on VHL deficient bone marrow ILC2s, the enhancement was quite limited (Figure 3D). In vitro culture of purified bone marrow ILC2s from wild-type mice with IL-7 and IL-33 caused a substantial increase in total cell numbers and production of IL-5 and IL-13, while the same treatment on ILC2s from VHL deficient mice caused only minor IL-5 and IL-13 secretion and attenuated the increase of ILC2 numbers (Figure S3A and S3B), indicating a role of VHL in expansion and type 2 cytokine production of ILC2s in response to IL-33 treatment.
Figure 3. VHL depletion results in defective responsiveness of ILC2s to IL-33 treatment.
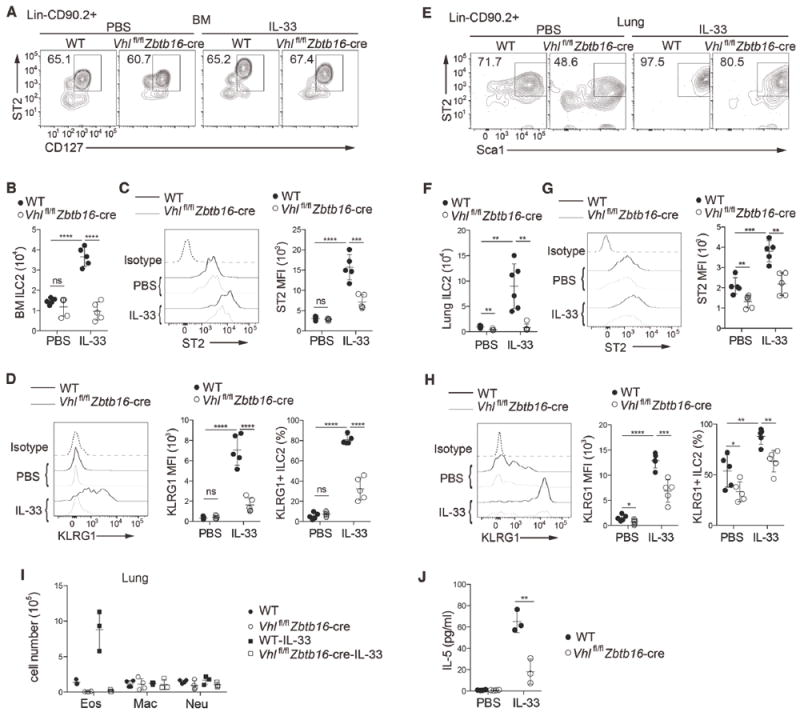
WT and Vhlfl/fl Zbtb16-cre mice were intraperitoneally injected with 500 ng of IL-33 or PBS on day 0, 1 and 3, and assessed on day 4.
(A) Flow cytometric analysis of BM ILC2s in WT and Vhlfl/fl Zbtb16-cre mice treated with IL-33 or PBS, pre-gated on Lin−CD90.2+ cells.
(B) Total numbers of BM ILC2s as assessed in A (n = 5 per group).
(C) Flow cytometric analysis of ST2 expression (left) and quantification of ST2 MFI (right) in pre-gated BM ILC2s as in A.
(D) Flow cytometric analysis of KLRG1 expression (left), quantification of KLRG1 MFI (middle) in pre-gated BM ILC2s as in A, and total frequencies of BM ILC2s that express KLRG1 (right).
(E-H) Analysis of lung ILC2s as in A-D.
(I) Quantification of total eosinophils (Eos), macrophages (Mac), and neutrophils (Neu) in the lungs (n = 3-4 per group).
(J) Concentration of IL-5 in BALF (n = 3 per group).
Each symbol (B-D,F-J) represents an individual mouse. Data are represented as mean ± SD. ns, not significant; *P < 0.05, **P < 0.01, ***P < 0.001, and ****P < 0.0001 (two-tailed unpaired t-test). Data are pooled from or representative of two to four independent experiments. See also Figure S3.
Similarly, IL-33 administration resulted in an increase in the total numbers and ST2 and KLRG1 expression of lung ILC2s from wild-type mice, whereas the responsiveness of lung ILC2s in Vhlfl/fl Zbtb16-cre mice was decreased (Figure 3E-3H). Additionally, VHL deficiency resulted in reduced accumulation of lung eosinophils and lower concentration of IL-5 in BALF upon IL-33 injection (Figure 3I and 3J).
Moreover, bone marrow and lung ILC2s from IL-33-treated wild-type mice exhibited high proportions of Ki-67+ cells, whereas proliferation of ILC2s from VHL deficient mice was significantly lower than their counterpart control (Figure S3C and S3D). Consistently, IL-33 administration did not elicit ILC2 expansion in EWAT, peritoneal cavity, large intestine, lung-draining lymph nodes and mesenteric lymph nodes (mLNs) (Figure S3E), or eosinophil accumulation in EWAT and peritoneal cavity in Vhlfl/fl Zbtb16-cre mice (Figure S3F), with only moderated IL-5 and IL-13 secretion in peritoneal cavity (Figure S3G). Thus, loss of VHL resulted in the failure to mount an inflammatory response to IL-33 treatment.
The effect of VHL on ILC2s is cell-intrinsic
To examine whether the defects of ILC2s in Vhlfl/fl Zbtb16-cre mice are due to cell-intrinsic or cell-extrinsic effects, we generated competitive bone marrow chimeric mice by transferring Vhlfl/fl Zbtb16-cre (CD45.2+) or wild-type (CD45.2+) bone marrow cells, mixed with an equal ratio (1:1) of wild-type (CD45.1+) bone marrow cells, into lethally irradiated Rag2−/−Il2rg−/− recipient mice, which were absent of mature T cells, B cells, and ILCs. We analyzed the donor chimerism of ILC2s, ILC3s and LTi cells from the bone marrow, lungs and intestine, and normalized to splenic B cells as a control by measuring the ratio of CD45.2 and CD45.1 markers (Figure 4A). Fewer ILC2s in the lungs, small and large intestine were detected from CD45.2+ Vhlfl/fl Zbtb16-cre donor cells compared with the competitor CD45.1+ wild-type donor cells (Figure 4A). In contrast, CD45.2+ and CD45.1+ wild-type donor cells-derived chimeras had comparable ILC2 populations among different tissues (Figure 4A). However, bone marrow ILC2s, intestinal ILC3s and LTi cells repopulated to similar extents in the mixed chimeras (Figure 4A and 4B). Similarly, single bone marrow chimeric mice were generated and challenged with IL-33. Consistently, intraperitoneal IL-33 administration increased total numbers of lung ILC2s derived from CD45.2+ wild-type donor cells, but not from CD45.2+ Vhlfl/fl Zbtb16-cre donor cells (Figure 4C and 4D). Therefore, VHL acted in a cell-autonomous manner in regulating the development and function of ILC2s.
Figure 4. VHL plays an intrinsic role in ILC2 generation.
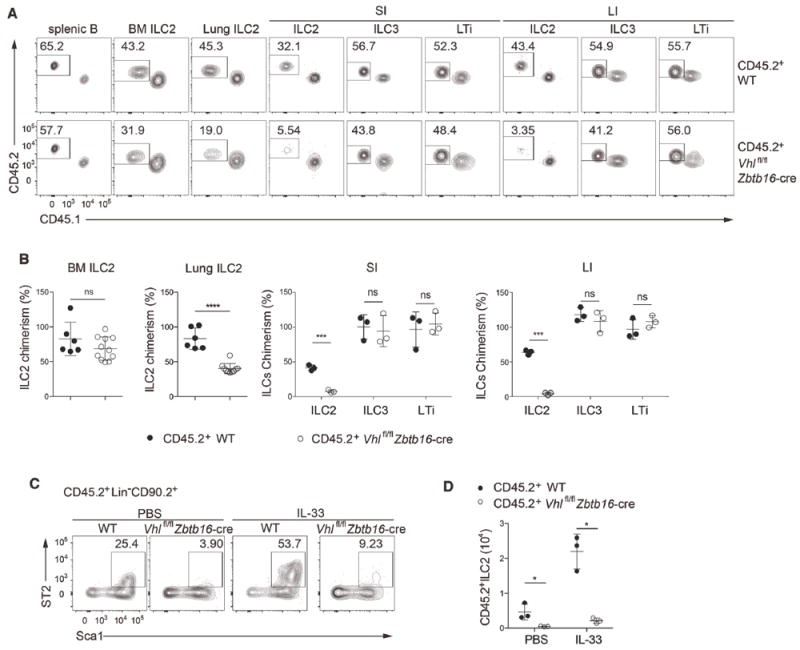
(A) Flow cytometric analysis of splenic B cells (CD45+CD19+), BM and lung ILC2s, and ILC2s, ILC3s, and LTi cells of small and large intestinal lamina propria of lethally irradiated Rag2−/−Il2rg−/− recipient mice reconstituted for 8-10 weeks with an equal mixture (1:1) of BM cells from CD45.1+ WT, CD45.2+ WT, or Vhlfl/fl Zbtb16-cre mice, assessed by the markers CD45.1 and CD45.2. Numbers indicate the frequency of flow cytometric events.
(B) Relative CD45.2+ ILC chimerism normalized to CD45.2+ splenic B cells as assessed in A (n = 3-11 per group).
(C) Flow cytometric analysis of CD45.2+ lung ILC2s as Lin−CD90.2+Sca1hiST2+ cells from lethally irradiated Rag2−/−Il2rg−/− recipient mice reconstituted for 8-10 weeks with BM cells from CD45.2+ WT or Vhlfl/fl Zbtb16-cre mice, and intraperitoneally administrated with 500 ng of IL-33 or PBS for 3 consecutive days and analyzed 24h later. Numbers indicate the frequency of flow cytometric events.
(D) Total numbers of CD45.2+ lung ILC2s as assessed in C.
Each symbol in (B,D) represents an individual mouse. Data are represented as mean ± SD. ns, not significant; *P < 0.05, ***P < 0.001, and ****P < 0.0001 (two-tailed unpaired t-test). Data are pooled from or representative of two to four independent experiments. See also Figure S2.
VHL deficiency inhibits the differentiation of ILC2s in vitro
ILC2s can be generated from CLPs or CHILPs in vitro on OP9 stromal cells expressing Delta-like (DL) ligand in the presence of IL-7 and IL-33(Klose et al., 2014; Wong et al., 2012). To further determine whether VHL is intrinsically required for the development of ILC2s, we used OP9-DL4 cell line as feeder cells, and co-cultured them with bone marrow CHILPs from wild-type or Vhlfl/fl Zbtb16-cre mice in the presence of IL-7 and IL-33. As expected, wild-type CHILPs developed into Sca1+ICOS+ ILC2s to a large extent after 18 days of culture, and most cells also expressed CD44 and CD25, with about 20% of them expressing ST2 (Figure 5A). However, CHILPs from Vhlfl/fl Zbtb16-cre mice generated significantly less ILC2s compared with those from control mice (Figure 5A and 5B). Moreover, we measured the production of type 2 cytokines from the in vitro differentiated cells, and found that VHL deficiency dampened the frequencies of IL-5 and/or IL-13 secreting populations (Figure 5C and 5D). In addition, as PD-1hi ILC progenitors are recently identified (Yu et al., 2016), we used a PD-1hi progenitor population from control and Vhlfl/fl Zbtb16-cre mice for in vitro ILC2 differentiation and obtained similar results (Figure S4A and S4B). These results, together with the bone marrow chimeric studies, clearly indicated that VHL was intrinsically required for the development and function of ILC2s.
Figure 5. VHL is essential for ILC2 development in vitro.

(A) Flow cytometric profiles of cells derived from sorted common helper innate lymphoid progenitors (CHILPs; Lin−CD127+Flt3−CD25−α4β7+) of WT and Vhlfl/fl Zbtb16-cre mice cultured on OP9-DL4 stromal cells in the presence of IL-7 and IL-33, and analyzed for the percentage of ILC2s on day 15 (D15) or 18 (D18) of culture by the specific markers, including Sca1+ICOS+, CD44+CD25+, and CD127+ST2+, pre-gated with Lin− cells. Numbers indicate the frequency of flow cytometric events.
(B) Total frequencies of CHILP-derived cells as assessed in A.
(C) Flow cytometry analyzing the intracellular expression of IL-5 and IL-13 from cells derived as in A, stimulated with PMA plus ionomycin. Numbers in quadrants indicate percent cells in each throughout.
(D) Total frequencies of IL-5 and/or IL-13 cells as in C.
Data are represented as mean ± SD. *P < 0.05 and **P < 0.01 (two-tailed unpaired t-test). Data are from one experiment with three biological replicates and representative of three independent experiments with similar results. See also Figure S4.
VHL-HIF1α signaling plays an essential role in ILC2s
It is well established that loss of VHL results in the accumulation of HIFα proteins (Maxwell et al., 1999). We measured the mRNA expression of HIF subunits including HIF1α, HIF2α and HIF1β and found that HIF1α was the dominant HIF subunit in bone marrow and lung ILC2s (Figure S5). Flow cytometric analysis showed that the expression of HIF1α was indeed increased in ILC2s from Vhlfl/fl Zbtb16-cre mice compared with wild-type ILC2s after IL-33 stimulation (Figure 6A and 6B). To confirm the indispensable role of HIF1α in VHL-deficient ILC2s in vivo, we generated Vhlfl/flHif1afl/fl Zbtb16-cre and constructed mixed or single bone marrow chimeric mice. Analysis of mixed chimeras revealed that HIF1α ablation in VHL deficient ILC2s completely restored the abnormalities in ILC2s from Vhlfl/fl Zbtb16-cre mice in the lungs and intestine (Figure 6C and 6D). Consistently, analysis of single bone marrow chimeric mice revealed that intraperitoneal IL-33 administration increased the frequencies of lung ILC2s derived from wild-type or Vhlfl/flHif1afl/fl Zbtb16-cre mice, but not from Vhlfl/fl Zbtb16-cre (Figure 6E), indicating that HIF1α deletion rescued the responsiveness of VHL deficient ILC2s to IL-33. To further investigate the role of HIF1α in ILC2 development, we used a HIF1α specific inhibitor PX-478 in the in vitro co-culture system. PX-478 treated CHILPs from Vhlfl/fl Zbtb16-cre mice restored the ability to generate a large proportion of Sca1+ICOS+ and CD44+CD25+ cells similar as untreated wild-type CHILPs, in comparison with those untreated from Vhlfl/fl Zbtb16-cre mice (Figure 6F and 6G). Taken together, these data demonstrated that HIF1α played an essential role in VHL regulation of ILC2s.
Figure 6. HIF1α contributes to VHL-mediated regulation of ILC2s.
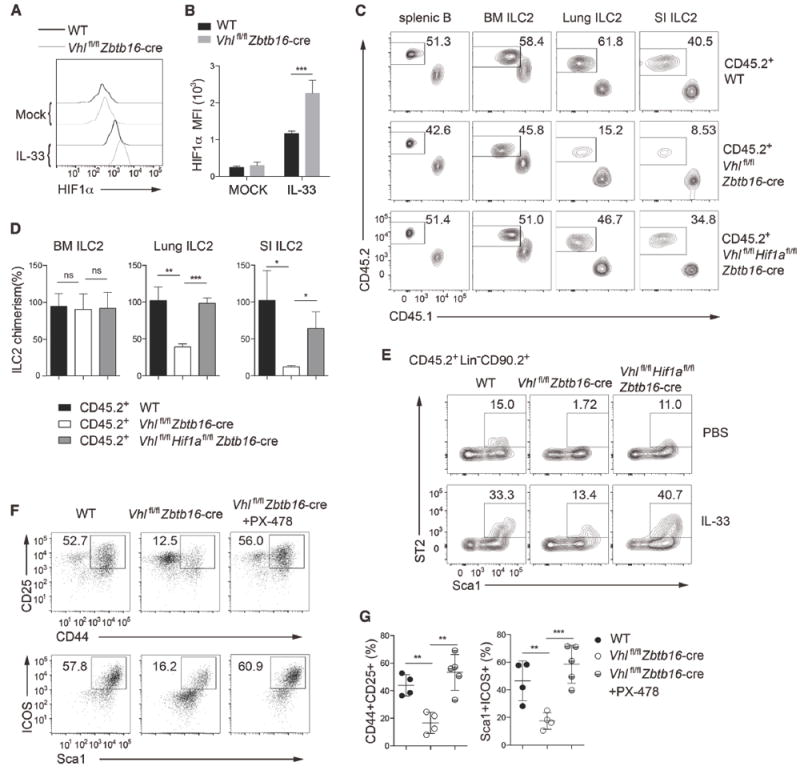
(A) Representative flow cytometric histogram of intracellular HIF1α by BM ILC2s from WT and Vhlfl/fl Zbtb16-cre mice with PBS or IL-33 treatment.
(B) Quantification of HIF1α MFI as indicated (n = 4 per group).
(C) Lethally irradiated Rag2−/−Il2rg−/− mice were reconstituted with an equal mixture of BM cells from CD45.1+ WT, and CD45.2+ WT, Vhlfl/fl Zbtb16-cre, or Vhlfl/flHif1afl/fl Zbtb16-cre mice, and analyzed 8–10 weeks later. Flow cytometric analysis of splenic B cells and ILC2s from the BM, lungs, and SI of chimeric mice. Numbers indicate the frequency of flow cytometric events.
(D) Relative CD45.2+ ILC2 chimerism normalized to CD45.2+ splenic B cells as assessed in C (n = 3 per group).
(E) Lethally irradiated Rag2−/−Il2rg−/− recipient mice were reconstituted for 8-10 weeks with BM cells from CD45.2+ WT, Vhlfl/fl Zbtb16-cre, or Vhlfl/flHif1afl/fl Zbtb16-cre mice, and intraperitoneally administrated with 500 ng IL-33 or PBS for 3 consecutive days and analyzed 24h later. Flow cytometric analysis of CD45.2+ lung ILC2s as Lin−CD90.2+Sca1hiST2+ cells. Numbers indicate the frequency of flow cytometric events.
(F) Flow cytometric analysis of CD44+CD25+ (top) and Sca1+ICOS+ (bottom) cells on day 20 of culture on OP9-DL4 cells in the presence of IL-7 and IL-33, which were derived from CHILPs from WT or Vhlfl/fl Zbtb16-cre mice left untreated or treated with 5 μM PX-478, and pre-gated with Lin− cells. Numbers indicate the frequency of flow cytometric events.
(G) Frequencies of CD44+CD25+ (left) and Sca1+ICOS+ (right) cells among Lin−CD90.2+ cells as assessed in F.
Data are represented as mean ± SD. ns, not significant; *P < 0.05, **P < 0.01 and ***P < 0.001(two-tailed unpaired t-test). Data are pooled from or representative of two to three independent experiments or from one experiment with five biological replicates. See also Figure S5.
VHL promotes ILC2 differentiation by glycolytic inhibition
HIF1α preferentially induces the expression of genes that are related to glycolytic pathway, which relies on a chain of catalytic reactions executed by multiple enzymes (Iyer et al., 1998). To explore whether loss of VHL alters glycolysis in ILC2s, we performed quantitative real-time PCR analysis and found that the expression of several glycolytic enzyme genes was markedly increased in ILC2s from Vhlfl/fl Zbtb16-cre mice compared with wild-type ILC2s (Figure S6A). The cellular oxygen-consumption rate (OCR) and extracellular acidification rate (ECAR) were measured as indicators of mitochondrial respiration and aerobic glycolysis, respectively. Consistently, ILC2s from VHL deficient mice showed less OCR and higher ECAR in comparison to wild-type ILC2s, suggesting that VHL deletion resulted in enhanced glycolysis capacity and attenuated mitochondrial respiration in ILC2s (Figure S6B-S6E).
To further investigate whether aberrant glucose metabolism is responsible for the defects of ILC2s, we tested whether the HIF hydroxylase PHD inhibitor DMOG or TCA cycle inhibitor CPI-613, could influence ILC2 development by using the in vitro co-culture system. We found that DMOG and CPI-613, through enhancing glycolysis or blocking oxidative phosphorylation, could inhibit the differentiation of ILC2s, as annotated by the decreased proportions of CD127+ST2+ cells from DMOG or CPI-613 treated CHILPs compared with the untreated control (Figure S6F).
To investigate the molecular mechanism of metabolic reprogramming in the development of ILC2s, we tried to manipulate glycolysis at different steps with small molecule agents in vitro. CHILPs from wild-type mice cultured in vitro were treated with 2-deoxyglucose (2-DG), shikonin (SKN) or UK5099, to inhibit hexokinase (HK), pyruvate kinase (PKM2) and mitochondrial pyruvate carrier (MPC), respectively. Treatment with 2-DG or SKN augmented the differentiation of Sca1+ST2+ ILC2s, whereas UK5099 attenuated ILC2 differentiation (Figure 7A). We then examined the role of PKM2, which catalyzes the conversion from phosphoenolpyruvate to pyruvate, by shRNA-mediated knockdown and found that decreased PKM2 expression promoted ILC2 differentiation (Figure 7B). We next tested whether the glycolytic metabolites pyruvate and lactate are involved in this process in the in vitro co-culture system at different doses. Treatment with pyruvate, but not lactic acid, resulted in decreased differentiation of Sca1+ST2+ ILC2s (Figure 7C). These findings elucidated an important role of metabolic reprogramming centered at the PKM2-pyruvate step in ILC2 development.
Figure 7. VHL promotes ILC2s through metabolic reprogramming and epigenetic modification.
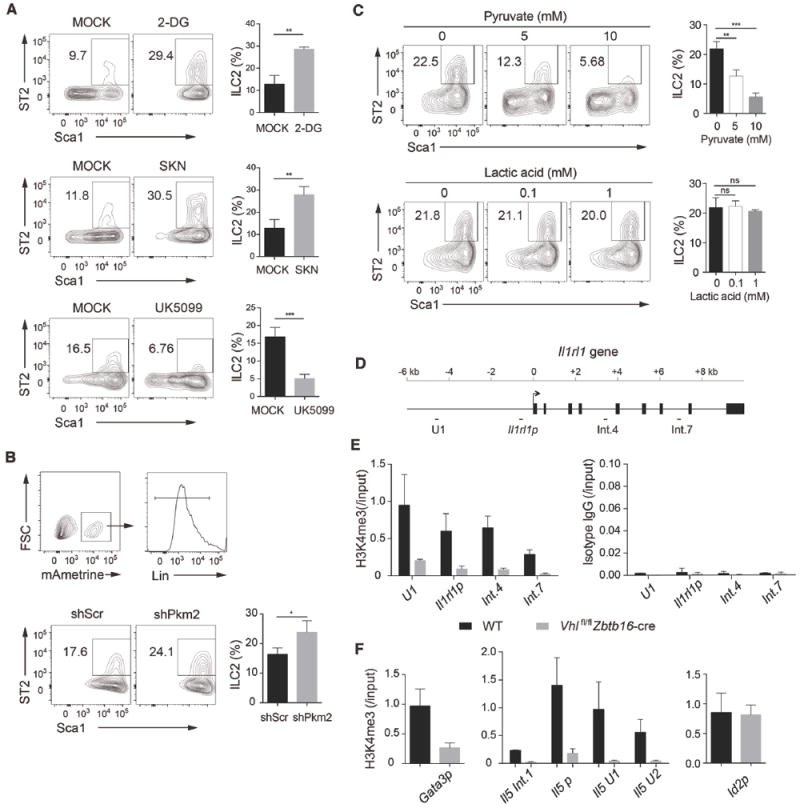
(A) Flow cytometric analysis (left) and frequencies (right) of Sca1+ST2+ ILC2s derived from CHILPs of WT mice cultured on OP9-DL4 stromal cells with IL-7 and IL-33, in the presence and absence (MOCK) of 100 μM 2-DG, 500 nM shikonin (SKN) or 25 μM UK5099, pre-gated with Lin− cells. Numbers indicate the frequency of flow cytometric events.
(B) Flow cytometric analysis of Sca1+ST2+ ILC2s derived from CHILPs of WT mice infected with shScramble (shScr) or shPkm2 retrovirus, pre-gated with mAmetrine+Lin− cells.
(C) Flow cytometric analysis (left) and frequencies (right) of Sca1+ST2+ ILC2s derived from CHILPs of WT mice in the presence of glycolytic metabolites pyruvate and lactic acid, pre-gated with Lin− cells.
(D) Schematic representation of the mouse Il1rl1 gene loci. The location of primers and probes (upstream region 1 [U1], promoter, intron 4 [int.4] and intron 7 [int.7]) and exons are indicated.
(E) ChIP-qPCR analysis of the mouse Il1rl1 gene loci with anti-H3K4me3 (left) or isotype control antibody (right) in BM ILC2s isolated from WT or Vhlfl/fl Zbtb16-cre mice cultured with IL-7 and IL-33 for 7 days. Results were normalized to input DNA.
(F) ChIP-qPCR analysis of the proximal promoter of Gata3 (Gata3p), the mouse Il5 gene loci (intron 1 [int.1], promoter, upstream region U1 and U2), and Id2 promoter (Id2p) with anti-H3K4me3 antibody.
Data are represented as mean ± SD. ns, not significant; *P < 0.05, **P < 0.01 and ***P < 0.001(two-tailed unpaired t-test). Data are representative of two to three independent experiments or from one experiment with three biological replicates. See also Figure S6.
VHL deficiency alters epigenetic modification on ST2 gene
Glucose metabolism can influence epigenetic modification to control selective expression of genes in lymphocytes (Buck et al., 2015; Peng et al., 2016; Tyrakis et al., 2016). To further elucidate the effects of VHL deficiency on ILC2s, we performed chromatin immunoprecipitation (ChIP) analysis with antibody against histone H3 tri-methylation at the lysine 4 residue (H3K4me3), a transcriptional permissive modification. ILC2s from Vhlfl/fl Zbtb16-cre mice showed decreased modification of H3K4me3 at the Il1rl1 (ST2 gene) loci compared with that from wild-type mice, whereas ChIP with an isotype-matched control antibody showed negligible signals in the regions tested (Figure 7D and 7E). Consistent with Il1rl1 epigenetic changes, we also observed reduced H3K4me3 modification at the Gata3 promoter and Il5 gene loci in VHL-deficient ILC2s, whereas the abundance of H3K4me3 at the Id2 promoter region was comparable (Figure 7F). These results indicated that VHL deficiency altered epigenetic modification of ST2 gene and the downstream targets in ILC2s.
DISCUSSION
In the present study, we demonstrated that VHL played an important role in promoting the development and effector function of ILC2s through a HIF1α-dependent glycolytic pathway. Although VHL deficiency did not overtly affect the population of immature ILC2s in the bone marrow, the numbers of ILC2s in peripheral non-lymphoid tissues were severely impaired. VHL depletion diminished the airway inflammation induced by papain administration and attenuated the responsiveness of ILC2s to IL-33 treatment. Mechanistically, VHL-deficient ILC2s exhibited enhanced expression of HIF1α, and subsequently resulted in enhanced glycolysis. Particularly, the PKM2-pyruvate checkpoint was critically involved in the expression of IL-33 receptor ST2 and subsequent homeostasis of ILC2s through epigenetic modification.
Previous studies have used various genetic tools in deleting genes related to the development of ILC lineage cells, such as Il7ra-Cre (Halim et al., 2016; Monticelli et al., 2016; Yu et al., 2015; Zook et al., 2016), Mx1-Cre(Wong et al., 2012; Yang et al., 2013), and Vav-Cre(Yagi et al., 2014). The transcription factor PLZF, which is earlier reported to dominate the development and function of NKT cells (Savage et al., 2008), is transiently expressed in ILC precursors (ILCPs) (Constantinides et al., 2014). Although PLZF expression marks the ILCP population, it is not essential for the generation of most ILCs, except for ILC2s and liver ILC1s (Constantinides et al., 2014). Using the Zbtb16-cre, we specifically deleted Vhl gene expression in ILCPs and NKT cells. Loss of VHL in ILCPs had a selective effect on the later development and effector functions of ILC2s, while ILC1 and ILC3 subsets were not obviously affected. The effect of Zbtb16-cre-driven deletion of VHL was intrinsic on ILC2 development in peripheral non-lymphoid tissues as revealed in the mixed bone marrow chimera experiments. These results are consistent with the lineage-tracing study, showing that the majority of ILC2s are traced by PLZF expression in the lineage commitment process, whereas ILC3s are labeled to a much less extent (Constantinides et al., 2014). However, the current study does not exclude a role of VHL in ILC1s and/or ILC3s, given the preferential effect of Zbtb16-cre on Vhl deletion in ILC2s shown here. As IL-33 is largely produced by epithelium in the peripheral non-lymphoid tissues, the effect of VHL-HIF-glycolysis pathway on ST2 expression will provide a reasonable explanation for the observed reduction of mature ILC2s in the lungs and intestine, with only slight effect on bone marrow ILC2s.
HIF1α-mediated glycolysis has emerged as a key regulator for the metabolic checkpoint for the differentiation and activation of immune cells (Buck et al., 2015; Ganeshan and Chawla, 2014). HIF1α-induced metabolic reprogramming also orchestrates T cell lineage specification. HIF1α-regulated glycolysis serves as a key metabolic checkpoint to cell fate determination between Th17 and Treg cells (Dang et al., 2011; Shi et al., 2011). VHL-deficient CTLs exhibit enhanced HIF1α expression and glycolysis, and produce increased IFNγ, thus promoting the effector response to persistent antigen (Doedens et al., 2013). Our recent study has demonstrated that loss of VHL in Treg cells causes enhanced glycolysis and disturbs their stability to become IFNγ-secreting inflammatory Treg cells, thus induces type 1 immune responses and tissue damages (Lee et al., 2015). In concordance with these findings, we now demonstrate a detrimental role of VHL-HIF1α-regulated glycolysis in ILC2 maturation and type 2 responses.
Previous reports have established a connection between glucose metabolism and epigenetic regulation in T cells. GAPDH can act as a RNA-binding protein and prevent the translation of cytokine mRNAs containing AU-rich elements in the 3’-UTR to promote T cell effector function (Chang et al., 2013). LDHA promotes Th1 cell differentiation by maintaining high amounts of acetyl-CoA to sustain histone acetylation and transcription of Ifnγ (Peng et al., 2016). 2-hydroxyglutarate regulates CD8 T cell differentiation through modulation of histone and DNA demethylation (Tyrakis et al., 2016). We observed that knockdown or inhibition of PKM2 resulted in enhanced ILC2 development, whereas pyruvate treatment or blocking mitochondrial transport of pyruvate and oxidative phosphorylation directly attenuated ILC2 development. Thus, the PKM2-pyruvate checkpoint plays a key role for ILC2 development through ST2 expression. Combing the published data and our observations in this study, we propose a model of equilibrium between glycolysis and oxidative phosphorylation in that the imbalance between the two will alter the epigenetic modification, which involves a collective action of enzymes and metabolites at different checkpoints. In supporting this model, loss of VHL causes the shift from oxidative phosphorylation to glycolysis, which results in altered epigenetic modification of ST2 gene and its downstream targets in ILC2s. Further investigation of the VHL-HIF-glycolysis axis will unveil insights into the detailed molecular nature of the glucose metabolism in ILC2s.
Intestinal ILC2s have been reported to preferentially utilize fatty acid to protect against helminth infection, while blocking glycolysis with 2-DG does not impair ILC2 function (Wilhelm et al., 2016). In this study, we found that exaggerated glycolysis caused by VHL deletion attenuated ILC2 differentiation. The discrepancy could be that 2-DG blocking could shift the cellular energy production by oxidative phosphorylation using metabolites from other metabolic pathways such as glutamate and fatty acid synthesis, whereas in the VHL-deficient ILC2s, VHL-HIF axis targets selective enzymes and metabolic checkpoints, which could result in different readouts.
Recent studies have recognized that ILC2s are tissue-resident lymphocytes, which can maintain and expand locally under resting physiologic conditions, and during acute inflammation (Gasteiger et al., 2015; Moro et al., 2016). We observed severe decrease of ILC2s in peripheral non-lymphoid tissues of Vhlfl/fl Zbtb16-cre mice at steady state, while the populations of bone marrow ILC2s were comparable, in spite of the abnormal expression of several ILC2-specific markers. It is suggested that bone marrow ILC2s are in the stage of immature ILC2s or their precursors as they lack the maturation marker KLRG1, which is associated with IL-5 and IL-13 production (Hoyler et al., 2012). A recent study has established a population of IL-25-responsive inflammatory ILC2s (iILC2s) in lung tissue, which have no ST2 expression, but have the potential to become natural ILC2s (Huang et al., 2015). This population is demonstrated as the precursor of ST2-expressing ILC2s during inflammation and infection. Based on our current study, we postulate that ILC2s undergo a two-stage maturation process. At the early stage, they initiate the transcriptional program to acquire general ILC2 properties and stay in quiescence in the bone marrow or maybe other organs. At the late stage, ILC2s respond to the peripheral micro-environmental cues, further express the maturation markers, and are primed to secret type 2 cytokines rapidly upon allergen stimulation or infection. Our study provides evidence to support the two-stage model of ILC2 development, and VHL-HIF1α pathway is critical in the late stage of ILC2 differentiation and functional maturation via the regulation of ST2 expression and IL-33-ST2 pathway. Understanding the molecular mechanisms of how glycolysis governs ILC2 homeostasis may reveal potential targets for therapeutic intervention of ILC2-mediated inflammatory diseases.
STAR METHODS
CONTACT FOR REAGENT AND RESOURCE SHARING
Further information and requests for resources and reagents should be directed to and will be fulfilled by the Lead Contact, Yun-Cai Liu (yuncai_liu@mail.tsinghua.edu.cn).
EXPERIMENTAL MODEL AND SUBJECT DETAILS
Mice
Mice used in this study were on a C57BL/6 background. Vhlfl/fl, Hif1afl/fl mice were purchased from Jackson Laboratory. Zbtb16-Cre mice were provided by M. Kronenberg, La Jolla Institute for Allergy and Immunology (LJI), and used to cross with Vhlfl/fl, Hif1afl/fl mice to generate Vhlfl/flZbtb16-Cre and Vhlfl/flHif1afl/fl Zbtb16-Cre mice. Heterozygous Cre mice were used, together with littermate controls, in all experiments. Rag2−/−Il2rg−/− mice were from Z. Dong and CD45.1+ mice were from Y. Shi (Tsinghua University). Male and female mice were sex-matched and used at 6-10 weeks of age. Animal protocols were approved by the Institutional Animal Care and Use Committee at Tsinghua University and LJI.
METHOD DETAILS
Papain administration
Mice were anesthetized with isoflurane and then sensitized with papain (25 μg in 50 μl PBS; Sigma-Aldrich) by intranasal instillation on day 0, 1 and 3. Bronchoalveolar lavage fluid (BALF), lungs and lung draining lymph nodes were collected and analyzed on day 4.
IL-33 administration
Mice were given intraperitoneal injection of 500 ng of IL-33 on day 0, 1 and 3. Bone marrow, lungs, peritoneal lavage, epididymal white adipose tissue (EWAT), lung draining lymph nodes, mesenteric lymph nodes and intestine were harvested and analyzed on day 4.
Lung histology
Lungs were fixed in 4% phosphate-buffered formalin and embedded in paraffin for sectioning. Sections (5 μm) were used for hematoxylin and eosin staining or periodic acid-Schiff staining. Perivascular and peribronchial inflammation evaluations were scored on an arbitrary 1-3+ basis in a blind fashion, according to the degree of infiltrated inflammatory cells.
Generation of bone marrow chimera
For mixed bone marrow chimera, Rag2−/−Il2rg−/− mice were lethally irradiated with 450 rads and were reconstituted with bone marrow cells (2 × 10⁶ each) obtained from wild-type (CD45.1+), Vhlfl/fl Zbtb16-Cre or Vhlfl/flHif1afl/flZbtb16-Cre (CD45.2+) mice. After 8-10 weeks, the spleen, bone marrow, lungs, and lamina propria of the small and large intestine were collected for analysis. For single bone marrow chimera, Rag2−/−Il2rg−/− mice were reconstituted with 4 × 10⁶ CD45.2+ bone marrow cells obtained from wild-type, Vhlfl/flZbtb16-Cre or Vhlfl/flHif1afl/flZbtb16-Cre mice. After 8-10 weeks, mice were intraperitoneally injected with IL-33 or PBS. The lungs were collected for analysis.
Isolation of lymphocytes
For isolation of cells from the thymus, spleen, lymph nodes and liver, tissues were homogenized manually through 70-μm cell strainers. Bone marrow cells were collected by flushing out the marrow from femurs and tibias using a syringe with RPMI-1640 media. Peritoneal cells were collected by flushing the peritoneal cavity with 6 ml of PBS with 2% FBS. BALF cells were collected by gently flushing the lung with two washes of 1 ml of PBS through the trachea. Red blood cells were lysed with ACK buffer (eBioscience).
For isolation of cells from the lungs and EWAT, tissues were diced into small pieces and incubated with 1 mg/ml collagenase III (Worthington) and 20 μg/ml DNase I (Roche) in RPMI-1640 media for 45 min at 37 °C before being ma shed through 70-μm cell strainers. After associated fat tissues and Peyer’s patches were removed, intestine was opened longitudinally, cut into 5 mm pieces, and washed with HBSS medium containing 5 mM EDTA and 1 mM DTT for 20 min at 37 °C twice to remove epithelial cell s. Then, intestinal tissues were digested with 2 mg/ml collagenase type III for 50 min. To isolate leukocytes in the lungs, intestine and liver, digested tissues or cell suspensions were filtered through 70-μm cell strainers and enriched with 40% Percoll gradient after red blood cells were lysed. Single-cell suspensions from all tissues were used for subsequent flow cytometry staining.
Flow cytometry
Samples were pre-incubated with Fc Block (eBioscience) for 10 min. Staining of surface molecules with fluorescently labeled antibodies was performed on ice for 30 min in the dark. For phenotypic analysis by flow cytometry, samples were run on an LSR Fortessa (BD Biosciences) and data were analyzed using FlowJo (Tree Star). For sorting of hematopoietic progenitors or ILC2s from bone marrow cells, lineage negative (Lin−) cells were firstly enriched by mouse Lineage Cell Depletion Kit (Miltenyi Biotec) following the manufacturer’s instructions. Cells were sorted on an Aria II (BD Biosciences).
Intracellular staining
For measurement of intracellular cytokine expression, cells were isolated ex vivo and stimulated with 50 ng/ml PMA and 500 ng/ml ionomycin, in the presence of GolgiStop (BD Biosciences) for 3 h. Dead cells were excluded by Fixable Viability Dye eFluor 450 (eBioscience). Cells were stained with antibodies to surface antigens, and then fixed and permeabilized with the Cytofix/Cytoperm kit (BD Biosciences), followed by staining with anti-IL-5 (Biolegend) and anti-IL-13 (eBioscience).
For analysis of transcription factor expression, cells were stained with antibodies to surface antigens, then fixed and permeabilized with the Foxp3/Transcription Factor Staining Buffer Set (eBioscience) according to the manufacturer’s instructions, and stained with anti-GATA3 (eBioscience), anti-RORγt, anti-T-bet (BD Biosciences), or anti-Ki-67 (eBioscience).
For measurement of intracellular HIF1α, Lin− bone marrow cells were cultured in complete media with 10 ng/ml IL-7 (Peprotech) and 10 ng/ml IL-33 (R&D Systems) for 4 days. Cells were collected and stained with antibodies to surface antigens, fixed and permeabilized with the Foxp3/Transcription Factor Staining Buffer Set (eBioscience) according to the manufacturer’s instructions, and then stained with anti-HIF1α (R&D Systems).
In vitro ILC2 differentiation assay
Lin−CD127+Sca1loc-kitloFlt3+ common lymphoid progenitors (CLPs), Lin−CD127+Flt3−CD25−α4β7+ common helper innate lymphoid progenitors (CHILPs) or Lin−CD127+Flt3−CD25−PD-1hi progenitors were sorted from Lin− enriched bone marrow cells by flow cytometry on BD Aria II. The progenitors were cultured in MEM-α complete media containing 20% FBS, 1% penicillin-streptomycin, 10 ng/ml IL-7 (Peprotech) and 10 ng/ml IL-33 (R&D Systems) on OP9-DL4 stromal cells (from Sunnybrook Research Institute, Canada) treated with mitomycin c. ILC2 differentiation was evaluated by cell surface staining of Lin, CD90.2, Sca1, ST2, CD25, CD44, CD127 and ICOS at 11-20 days after culture. To assess the role of glycolysis related chemicals, inhibitors or metabolites were added on day 9 of culture.
Retroviral transduction
shRNA-containing oligonucleotides (TGCTGTTGACAGTGAGCGACCATAGATGTTACCCTTTATTTAGTGAAGCCACAGATGTAAA TAAAGGGTAACATCTATGGCTGCCTACTGCCTCGGA for scramble, TGCTGTTGACAGTGAGCGCGCTTTGCATCTGATCCCATTCTAGTGAAGCCACAGATGTA GAATGGGATCAGATGCAAAGCG TGCCTACTGCCTCGGA for PKM2) were cloned into the plasmid pLMP-Ametrine. Viral supernatants were prepared from Plat-E packaging cells. CLP-derived cells cultured on OP9-DL4 with IL-7 and IL-33 were infected with viral supernatant in presence of polybrene (5 μg/ml) by centrifugation at 2,500 rpm for 60 min on day 6 of culture. Infected cells were cultured and analyzed on day 16 of culture.
Cytokine profiling
BALF, peritoneal lavage fluid, and culture supernatants were collected from mice or cultured cells. The concentrations of IL-5 and/or IL-13 were quantified by using mouse ELISA Kits (eBiosciences) according to the manufacturer’s instructions.
RNA isolation and quantitative real-time PCR
RNA was extracted from whole cell lysates of isolated lymphocytes with an RNeasy Micro Kit (Qiagen) and was reversely transcribed to cDNA with a RevertAid First Strand cDNA Synthesis Kit (Thermo Scientific). Quantitative real-time PCR was performed on cDNA with iQ SYBR Green Supermix (Bio-Rad) in triplicates with a CFX96 real-time system (Bio-Rad). Samples were normalized to the expression of gene encoding β-actin. Primer sequences were listed in the Table S1.
Metabolic assays
FACS-sorted ILC2s were cultured with 10 ng/ml IL-7 and IL-33 for 7 days. Cells were plated at 40,000 cells per well and analyzed using an XF96 extracellular analyzer (Seahorse Bioscience). Three consecutive measurements of ECAR (mpH/min) and OCAR (pMoles O2/min) were obtained in XF base media at 37°C unde r basal conditions, in response to 1 μM oligomycin, 3 μM FCCP, 100 nM rotenone plus 1 μM antimycin A, 5 mM glucose, and 100 mM 2-DG. All chemicals used for these assays were obtained from Sigma-Aldrich. Glycolysis and glycolytic capacity were calculated from average of three measurements following addition of glucose and oligomycin, respectively. Basal OCR and maximal OCR were calculated from average of three measurements before addition of oligomycin and following addition of FCCP, respectively. SRC is calculated as the difference between basal OCR and maximal OCR.
Chromatin immunoprecipitation (ChIP) assay
FACS sorted ILC2s were cultured with 10 ng/ml IL-7 and IL-33 for 7 days. For each sample, 40,000 cells were collected and lysed in 19 μl lysis buffer (0.5% NP-40, 0.5% Tween-20, 0.1% SDS and proteinase inhibitor) for 5 min on ice and then subjected to enzymatic digestion by incubating with 19 μl MNase working buffer (100 mM Tris- HCl pH 8.0, 2 mM CaCl2) and 2 μl diluted MNase (0.01 unit/μl; Sigma, N3755) at 37 °C for 5 min. The reaction w as terminated by adding 5 μl Stop buffer (110 mM Tris-HCl pH 8.0, 55 mM EDTA), and then 45 μl cold 2 × RIPA buffer (1% Triton X-100, 280 mM NaCl, 0.1% SDS, 0.2% sodium deoxycholate, 5 mM EGTA and proteinase inhibitor). After spinning at max speed at 4 °C for 15 min, the supernatant was transferred to a new tube, and 10% was kept as input for later purification. Each chromatin sample was supplemented with 40 μl RIPA buffer (10 mM Tris-HCl pH 8.0, 140 mM NaCl, 1% Triton X-100, 0.1% SDS, 0.1% DOC, 1 mM EDTA) and then incubated with 1μg H3K4me3 (Abcam, ab8580) or rabbit isotype control IgG (Abcam, ab171870) overnight with rotation at 4 °C. The next day, the sample was incubated with 1 00 μg protein A/G dynabeads (Life Technologies) for another 2 h. The beads were washed five times with 150 μl RIPA buffer and once with 150 μl LiCl buffer (250 mM LiCl, 10 mM Tris-HCl pH 8.0, 1 mM EDTA, 0.5% NP-40, 0.5% DOC). After washing, the beads were resuspended with 95 ul TE buffer (10 mM Tris-HCl pH 8.0, 1 mM EDTA) supplemented with 5 μl proteinase K (10 mg/ml; Roche) and incubated at 55 °C with shaking for 90 min to digest proteins. T he supernatant was collected and DNA was purified by phenol-chloroform extraction and ethanol precipitation. Enrichment of histone modifications were analyzed by qPCR using validated primers described in Table S1. The ratio of precipitated DNA to input DNA was calculated for comparison of histone modification levels between different samples.
QUANTIFICATION AND STATISTICAL ANALYSIS
Statistical significance was assessed by unpaired two-tailed t test with Graphpad Prism 6. P values of <0.05 were considered statistically significant. ‘‘n’’ numbers indicate number of mice for in vivo studies or biological replicates for in vitro experiments.
Supplementary Material
KEY RESOURCES TABLE
| REAGENT or RESOURCE | SOURCE | IDENTIFIER |
|---|---|---|
|
| ||
| Antibodies
| ||
| Biotin anti-mouse CD3 (clone 145-2C11) | Biolegend | Cat# 100304; |
| RRID:AB_312669 | ||
|
| ||
| Biotin anti-mouse CD4 (clone GK1.5) | Biolegend | Cat# 100403; |
| RRID:AB_312688 | ||
|
| ||
| Biotin anti-mouse CD8a (clone 53-6.7) | Biolegend | Cat# 100703; |
| RRID:AB_312742 | ||
|
| ||
| Biotin anti-mouse CD5 (clone 53-7.3) | Biolegend | Cat# 100603; |
| RRID:AB_312732 | ||
|
| ||
| Biotin anti-mouse Ly-6G/Ly-6C(Gr1) (clone RB6-8C5) | Biolegend | Cat# 108403; |
| RRID:AB_313368 | ||
|
| ||
| Biotin anti-mouse TER-119/Erythroid Cells (clone TER-119) | Biolegend | Cat# 116203; |
| RRID:AB_313704 | ||
|
| ||
| Biotin anti-mouse CD19 (clone 6D5) | Biolegend | Cat# 115503; |
| RRID:AB_313638 | ||
|
| ||
| Biotin anti-mouse/human CD45R/B220 (clone RA3-6B2) | Biolegend | Cat# 103203; |
| RRID:AB_312988 | ||
|
| ||
| Biotin anti-mouse/human CD11b (clone M1/70) | Biolegend | Cat# 101203; |
| RRID:AB_312786 | ||
|
| ||
| Biotin anti-mouse CD11c (clone N418) | Biolegend | Cat# 117303; |
| RRID:AB_313772 | ||
|
| ||
| Biotin anti-mouse NK1.1 (clone PK136) | Biolegend | Cat# 108703; |
| RRID:AB_313390 | ||
|
| ||
| Biotin anti-mouse Ly-6G (clone 1A8) | Biolegend | Cat# 127603; |
| RRID:AB_1186105 | ||
|
| ||
| Biotin anti-mouse TCR β chain (clone H57-597) | Biolegend | Cat# 109203; |
| RRID:AB_313426 | ||
|
| ||
| Biotin anti-mouse TCRγ/δ (GL3) | Biolegend | Cat# 118103; |
| RRID:AB_313827 | ||
|
| ||
| Brilliant Violet 421 anti-mouse/human CD44 (clone IM7) | Biolegend | Cat# 103039; |
| RRID:AB_10895752 | ||
|
| ||
| APC anti-mouse/human IL-5 (cloneTRFK5) | Biolegend | Cat# 504306; |
| RRID:AB_315330 | ||
|
| ||
| PE anti-mouse CD11c (clone N418) | Biolegend | Cat# 117308; |
| RRID:AB_313777 | ||
|
| ||
| Brilliant Violet 421™ anti-mouse NK-1.1 (clone PK136) | Biolegend | Cat# 108741; |
| RRID:AB_2562561 | ||
|
| ||
| Brilliant Violet 421™ Streptavidin | Biolegend | Cat# 405225 |
|
| ||
| Brilliant Violet 605™ Streptavidin | Biolegend | Cat# 405229 |
|
| ||
| Anti-mouse CD45 Alexa Fluor 700 (clone 30-F11) | Thermo Fisher Scientific | Cat# 56-0451-82; |
| RRID:AB_891454 | ||
|
| ||
| Anti-mouse CD135 (Flt3) PerCP-eFluor 710 (clone A2F10) | Thermo Fisher Scientific | Cat# 46-1351-82; |
| RRID:AB_10733393 | ||
|
| ||
| Integrin alpha 4 beta 7 Monoclonal APC (clone DATK32) | Thermo Fisher Scientific | Cat# 17-5887-82; |
| RRID:AB_1210577 | ||
|
| ||
| Anti-mouse CD25 PE-Cy7 (clone PC61.5) | Thermo Fisher Scientific | Cat# 25-0251-82; |
| RRID:AB_469608 | ||
|
| ||
| Anti-mouse CD25 Alexa Fluor 700 (clone PC61.5) | Thermo Fisher Scientific | Cat# 56-0251-82; |
| RRID:AB_891422 | ||
|
| ||
| Anti-mouse CD127 PE (clone A7R34) | Thermo Fisher Scientific | Cat# 12-1271-81; |
| RRID:AB_465843 | ||
|
| ||
| Anti-mouse CD127 FITC (clone A7R34) | Thermo Fisher Scientific | Cat# 11-1271-82; |
| RRID:AB_465195 | ||
|
| ||
| Anti-mouse CD90.2 (Thy-1.2) APC-eFluor780 (clone 53-2.1) | Thermo Fisher Scientific | Cat# 47-0902-82; |
| RRID:AB_1272187 | ||
|
| ||
| Anti-mouse KLRG1 PerCP-eFluor 710 (clone 2F1) | Thermo Fisher Scientific | Cat# 46-5893-80; |
| RRID:AB_10671072 | ||
|
| ||
| Anti-mouse CD117 APC-eFluor780 (clone 2B8) | Thermo Fisher Scientific | Cat# 47-1171-82; |
| RRID:AB_1272177 | ||
|
| ||
| CD335 (NKp46) Monoclonal PE-Cy7 (clone 29A1.4) | Thermo Fisher Scientific | Cat# 25-3351-82; |
| RRID:AB_2573442 | ||
|
| ||
| CD45.1 Monoclonal PE-Cyanine5 (clone A20) | Thermo Fisher Scientific | Cat# 15-0543-82; |
| RRID:AB_468759 | ||
|
| ||
| CD45.2 Monoclonal eFluor 450 (clone 104) | Thermo Fisher Scientific | Cat# 48-0454-82; |
| RRID:AB_11042125 | ||
|
| ||
| IL-13 Monoclonal PerCP-eFluor 710 (clone eBio13A) | Thermo Fisher Scientific | Cat# 46-7133-82; |
| RRID:AB_11218496 | ||
|
| ||
| IL-13 Monoclonal PE (clone eBio13A) | Thermo Fisher Scientific | Cat# 12-7133-81; |
| RRID:AB_763561 | ||
|
| ||
| GATA-3 Monoclonal PE (clone TWAJ) | Thermo Fisher Scientific | Cat# 12-9966-42; |
| RRID:AB_1963600 | ||
|
| ||
| Ki-67 Monoclonal APC (clone SolA15) | Thermo Fisher Scientific | Cat# 17-5698-82; |
| RRID:AB_2688057 | ||
|
| ||
| Anti-mouse Ly-6A/E (Sca-1) APC (D7) | Thermo Fisher Scientific | Cat# 17-5981-82; |
| RRID:AB_469487 | ||
|
| ||
| CD278 (ICOS) Monoclonal PE-Cyanine7 (clone 7E.17G9) | Thermo Fisher Scientific | Cat# 25-9942-82; |
| RRID:AB_2573564 | ||
|
| ||
| CD4 Monoclonal FITC (GK1.5) | Thermo Fisher Scientific | Cat# 11-0041-81; |
| RRID:AB_464891 | ||
|
| ||
| Anti-Mouse CD3e APC (145-2C11) | Thermo Fisher Scientific | Cat# 17-0031-82; |
| RRID:AB_469315 | ||
|
| ||
| CD8a Monoclonal PE (clone 53-6.7) | Thermo Fisher Scientific | Cat# 12-0081-82; |
| RRID:AB_465530 | ||
|
| ||
| CD19 Monoclonal PE-Cyanine7 (clone eBio1D3(1D3)) | Thermal Fisher Scientific | Cat# 25-0193-82; |
| RRID:AB_657663 | ||
|
| ||
| CD11b Monoclonal FITC (clone M1/70) | Thermo Fisher Scientific | Cat# 11-0112-82; |
| RRID:AB_464935 | ||
|
| ||
| Ly-6G (Gr-1) Monoclonal eFluor 450 (RB6-8C5) | Thermo Fisher Scientific | Cat# 48-5931-82; |
| RRID:AB_1548788 | ||
|
| ||
| Anti-Mouse Ly-6A/E PE-CF594 (clone D7) | BD bioscience | Cat# 562730 |
|
| ||
| Anti-Mouse Siglec-F PE-CF594 (clone E50-2440) | BD bioscience | Cat# 562757; |
| RRID:AB_2687994 | ||
|
| ||
| Anti-Mouse RORγt PerCP-Cy™5.5 (clone Q31-378) | BD bioscience | Cat# 562683 |
|
| ||
| Anti-Mouse T-bet Alexa Fluor 647 (clone 04-46) | BD bioscience | Cat# 561267; |
| RRID:AB_10564093 | ||
|
| ||
| Anti-Mouse T1/ST2 Monoclonal PE (clone DJ8) | mdbioproducts | Cat# 101001PE |
|
| ||
| Anti-Mouse T1/ST2 Monoclonal FITC (clone DJ8) | mdbioproducts | Cat# 101001F; |
| RRID:AB_947549 | ||
|
| ||
| Anti-Human/Mouse HIF-1 alpha APC-conjugated (clone 241812) | R&D | Cat# IC1935A; |
| RRID:AB_ 1061580 | ||
|
| ||
| Anti-Mouse IL-17 RB APC-conjugated (clone 752101) | R&D | Cat# FAB10402A |
|
| ||
| Anti-Histone H3 (tri methyl K4)- ChIP Grade | Abcam | Cat# ab8580 |
|
| ||
| Rabbit IgG, polyclonal - Isotype Control (ChIP Grade) | Abcam | Cat# ab171870 |
|
| ||
| Chemicals, Peptides, and Recombinant Proteins
| ||
| iQ SYBR Green Supermix | Bio-Rad | Cat# 1708885 |
|
| ||
| Collagenase, Type 3 | Worthington | Cat# LS004183 |
|
| ||
| Collagenase D | Roche | Cat# 11088882001 |
|
| ||
| DNase I | Roche | Cat# 10104159001 |
|
| ||
| Recombinant mouse IL-33 (carrier-free) | Biolegend | Cat# 580506 |
|
| ||
| Recombinant mouse IL-33 | R&D | Cat# 3626-ML-010 |
|
| ||
| Recombinant Murine IL-7 | PeproTech | Cat# 217-17 |
|
| ||
| Sodium Pyruvate | Gibco | Cat# 11360070 |
|
| ||
| DMOG | Sigma-Aldrich | Cat# D3695 |
|
| ||
| 2-Deoxy-D-glucose | Sigma-Aldrich | Cat# D8375 |
|
| ||
| Shikonin | Sigma-Aldrich | Cat# S7576 |
|
| ||
| UK-5099 | Sigma-Aldrich | Cat# PZ0160 |
|
| ||
| CPI-613 | Selleck | Cat# S2776 |
|
| ||
| PX-478 | Selleck | Cat# S7612 |
|
| ||
| Golgistop | BD bioscience | Cat# 554724 |
|
| ||
| mitomycin C | Sigma-Aldrich | Cat# M4287 |
|
| ||
| Oligomycin A | Sigma-Aldrich | CAS 579-13-5 |
|
| ||
| Carbonyl cyanide-p-trifluoromethoxyphenylhydrazone (FCCP) | Sigma-Aldrich | CAS 370-86-5 |
|
| ||
| Rotenone | Sigma-Aldrich | CAS 83-79-4 |
|
| ||
| Antimycin A | Sigma-Aldrich | CAS 1397-94-0 |
|
| ||
| Fixable Viability Dye eFluor 450 | Thermo Fisher Scientific | Cat# 65-0863-14 |
|
| ||
| Nuclease micrococcal from Staphylococcus aureus (NMase) | Sigma-Aldrich | Cat# N3755 |
|
| ||
| Dynabeads® Protein A | Thermo Fisher Scientific | 10001D |
|
| ||
| Dynabeads® Protein G | Thermo Fisher Scientific | 10003D |
|
| ||
| Critical Commercial Assays
| ||
| BD Cytofix/Cytoperm Fixation/Permeabilization Solution Kit | BD bioscience | Cat# 554714 |
|
| ||
| Foxp3/Transcription Factor Staining Buffer Set | Thermo Fisher Scientific | Cat# 00-5523-00 |
|
| ||
| Lineage Cell Depletion Kit, mouse | Miltenyi Biotec | Cat# 130-110-470 |
|
| ||
| IL-13 Mouse Uncoated ELISA Kit | Thermo Fisher Scientific | Cat# 88-7137-88 |
|
| ||
| IL-5 Mouse Uncoated ELISA Kit | Thermo Fisher Scientific | Cat# 88-7054-88 |
|
| ||
| RevertAid First Strand cDNA Synthesis Kit | Thermo Fisher Scientific | Cat# K1621 |
|
| ||
| RNeasy Micro Kit | QIAGEN | Cat# 74004 |
|
| ||
| Seahorse XF Cell Mito Stress Test Kit | Agilent Technologies | 103015-100 |
|
| ||
| Seahorse XF Glycolysis Stress Test Kit | Agilent Technologies | 103020-100 |
|
| ||
| Experimental Models: Cell Lines
| ||
| OP9-DL4 stromal cell line | Sunnybrook Research Institute, Canada | N/A |
|
| ||
| Plat-E | N/A | N/A |
|
| ||
| Experimental Models: Organisms/Strains
| ||
| Mouse: C57BL6 | Jackson Laboratory | JAX: 000664 |
|
| ||
| Mouse: Rag2−/−Il2rg−/− | Dr. Z. Dong | N/A |
|
| ||
| Mouse: Vhlfl/fl | Jackson Laboratory | N/A |
|
| ||
| Mouse: Hif1afl/fl | Jackson Laboratory | N/A |
|
| ||
| Mouse: CD45.1+ | Dr. Y. Shi | N/A |
|
| ||
| Mouse: Zbtb16-cre | Dr. M. Kronenberg | N/A |
|
| ||
| Oligonucleotides
| ||
| See Table S1 for qRT-PCR primers sequences | N/A | N/A |
|
| ||
| Software and Algorithms
| ||
| Graphpad Prism 6 software | GraphPad | https://www.graphpad.com/ |
|
| ||
| FlowJo 10.0.6 software | FlowJo | https://www.flowjo.com |
|
| ||
| Other
| ||
| XF96 extracellular analyzer | Seahorse Bioscience | N/A |
In Brief.
ILC2s are critically involved in allergic responses, but the mechanisms by which they are regulated remain unclear. Li et al. demonstrate that the VHL-HIF axis is essential for ILC2 maturation and function via inhibition of glycolysis and induction of IL-33 receptor expression. These findings have implication for identifying therapeutic targets for allergic diseases.
Highlights.
VHL promotes maturation of ILC2s and lung inflammation
VHL intrinsically regulates ILC2 development
The VHL-HIF axis promotes the expression of the IL-33 receptor ST2
The PKM2-pyruvate checkpoint inhibits epigenetic modification of the ST2 gene
Acknowledgments
We thank D. Sant’Angelo for providing the original Zbtb16-cre mice, W.C. Zeng and other members of Liu lab for help and advice. This work is supported by funds from NSFC81630041, YFC0903900, YFA0505802, the Tsinghua-Peking Center for Life Sciences, and NIH RO1AI123398.
Footnotes
AUTHOR CONTRIBUTIONS
Q.L. designed and performed the experiments and analyzed the data; D.L. conducted in vitro differentiation experiments; X.Z. performed intestinal ILC2 studies; Q.W. helped in vitro experiments; W.Z. did the Seahorse and the histology experiments; M.Z. helped in vivo experiments; Z.L. did the characterization of Zbtb16-cre loci; X.Z., D.L., and C. E. did the mouse breeding and genotyping; J.H.L initially characterized ILC2s in mice; and Y.-C.L. initiated and secured funds for this project and helped with experimental design and data analysis. Q.L. and Y.-C.L. wrote the manuscript.
DECLARATION OF INTERESTS
The authors declare no competing interests
Publisher's Disclaimer: This is a PDF file of an unedited manuscript that has been accepted for publication. As a service to our customers we are providing this early version of the manuscript. The manuscript will undergo copyediting, typesetting, and review of the resulting proof before it is published in its final citable form. Please note that during the production process errors may be discovered which could affect the content, and all legal disclaimers that apply to the journal pertain.
References
- Barlow JL, Peel S, Fox J, Panova V, Hardman CS, Camelo A, Bucks C, Wu X, Kane CM, Neill DR, et al. IL-33 is more potent than IL-25 in provoking IL-13-producing nuocytes (type 2 innate lymphoid cells) and airway contraction. J Allergy Clin Immunol. 2013;132:933–941. doi: 10.1016/j.jaci.2013.05.012. [DOI] [PubMed] [Google Scholar]
- Biju MP, Neumann AK, Bensinger SJ, Johnson RS, Turka LA, Haase VH. Vhlh gene deletion induces Hif-1-mediated cell death in thymocytes. Mol Cell Biol. 2004;24:9038–9047. doi: 10.1128/MCB.24.20.9038-9047.2004. [DOI] [PMC free article] [PubMed] [Google Scholar]
- Buck MD, O’Sullivan D, Pearce EL. T cell metabolism drives immunity. The Journal of experimental medicine. 2015;212:1345–1360. doi: 10.1084/jem.20151159. [DOI] [PMC free article] [PubMed] [Google Scholar]
- Chang CH, Curtis JD, Maggi LB, Jr, Faubert B, Villarino AV, O’Sullivan D, Huang SC, van der Windt GJ, Blagih J, Qiu J, et al. Posttranscriptional control of T cell effector function by aerobic glycolysis. Cell. 2013;153:1239–1251. doi: 10.1016/j.cell.2013.05.016. [DOI] [PMC free article] [PubMed] [Google Scholar]
- Cherrier M, Sawa S, Eberl G. Notch, Id2, and RORgammat sequentially orchestrate the fetal development of lymphoid tissue inducer cells. The Journal of experimental medicine. 2012;209:729–740. doi: 10.1084/jem.20111594. [DOI] [PMC free article] [PubMed] [Google Scholar]
- Constantinides MG, McDonald BD, Verhoef PA, Bendelac A. A committed precursor to innate lymphoid cells. Nature. 2014;508:397–401. doi: 10.1038/nature13047. [DOI] [PMC free article] [PubMed] [Google Scholar]
- Dang EV, Barbi J, Yang HY, Jinasena D, Yu H, Zheng Y, Bordman Z, Fu J, Kim Y, Yen HR, et al. Control of T(H)17/T(reg) balance by hypoxia-inducible factor 1. Cell. 2011;146:772–784. doi: 10.1016/j.cell.2011.07.033. [DOI] [PMC free article] [PubMed] [Google Scholar]
- Daussy C, Faure F, Mayol K, Viel S, Gasteiger G, Charrier E, Bienvenu J, Henry T, Debien E, Hasan UA, et al. T-bet and Eomes instruct the development of two distinct natural killer cell lineages in the liver and in the bone marrow. The Journal of experimental medicine. 2014;211:563–577. doi: 10.1084/jem.20131560. [DOI] [PMC free article] [PubMed] [Google Scholar]
- Doedens AL, Phan AT, Stradner MH, Fujimoto JK, Nguyen JV, Yang E, Johnson RS, Goldrath AW. Hypoxia-inducible factors enhance the effector responses of CD8(+) T cells to persistent antigen. Nature immunology. 2013;14:1173–1182. doi: 10.1038/ni.2714. [DOI] [PMC free article] [PubMed] [Google Scholar]
- Fan X, Rudensky AY. Hallmarks of Tissue-Resident Lymphocytes. Cell. 2016;164:1198–1211. doi: 10.1016/j.cell.2016.02.048. [DOI] [PMC free article] [PubMed] [Google Scholar]
- Ganeshan K, Chawla A. Metabolic regulation of immune responses. Annual review of immunology. 2014;32:609–634. doi: 10.1146/annurev-immunol-032713-120236. [DOI] [PMC free article] [PubMed] [Google Scholar]
- Gasteiger G, Fan X, Dikiy S, Lee SY, Rudensky AY. Tissue residency of innate lymphoid cells in lymphoid and nonlymphoid organs. Science. 2015;350:981–985. doi: 10.1126/science.aac9593. [DOI] [PMC free article] [PubMed] [Google Scholar]
- Gossage L, Eisen T, Maher ER. VHL, the story of a tumour suppressor gene. Nat Rev Cancer. 2015;15:55–64. doi: 10.1038/nrc3844. [DOI] [PubMed] [Google Scholar]
- Halim TY, Hwang YY, Scanlon ST, Zaghouani H, Garbi N, Fallon PG, McKenzie AN. Group 2 innate lymphoid cells license dendritic cells to potentiate memory TH2 cell responses. Nature immunology. 2016;17:57–64. doi: 10.1038/ni.3294. [DOI] [PMC free article] [PubMed] [Google Scholar]
- Hoyler T, Klose CS, Souabni A, Turqueti-Neves A, Pfeifer D, Rawlins EL, Voehringer D, Busslinger M, Diefenbach A. The transcription factor GATA-3 controls cell fate and maintenance of type 2 innate lymphoid cells. Immunity. 2012;37:634–648. doi: 10.1016/j.immuni.2012.06.020. [DOI] [PMC free article] [PubMed] [Google Scholar]
- Huang Y, Guo L, Qiu J, Chen X, Hu-Li J, Siebenlist U, Williamson PR, Urban JF, Jr, Paul WE. IL-25-responsive, lineage-negative KLRG1(hi) cells are multipotential ’inflammatory’ type 2 innate lymphoid cells. Nature immunology. 2015;16:161–169. doi: 10.1038/ni.3078. [DOI] [PMC free article] [PubMed] [Google Scholar]
- Ishizuka IE, Chea S, Gudjonson H, Constantinides MG, Dinner AR, Bendelac A, Golub R. Single-cell analysis defines the divergence between the innate lymphoid cell lineage and lymphoid tissue-inducer cell lineage. Nature immunology. 2016 doi: 10.1038/ni.3344. [DOI] [PMC free article] [PubMed] [Google Scholar]
- Iyer NV, Kotch LE, Agani F, Leung SW, Laughner E, Wenger RH, Gassmann M, Gearhart JD, Lawler AM, Yu AY, Semenza GL. Cellular and developmental control of O2 homeostasis by hypoxia-inducible factor 1 alpha. Genes Dev. 1998;12:149–162. doi: 10.1101/gad.12.2.149. [DOI] [PMC free article] [PubMed] [Google Scholar]
- Klose CS, Artis D. Innate lymphoid cells as regulators of immunity, inflammation and tissue homeostasis. Nature immunology. 2016;17:765–774. doi: 10.1038/ni.3489. [DOI] [PubMed] [Google Scholar]
- Klose CS, Flach M, Mohle L, Rogell L, Hoyler T, Ebert K, Fabiunke C, Pfeifer D, Sexl V, Fonseca-Pereira D, et al. Differentiation of type 1 ILCs from a common progenitor to all helper-like innate lymphoid cell lineages. Cell. 2014;157:340–356. doi: 10.1016/j.cell.2014.03.030. [DOI] [PubMed] [Google Scholar]
- Lee JH, Elly C, Park Y, Liu YC. E3 Ubiquitin Ligase VHL Regulates Hypoxia-Inducible Factor-1alpha to Maintain Regulatory T Cell Stability and Suppressive Capacity. Immunity. 2015;42:1062–1074. doi: 10.1016/j.immuni.2015.05.016. [DOI] [PMC free article] [PubMed] [Google Scholar]
- Licona-Limon P, Kim LK, Palm NW, Flavell RA. TH2, allergy and group 2 innate lymphoid cells. Nature immunology. 2013;14:536–542. doi: 10.1038/ni.2617. [DOI] [PubMed] [Google Scholar]
- Maxwell PH, Wiesener MS, Chang GW, Clifford SC, Vaux EC, Cockman ME, Wykoff CC, Pugh CW, Maher ER, Ratcliffe PJ. The tumour suppressor protein VHL targets hypoxia-inducible factors for oxygen-dependent proteolysis. Nature. 1999;399:271–275. doi: 10.1038/20459. [DOI] [PubMed] [Google Scholar]
- Monticelli LA, Buck MD, Flamar AL, Saenz SA, Tait Wojno ED, Yudanin NA, Osborne LC, Hepworth MR, Tran SV, Rodewald HR, et al. Arginase 1 is an innate lymphoid-cell-intrinsic metabolic checkpoint controlling type 2 inflammation. Nature immunology. 2016;17:656–665. doi: 10.1038/ni.3421. [DOI] [PMC free article] [PubMed] [Google Scholar]
- Moro K, Kabata H, Tanabe M, Koga S, Takeno N, Mochizuki M, Fukunaga K, Asano K, Betsuyaku T, Koyasu S. Interferon and IL-27 antagonize the function of group 2 innate lymphoid cells and type 2 innate immune responses. Nature immunology. 2016;17:76–86. doi: 10.1038/ni.3309. [DOI] [PubMed] [Google Scholar]
- Palazon A, Goldrath AW, Nizet V, Johnson RS. HIF transcription factors, inflammation, and immunity. Immunity. 2014;41:518–528. doi: 10.1016/j.immuni.2014.09.008. [DOI] [PMC free article] [PubMed] [Google Scholar]
- Peng M, Yin N, Chhangawala S, Xu K, Leslie CS, Li MO. Aerobic glycolysis promotes T helper 1 cell differentiation through an epigenetic mechanism. Science. 2016;354:481–484. doi: 10.1126/science.aaf6284. [DOI] [PMC free article] [PubMed] [Google Scholar]
- Savage AK, Constantinides MG, Han J, Picard D, Martin E, Li B, Lantz O, Bendelac A. The transcription factor PLZF directs the effector program of the NKT cell lineage. Immunity. 2008;29:391–403. doi: 10.1016/j.immuni.2008.07.011. [DOI] [PMC free article] [PubMed] [Google Scholar]
- Schofield CJ, Ratcliffe PJ. Oxygen sensing by HIF hydroxylases. Nat Rev Mol Cell Biol. 2004;5:343–354. doi: 10.1038/nrm1366. [DOI] [PubMed] [Google Scholar]
- Seehus CR, Aliahmad P, de la Torre B, Iliev ID, Spurka L. The development of innate lymphoid cells requires TOX-dependent generation of a common innate lymphoid cell progenitor. 2015;16:599–608. doi: 10.1038/ni.3168. [DOI] [PMC free article] [PubMed] [Google Scholar]
- Seillet C, Rankin LC, Groom JR, Mielke LA, Tellier J, Chopin M, Huntington ND, Belz GT, Carotta S. Nfil3 is required for the development of all innate lymphoid cell subsets. The Journal of experimental medicine. 2014;211:1733–1740. doi: 10.1084/jem.20140145. [DOI] [PMC free article] [PubMed] [Google Scholar]
- Shi LZ, Wang R, Huang G, Vogel P, Neale G, Green DR, Chi H. HIF1alpha-dependent glycolytic pathway orchestrates a metabolic checkpoint for the differentiation of TH17 and Treg cells. The Journal of experimental medicine. 2011;208:1367–1376. doi: 10.1084/jem.20110278. [DOI] [PMC free article] [PubMed] [Google Scholar]
- Spits H, Artis D, Colonna M, Diefenbach A, Di Santo JP, Eberl G, Koyasu S, Locksley RM, McKenzie AN, Mebius RE, et al. Innate lymphoid cells--a proposal for uniform nomenclature. Nat Rev Immunol. 2013;13:145–149. doi: 10.1038/nri3365. [DOI] [PubMed] [Google Scholar]
- Tyrakis PA, Palazon A, Macias D, Lee KL, Phan AT, Velica P, You J, Chia GS, Sim J, Doedens A, et al. S-2-hydroxyglutarate regulates CD8+ T-lymphocyte fate. Nature. 2016;540:236–241. doi: 10.1038/nature20165. [DOI] [PMC free article] [PubMed] [Google Scholar]
- Wilhelm C, Harrison OJ, Schmitt V, Pelletier M, Spencer SP, Urban JF, Jr, Ploch M, Ramalingam TR, Siegel RM, Belkaid Y. Critical role of fatty acid metabolism in ILC2-mediated barrier protection during malnutrition and helminth infection. The Journal of experimental medicine. 2016;213:1409–1418. doi: 10.1084/jem.20151448. [DOI] [PMC free article] [PubMed] [Google Scholar]
- Wong SH, Walker JA, Jolin HE, Drynan LF, Hams E, Camelo A, Barlow JL, Neill DR, Panova V, Koch U, et al. Transcription factor RORalpha is critical for nuocyte development. Nature immunology. 2012;13:229–236. doi: 10.1038/ni.2208. [DOI] [PMC free article] [PubMed] [Google Scholar]
- Yagi R, Zhong C, Northrup DL, Yu F, Bouladoux N, Spencer S, Hu G, Barron L, Sharma S, Nakayama T, et al. The transcription factor GATA3 is critical for the development of all IL-7Ralpha-expressing innate lymphoid cells. Immunity. 2014;40:378–388. doi: 10.1016/j.immuni.2014.01.012. [DOI] [PMC free article] [PubMed] [Google Scholar]
- Yang Q, Li F, Harly C, Xing S, Ye L, Xia X, Wang H, Wang X, Yu S, Zhou X, et al. TCF-1 upregulation identifies early innate lymphoid progenitors in the bone marrow. Nature immunology. 2015;16:1044–1050. doi: 10.1038/ni.3248. [DOI] [PMC free article] [PubMed] [Google Scholar]
- Yang Q, Monticelli LA, Saenz SA, Chi AW, Sonnenberg GF, Tang J, De Obaldia ME, Bailis W, Bryson JL, Toscano K, et al. T cell factor 1 is required for group 2 innate lymphoid cell generation. Immunity. 2013;38:694–704. doi: 10.1016/j.immuni.2012.12.003. [DOI] [PMC free article] [PubMed] [Google Scholar]
- Yu Y, Tsang JC, Wang C, Clare S, Wang J, Chen X, Brandt C, Kane L, Campos LS, Lu L, et al. Single-cell RNA-seq identifies a PD-1hi ILC progenitor and defines its development pathway. Nature. 2016;539:102–106. doi: 10.1038/nature20105. [DOI] [PubMed] [Google Scholar]
- Yu Y, Wang C, Clare S, Wang J, Lee SC, Brandt C, Burke S, Lu L, He D, Jenkins NA, et al. The transcription factor Bcl11b is specifically expressed in group 2 innate lymphoid cells and is essential for their development. The Journal of experimental medicine. 2015;212:865–874. doi: 10.1084/jem.20142318. [DOI] [PMC free article] [PubMed] [Google Scholar]
- Zook EC, Ramirez K, Guo X, van der Voort G, Sigvardsson M, Svensson EC, Fu YX, Kee BL. The ETS1 transcription factor is required for the development and cytokine-induced expansion of ILC2. The Journal of experimental medicine. 2016;213:687–696. doi: 10.1084/jem.20150851. [DOI] [PMC free article] [PubMed] [Google Scholar]
Associated Data
This section collects any data citations, data availability statements, or supplementary materials included in this article.