

Summary
Although all human tissues carry out common processes, tissues are distinguished by gene expression patterns, implying that distinct regulatory programs control tissue specificity. In this study, we investigate gene expression and regulation across 38 tissues profiled in the Genotype-Tissue Expression project. We find that network edges (transcription factor to target gene connections) have higher tissue specificity than network nodes (genes) and that regulating nodes (transcription factors) are less likely to be expressed in a tissue-specific manner as compared to their targets (genes). Gene set enrichment analysis of network targeting also indicates that the regulation of tissue-specific function is largely independent of transcription factor expression. In addition, tissue-specific genes are not highly targeted in their corresponding tissue network. However, they do assume bottleneck positions due to variability in transcription factor targeting and the influence of non-canonical regulatory interactions. These results suggest that tissue specificity is driven by context-dependent regulatory paths, providing transcriptional control of tissue-specific processes.
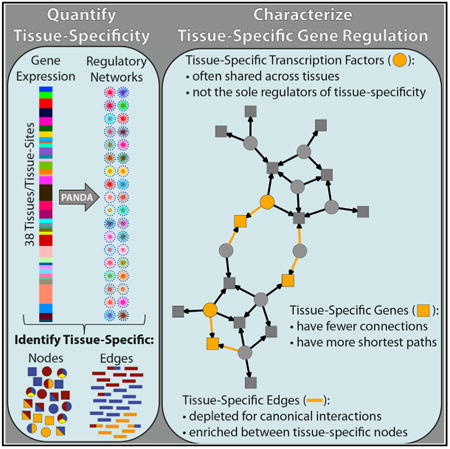
Graphical abstract
Introduction
Although all human cells carry out common processes that are essential for survival, in the physical context of their tissue environment, they also exhibit unique functions that help define their phenotype. These common and tissue-specific processes are ultimately controlled by gene regulatory networks that alter which genes are expressed and control the extent of that expression. While tissue specificity is often described based on gene expression levels, we recognize that, by themselves, individual genes, or even sets of genes, cannot adequately capture the variety of processes that distinguish different tissues. Rather, biological function requires the combinatorial involvement of multiple regulatory elements, primarily transcription factors, that work together with other genetic and environmental factors to mediate the transcription of genes and their protein products (Vaquerizas et al., 2009).
Gene regulatory network modeling provides a mathematical framework that can summarize the complex interactions among transcription factors, genes, and gene products (Barabási and Oltvai, 2004; Gerstein et al., 2012). Despite the complexity of the regulatory process, the most widely used network modeling methods are based on pairwise gene co-expression information (Zhang and Horvath, 2005; Zhang et al., 2012). While these correlation-based networks may provide some biological insight concerning the associations between both tissue-specific and other genes (Pierson et al., 2015; Yang et al., 2014), they do not explicitly model key elements of the gene regulatory process.
Passing Attributes between Networks for Data Assimilation (PANDA) is an integrative gene regulatory network inference method that models the complexity of the regulatory process, including interactions between transcription factors and their targets (Glass et al., 2013). PANDA uses a message-passing approach to optimize an initial network between transcription factors and target genes by integrating it with gene co-expression and protein-protein interaction information. In contrast to other network approaches, PANDA does not directly incorporate co-expression information between regulators and targets. Instead, edges in PANDA-predicted networks reflect the overall consistency between a transcription factor's canonical regulatory profile and its target genes' co-expression patterns. A number of studies have shown that analyzing the structure of the regulatory networks estimated by PANDA can help elucidate the regulatory context of genes and transcription factors and provide insight into the associated biological processes (Glass et al., 2014, 2015; Vargas et al., 2016).
The transcriptomic data produced by the Genotype-Tissue Expression (GTEx) consortium (Consortium, 2015) provide us with an unprecedented opportunity to investigate the complex regulatory patterns important for maintaining the diverse functional activity of genes across different tissues in the human body (Melé et al., 2015). These data include high-throughput RNA sequencing (RNA-seq) information from 551 research subjects, sampled from 51 postmortem body sites, and cell lines derived from two tissue types.
In this study, we apply PANDA to infer gene regulatory networks for 38 different tissues by integrating GTEx RNA-seq data with a canonical set of transcription factors to target gene edges and protein-protein interactions. We then use these tissue networks to identify tissue-specific regulatory interactions, to study the tissue-specific regulatory context of biological function, and to understand how tissue specificity manifests itself within the global regulatory framework. By studying the structure of these networks and comparing them between tissues, we are able to gain several important insights into tissue-specific gene regulation. Our overall approach is summarized in Figure 1.
Figure 1. Schematic Overview of Our Approach.

We characterized tissue-specific gene regulation starting with GTEx gene expression data; the relative sample size of each of the 38 tissues in the expression data is shown in the color bar. We then used PANDA to integrate this information with protein-protein interaction (PPI) and transcription factor (TF) target information, producing 38 inferred gene regulatory networks, one for each tissue. We identified tissue-specific genes, transcription factors, and regulatory network edges, and we analyzed their properties within and across these networks.
Results
Identifying Tissue-Specific Network Edges
We started by reconstructing genome-wide regulatory networks for each human tissue. We began by downloading GTEx RNA-seq data (Consortium, 2015). After filtering and quality control, these RNA-seq data included expression information for 30,243 genes measured across 9,435 samples and 38 distinct tissues (Paulson et al., 2017). For each tissue, we used PANDA to integrate gene-gene co-expression information from these data with an initial regulatory network of 644 transcription factors (Weirauch et al., 2014) and transcription factor protein-protein interactions (Szklarczyk et al., 2015). This resulted in 38 reconstructed gene regulatory networks, one for each tissue.
We used these reconstructed networks to identify just over five million tissue-specific edges (26.1% of all possible edges; Figure S1A; Table S1). We compared these tissue-specific edges with other available sources of tissue-specific network relationships (Greene et al., 2015) (see the Supplemental Experimental Procedures and Figure S2), and we found minimal overlap, indicating that these edges highlight regulatory interactions that have not been previously explored. Figure 2A shows the number of edges identified as specific in each of the 38 tissues, colored based on their multiplicity, or the number of tissues in which an edge is identified as specific. We found that the majority of tissue-specific edges (65.7%) have a multiplicity of one, meaning they are uniquely identified as specific in only a single tissue.
Figure 2. Tissue Specificity of Network Elements.

(A–C) Bar plots illustrating the number of edges (A), genes (B), and transcription factors (TFs) (C) that were identified as specific to each of the 38 GTEx tissues. The number of elements identified as specific in each tissue is shown to the right of each bar. The multiplicity of edges, genes, and TFs is indicated by the color of the bars. Note that an edge/gene/TF with a given multiplicity across all tissues (top bar plots) will appear in that number of tissue-specific bar plots (lower bar plots). See also Tables S1, S2, and S3 and Figures S1–S4.
Higher edge multiplicity is often indicative of shared regulatory processes between tissues. For example, 92.2% of sigmoid colon-specific edges have a multiplicity greater than one, meaning they are also called specific in other tissues. Further investigation (Figure S2A) indicated that 81.0%of these edges are shared with the transverse colon, 46.6% are shared with the small intestine, and 19.3% are shared with the stomach. Similarly, of those edges called specific in the basal ganglia subregion of the brain, 13.3% and 43.3% were also identified as specific in the cerebellum and other subregions of the brain, respectively.
For other tissues the composition of shared edges is quite complex. For example, 78.0% of edges identified as specific in the aorta have a multiplicity greater than one. Of these, the largest fraction is specific to the tibial artery. However, this only includes 14.9% of the aorta-specific edges; additional edges are shared with the testis (12.2%), coronary artery (11.4%), ovary (8.9%), kidney (8.0%), and other brain subregions (7.7%). This shows that, even in cases where many of the edges identified as specific in a given tissue have a high multiplicity, as a set, these edges are often distinct from the other tissues.
Identifying Tissue-Specific Network Nodes
Since most analyses of tissue specificity have examined gene expression, we wanted to know whether the patterns that we observed for the tissue-specific network edges could also be found in tissue-specific expression information. Therefore, we used the GTEx expression data to identify 12,586 tissue-specific genes (41.6% of all genes; see Figures S1B and S1C and Table S2); 558 of these genes code for transcription factors (30.6% of transcription factors in our expression data), including 222 (34.5%) of the 644 transcription factors that we used in constructing our network models (see the Supplemental Experimental Procedures and Table S3).
We found that the number of genes and transcription factors identified as tissue specific based on expression is not correlated with the number of tissue-specific edges (Figures 2B and 2C; Figure S3). We also observed much higher multiplicity levels for network nodes than for the edges (p < 10−15 for both genes and transcription factors by two-sample chi-square [χ2] test), indicating that genes and transcription factors are more likely to be identified as specific in multiple tissues than are regulatory edges.
As with the edges, node multiplicity provides insight into shared functions among the tissues. Consistent with previous findings, testis has the largest number of tissue-specific genes (Djureinovic et al., 2014; Schultz et al., 2003), and we found that many of the genes identified as specific in other tissues are also identified as specific in the testis (Figure S2B). Other shared patterns of expression mirror what we observed among the network edges. For example, genes identified as specific in the basal ganglia brain subregion include those that are also identified as specific in the cerebellum (41.1%), other brain sub-regions (67.9%), and the pituitary gland (24.6%). Similarly, 50.4% and 31.3% of sigmoid-colon-specific genes are shared with the transverse colon and the small intestine, respectively. However, these genes also include those identified as specific in the prostate (23.5%), esophagus (22.6% in the muscularis and 14.8% in the gastresophageal junction), uterus (18.3%), kidney (14.8%), vagina (13.0%), and stomach (13.0%).
The overlap of genes identified as specific in multiple tissues is quite complex, and there are many cases of shared expression patterns between tissues that are not reflected in the tissue-specific network edges we had previously identified. This is especially true for the transcription factor regulators in our network model (Figure S2C). For example, only a single transcription factor (TBX20) was identified as tissue specific in the aorta based on our expression analysis. This transcription factor (Hammer et al., 2008; Shen et al., 2013) has a high level of multiplicity, and was also identified as specific in the coronary artery, testis, pituitary, and heart (both the atrial appendage and left ventricle regions; see Table S3 and Figure S2C). We found similar patterns in many of the other tissues, including the coronary artery, subcutaneous adipose, esophagus muscularis, tibial nerve, tibial artery, and the visceral adipose. Each of these tissues has only two or three associated tissue-specific transcription factors, and almost all of these transcription factors have a multiplicity greater than one, meaning that they were identified as having relatively higher levels of expression in multiple different tissues.
Directly comparing the number of identified tissue-specific transcription factors and genes reveals that there are significantly fewer tissue-specific transcription factors than one would expect by chance (p = 2.0 × 10⁻⁴ by two-sample χ2 test). In addition, transcription factor multiplicity levels are significantly higher than those of genes (p = 1.25 × 10⁻¹⁰ by two-sample χ2 test). In other words, transcription factors are less likely to be identified as tissue specific compared to genes based on expression profiles. These results imply that tissue-specific regulation may not be due to selective differential expression of transcription factors between tissues.
It should be noted that the transcription factors we identified as tissue specific based on the GTEx expression data are substantially different than those listed in a previous publication (Vaquerizas et al., 2009) (Figure S4) and used in other GTEx network evaluations (Pierson et al., 2015). Although state of the art at the time, the data used in this previous publication contained only two samples per tissue and was based on a microarray platform that only assayed expression for a subset of the genes used in our analysis. The differences we found with this previous work highlight the importance of the GTEx project and the opportunity it gives us to revisit our understanding of the role of transcription factors in mediating tissue specificity.
Characterizing Relationships between Tissue-Specific Network Elements
We tend to think about tissue specificity in terms of gene expression. However, we know that gene expression arises from a complex set of regulatory interactions between transcription factors and their target genes. The networks inferred from the GTEx data provided us with a unique opportunity to characterize the relationship among the tissue-specific elements—edges, genes, and transcription factors—that help to define tissue phenotype and function.
To do this, we first determined the number of tissue-specific nodes (genes and transcription factors) that are connected to at least one tissue-specific edge. Overall, we found approximately 56% of tissue-specific genes are directly connected to at least one tissue-specific edge (Table S4), meaning that tissue specificity in gene expression is generally associated with tissue-specific changes in regulatory processes. In contrast, tissue-specific transcription factors are always connected to at least one tissue-specific edge, meaning that they are always associated with a tissue-specific regulatory process. In fact, we found that nearly every transcription factor is associated with at least one tissue-specific edge in all 38 tissues. This suggests that even transcription factors that are similarly expressed across tissues, and thus not identified as tissue specific, may play an important role in mediating tissue-specific regulation.
We next quantified the association of tissue-specific edges with tissue-specific nodes. We found very high enrichment for tissue-specific edges targeting tissue-specific genes, especially for the most specific edges—those with lower multiplicity values (Figure 3A). Although we also observed strong enrichment for tissue-specific edges originating from tissue-specific transcription factors (Figure 3B), this was substantially lower than the enrichment we observed between tissue-specific edges and genes.
Figure 3. Enrichment of Tissue-Specific Edges.

(A–C) The log2 of the number of observed/expected edges of different multiplicities (0 = non-tissue specific) connected to tissue-specific (TS) genes (A) and tissue-specific transcription factors (TFs) (B) or overlapping with canonical regulatory interactions (C). See also the Supplemental Experimental Procedures and Table S4.
Finally, we analyzed tissue-specific edges in the context of the input data we used to seed PANDA and reconstruct our networks. We found that tissue-specific edges are distinct from those identified using only co-expression information (Figure S2D). In addition, tissue-specific edges were depleted for canonical transcription factor interactions (Figure 3C). Thus, many of the tissue-specific regulatory interactions we identified using PANDA would have been missed if we had relied solely upon co-expression or transcription factor motif targeting information to define a regulatory network.
Evaluating Tissue-Specific Regulation of Biological Processes
As noted previously, we found that transcription factors are less likely than other genes to be identified as tissue specific based on their expression profile, and even those identified as tissue specific tended to have a high multiplicity. In addition, although tissue-specific transcription factors are significantly associated with tissue-specific network edges, this association is much lower than the one between tissue-specific genes and edges. These results led us to hypothesize that both tissue-specific and non-tissue-specific transcription factors play an important role in mediating tissue-specific biological processes.
We selected one of the brain tissue subregions (“brain other”) to test this hypothesis, since this tissue had one of the largest number of tissue-specific edges and the majority of genes and transcription factors called as specific to this tissue are also specific in other tissues (see Figure 2). We ran a pre-ranked gene set enrichment analysis (Subramanian et al., 2005) on each transcription factor's targeting profile in this tissue to evaluate the role of transcription factors in regulating particular biological processes.
Figure 4A shows the gene ontology (GO) biological process terms that were significantly enriched (false discovery rate [FDR] < 0.001; gene set enrichment analysis enrichment score [ES] > 0.65) for tissue-specific targeting by at least one transcription factor in this brain tissue subregion. These included axonogenesis, axon guidance, regulation of neurogenesis, regulation of neurotransmitter levels, and neurotransmitter secretion. We found that transcription factor regulators are generally associated with either an increased or decreased targeting of genes in these pathways. To our surprise, the transcription factors that were positively associated with brain-related functions were not any more likely to be expressed in a tissue-specific manner than transcription factors that were not positively associated with these functions.
Figure 4. Tissue-Specific Targeting in Brain.

(A) A hierarchical clustering (Euclidean distance, complete linkage) and heatmap depicting the gene set enrichment analysis results for tissue-specific targeting of all 644 transcription factors in the “brain other” gene regulatory network. FDR values for positive enrichment scores, indicating increased targeting, are shown in red; negative scores are in blue. FDR values greater than 0.25 appear in white. The top bar indicates whether a transcription factor was also identified as specific (black) to brain other or not (gray).
(B) Heatmap for the 10 most (black) and 10 least (gray) tissue-specific transcription factors.
AC, adenylate cyclase; act., activating pathway; reg., regulation; fam., family; MP, metabolic process. See also Table S5.
To ensure this result was not due to the threshold we used when identifying tissue-specific transcription factors, we selected the ten transcription factors with the highest and lowest expression enrichment in this brain tissue subregion and performed a detailed investigation of their gene set enrichment analysis profiles (Figure 4B). NEUROD2 and SP8 were the top tissue-specific transcription factors with brain function-associated targeting profiles and play important roles in brain function (Dixit et al., 2016; Ma et al., 2013; Olson et al., 2001). In addition, four of the highly non-tissue-specific transcription factors (based on expression), GRHL1, KLF15, PAX3, and TET1, had positive enrichment for targeting genes with relevant brain functions. These non-brain-specific transcription factors have been shown to play an important role in neuroblastoma (Fabian et al., 2014), neuronal differentiation (Ohtsuka et al., 2011), brain development (Mansouri et al., 2001), and neuronal cell death (Zhang et al., 2013), respectively.
Finally, we identified 38 transcription factors that exhibit highly significant (FDR < 0.001 and ES > 0.65) differential targeting of the identified functions. Only one of these transcription factors (RFX4) was also identified as tissue specific based on expression analysis. When we repeated this analysis for all 38 tissues, we found similar patterns, with low overlap between the transcription factors identified as tissue specific based on expression and those that have strong patterns of differential targeting (Figure S5; Table S5). These results indicate that transcription factors do not have to be differentially expressed to play significant tissue-specific regulatory roles. Rather, changes in their targeting patterns allow them to regulate tissue-specific biological processes.
Tissue-Specific Organization of Biological Processes
Because of the high level of transcription factor multiplicity we previously observed (see Figure 2), we next examined functional regulation based on shared tissue-specific targeting patterns across the tissues. We ran gene set enrichment analysis on the tissue-specific targeting profile of each transcription factor in each of the 38 tissues. We then clustered the identified significant associations (Clauset et al., 2004) to identify 48 communities or groups of GO terms associated with transcription factor/tissue pairs (Figure 5A; Figure S6; Table S6).
Figure 5. Tissue-Specific Targeting across All Tissues.

(A) Heatmap depicting the results from gene set enrichment analyses on targeting profiles for all possible transcription factor (TF)-tissue pairs, grouped by the community assignment of the GO terms and TF-tissue pairs.
(B) Word clouds summarizing the processes contained in each community.
(C) An illustration of the tissues associated with each community. Edge width indicates the number of transcription factors identified as differentially targeting at least one GO term in the community in a particular tissue. For simplicity, we only illustrate connections to tissues that include five or more transcription factors.
(D) Heatmap of transcription factors significantly associated with one of the nine largest communities; the grayscale gradient represents the probability that a transcription factor would be associated with a community by chance given a random shuffling of community assignments.
See also Table S6 and Figures S5 and S6.
Nine communities had more than five associated GO terms. Further inspection showed that these communities often included sets of highly related functions, such as those associated with immune response (community 1), cell proliferation (community 2), synaptic transmission (community 3), extracellular structure (community 4), cellular respiration (community 5), ectoderm development (community 6), protein modification (community 7), cellular response (community 8), and the mitochondrion (community 9).
We used word clouds to summarize this information and provide a snapshot of the functions associated with each of these communities (Figure 5B). We also examined what tissues were associated with each community, and we found that communities were generally dominated by enrichment for increased functional targeting in a select set of tissues (Figure 5C). For example, community 1 was highly associated with the tibial and coronary arteries, community 3 was highly associated with two of the brain subregions (brain other and brain basal ganglia) as well as the adrenal gland and stomach, and community 4 was highly associated with skeletal muscle as well as the kidney cortex. Although some of the communities represent sets of functions that are common to multiple tissues, these associations make biological sense. For example, some tissues, such as skin and whole blood, have higher rates of proliferation compared to others, and so we might expect increased targeting of cell cycle functions in these tissues.
The remaining 39 communities had five or fewer GO term members, but they often captured important associations between tissues and biological function. For example, community 17 contained two GO biological process term members, “spermatid development” and “spermatid differentiation,” and was enriched for positive tissue-specific targeting in the testis (12 transcription factors). Community 21 contained exactly one term member, “digestion,” and was enriched for positive tissue-specific targeting in the sigmoid colon (25 transcription factors). Community 25 also contained exactly one GO term, “hormone metabolic process,” and was enriched for positive tissue-specific targeting in the pituitary (7 transcription factors, including FEZF1, HOXA13, NRL, POU3F4, SIX3, SOX2, and SRY).
In addition to identifying tissue-specific function, we identified several transcription factors that appear to mediate similar biological functions across multiple tissues (Figure 5D). For example, community 1 (immune response) included targeting profiles from 340 different transcription factors and 23 tissues; further inspection revealed that five of these transcription factors have significantly more associations in community 1 than one would expect by chance. These transcription factors include RFX5, which plays an essential role in the regulation of the major histocompatibility complex class II (MHC class II), a key component of the adaptive immune system (Peijnenburg et al., 1999), and YY1, which was recently reported to inhibit differentiation and function of regulatory T cells (Hwang et al., 2016).
Maintenance of Tissue Specificity in the Global Regulatory Framework
The analysis we have presented thus far has focused primarily on tissue-specific network edges or regulatory interactions that have an increased likelihood in one, or a small number of tissues, compared to others. However, we know that these tissue-specific interactions work within the context of a larger global gene regulatory network, much of which is the same in many tissues. Therefore, we investigated how tissue-specific regulatory processes are reflected in changes to the overall structure and organization of each tissue's global gene regulatory network.
To begin, we analyzed the connectivity of nodes separately in each of the 38 tissues' gene regulatory networks using two measures: (1) degree, or the number of edges connected to a node; and (2) betweenness (Girvan and Newman, 2002), or the number of shortest paths passing through a node (Figure 6A). Although both of these measures are well established in the field of network science, betweenness in particular has only occasionally been used to analyze biological networks (Pierson et al., 2015; Yu et al., 2007), and it has not been used to assess tissue-specific gene regulatory networks.
Figure 6. Centrality of Genes in Tissue-Specific Networks.

(A) An example network illustrating the difference between high degree and betweenness. Transcription factors are shown as circles and target genes as squares. The color of each node indicates its centrality. An example node is shown with low degree but high betweenness.
(B) Difference in the median centrality of tissue-specific (TS) genes compared to non-tissue-specific genes in each of the 38 networks.
(C) Distribution of centrality values for all non-tissue-specific genes (black), genes specific in a particular tissue (red), and genes called tissue specific in some tissue, but not the tissue of interest (gray dashed line).
See also Figure S7.
For each tissue, we compared the median degree and betweenness values of tissue-specific genes to the median degree and betweenness values of non-tissue-specific genes (Figure 6B). This analysis showed that tissue-specific genes generally have a lower degree than non-tissue-specific genes. This may initially seem contradictory to our observation that tissue-specific genes are highly targeted by tissue-specific edges (Figure 3A). However, we also found that tissue-specific edges tended to be associated with non-canonical regulatory events (Figure 3C), which generally have lower weights in our network models. The analysis presented here considers all regulatory interactions (both tissue-specific and non-tissue-specific) leading to a network whose structure is largely dominated by canonical regulatory events. Thus, we can conclude that tissue-specific genes gain targeting from tissue-specific edges, consistent with our previous finding. However, in the context of the global gene regulatory network, the targeting of these tissue-specific genes is much lower as compared to other, non-tissue-specific genes.
These findings are consistent with the notion that processes required for a large number of (or all) tissues need to be stably regulated. Thus, one might expect these to be more tightly controlled and, therefore, central to the network. Indeed, when we examined the distributions of degree values (Figure 6C), we found the largest differences are between tissue-specific and non-tissue-specific genes with high degree (network hubs), with a bias for non-tissue-specific genes to have high degree values. In other words, we observed a depletion of tissue-specific genes among the gene regulatory network hubs.
Our analysis also showed that tissue-specific genes have higher median betweenness compared to non-tissue-specific genes. This indicates that tissue-specific function may be mediated by tissue-specific regulatory paths through the global network structure, creating new avenues by which information can flow through tissue-specific genes (as measured by betweenness), despite their relatively low overall connectivity (as measured by degree). Indeed, when we examined the distribution of betweenness values (Figure 6C), we found that tissue-specific genes are significantly enriched for small but measurable values, while non-tissue-specific genes are more likely to have no shortest paths running through them (p < 10−15 by one-sided Kolmogorov-Smirnov test). The signals we observed here are absent in a network constructed solely based on canonical transcription factor-target gene interactions (Figure S7), suggesting that these regulatory paths are most likely the result of the inclusion of tissue-specific edges in the global regulatory network structure.
Implications of Tissue-Specific Regulation
One important reason for modeling tissue-specific regulatory networks is to provide a baseline that can be used to better understand how regulatory processes might be perturbed by disease or in the presence of other biological factors, such as a genetic variant (Boyle et al., 2017). To evaluate the utility of our tissue-specific networks in the context of this type of information, we leveraged tissue-specific, cis-acting expression quantitative trait loci (eQTLs) that we had previously identified using the GTEx data (Fagny et al., 2017), together with information from genome-wide association studies (GWASes) curated in the GWAS catalog. For this analysis, we focused on 19 tissues for which we had reliable estimates of cis-eQTLs and the 29,155 genes that were considered when performing the eQTL analysis and included in our network models.
To begin, for each tissue, we identified which genes had at least one significant (FDR < 0.05) eQTL association. 25,819 genes (88.6%) had at least one eQTL association in at least one of the tissues (from 3,317 in brain other to 10,997 in thyroid). As a group, these QTL-associated genes were significantly enriched for transcription factors (p = 9.09 × 10⁻⁵ by hypergeometric probability) but significantly depleted for tissue-specific genes (p < 10−15 by hypergeometric probability). However, when we evaluated whether genes that are specific to a particular tissue are also more likely to have an eQTL association in that same tissue, we observed a significant enrichment (p = 1.69 × 10⁻¹⁴ by hypergeometric probability). This indicates that, although tissue-specific genes as a group are less likely to have associations with genetic variants, when they do, it is within the context of their tissue environment.
Next, to understand if these findings might have disease relevance, we focused on the subset of genes that had a significant cis-eQTL association with one of the genetic variants listed in the GWAS catalog. Only 308 genes (1%) had one or more eQTL associations with a GWAS variant (Table S7). Of these 308 genes, only 39 (12.7%) were also identified as tissue specific (significantly depleted; p = 1.51 × 10⁻⁴ by hypergeometric probability). In contrast to the QTL-associated genes, the GWAS-associated subset was neither enriched nor depleted for transcription factors. In addition, when we investigated whether the eQTL associations for these genes tended to occur in the same tissue in which those genes were identified as specific, we observed significant depletion (p = 5.46 × 10⁻⁴ by hypergeometric probability).
Finally, to understand how these findings might be reflected in the context of our gene regulatory networks, we evaluated the centralities of these genes, both within the tissue for which they had the identified association(s) and across all other tissues (those in which they did not have any significant eQTL associations). Specifically, we ranked genes in each tissue based on their centrality, and we found the median rank of the QTL-associated and GWAS-QTL-associated genes in both the tissue where they had a significant association and in each of the other tissues. We plotted the range of these median values across the 19 examined tissues in Figure 7.
Figure 7. Centrality of eQTL-Associated Genes.

(A and B) The median (dot) and interquartile range (error bar) across tissues of the percentile rank of genes based on their degree (A) or betweenness (B) centralities, as in Figure 6C, plotted separately for genes that have an eQTL association (1) in that tissue (QTLs-in-tissue), (2) with a GWAS variant in that tissue (GWAS-QTLs-in-tissue), (3) in another tissue (QTLs-in-other), or (4) with a GWAS variant in another tissue (GWAS-QTLs-in-other). For comparison, the median rank of tissue-specific and non-tissue-specific genes across these tissues is indicated by red and black lines, respectively. Note that this analysis is limited to 19 tissues and 29,155 genes. See also Table S7.
We saw a clear signal for variant-associated genes in both their degree and betweenness. In particular, genes that are associated with a GWAS variant have a lower degree and higher betweenness in their corresponding tissue network as compared to the set of genes that has any eQTL association in that tissue. Furthermore, this behavior is distinct in their corresponding tissue network as opposed to other tissue networks. We noted that this increase in betweenness coupled with a decrease in degree is exactly the same pattern as the one we observed for tissue-specific genes. However, interestingly, as we noted above, GWAS-QTL-associated genes are highly depleted for tissue specificity. This may help explain why many GWAS loci are associated with multiple diseases. It also suggests that our network models are capturing important routes of regulatory information flow beyond those necessary for the maintenance of tissue-specific processes and, thus, have the potential to be used to understand disease-related regulatory information.
Discussion
We used gene expression data from GTEx, together with other sources of regulatory information, to reconstruct and characterize regulatory networks for 38 tissues and to assess tissue-specific gene regulation. We used these networks to identify tissue-specific edges, and we used the gene expression data to identify tissue-specific nodes (transcription factors and genes). We found that, although tissue-specific edges are enriched for connections to tissue-specific transcription factors and genes, they are also depleted for canonical interactions (defined based on a transcription factor-binding site in the target gene's promoter). In addition, edges are often uniquely called as specific in only one tissue while tissue-specific genes often have a high multiplicity, meaning that they were identified as specific in more than one tissue.
In particular, we found that genes that encode for transcription factors were especially likely to be identified as specific in multiple different tissues. This suggests that the notion of a tissue-specific transcription factor based on expression information should be considered with care, especially in the context of transcriptional regulation. Indeed, analysis of tissue-specific targeting patterns in our regulatory networks indicated that transcription factor expression is not the primary driver of tissue-specific functions. Our network analysis found many transcription factors that are known to be involved in important tissue-specific biological processes that were not identified as tissue specific based on their expression profiles. These findings are consistent with what we might expect (Neph et al., 2012). There are approximately 30,000 genes in the human genome, but fewer than 2,000 of these encode transcription factors (Vaquerizas et al., 2009) (of which we analyzed only 644, those with high-quality motif information). Given the large number of tissue-specific functions that must be regulated, it makes sense that changes in complex regulatory patterns are responsible for tissue-specific gene expression, not the activation or deactivation of individual regulators.
Our results suggest that transcription factors primarily participate in tissue-specific regulatory processes via alterations in their targeting patterns. To understand the regulatory context of these tissue-specific alterations, we investigated the topology of each of the 38 global tissue regulatory networks (containing information for all possible edges). We found that tissue-specific genes generally are less targeted (have a lower degree) than non-tissue-specific genes. However, tissue-specific genes exhibit an increase in the number of regulatory paths running through them (have a higher betweenness) as compared to non-tissue-specific genes. These results suggest that tissue-specific regulation does not occur in dense portions of the regulatory network or by the formation of tissue-specific hubs. Rather, tissue-specific genes are central to the regulatory network on an intermediate scale due to the influence of tissue-specific regulatory paths (Granovetter, 1973). We believe this result supports the notion that tissue-specific function is largely driven by non-canonical interactions. Such interactions could, for example, be interactions through transcription factor complexes (no direct binding between a transcription factor to the promoter of its target gene), binding of a transcription factor to an alternative motif, or interactions outside of a gene's promoter (for example, binding to an enhancer) (Fedorova and Zink, 2008).
Overall, our analysis provides a more comprehensive picture of tissue-specific regulatory processes than reported previously. Our comparison of global gene regulatory network models across a large set of human tissues provided important insights into the complex regulatory connections between genes and transcription factors, allowed us to identify how those structures are subtly different in each tissue, and ultimately led us to better understand how transcription factors regulate tissue-specific biological processes. One important result from our analysis is that transcription factor expression information is very poorly correlated with tissue-specific regulation of key biological functions. At the same time, we found that alterations in transcription factor targeting cause a shift in the structure of each tissue's regulatory network, such that tissue-specific genes occupy central positions by virtue of tissue-specific regulatory paths that run through the global network structure.
Taken together, these results support the notion that tissue specificity likely arises from adjusting and adapting existing biological processes. In other words, tissue-specific biological function occurs as a result of building on an existing regulatory structure such that both common and tissue-specific processes share the same underlying network core. Ultimately, our work suggests that regulatory processes need to be analyzed in the context of specific tissues, particularly if we hope to understand disease and development, to develop more effective drug therapies and to understand the potential side effects of drugs outside of the target tissue. It also establishes a framework in which to think about the evolution of tissue-specific functions, one in which new processes are integrated into an established gene regulatory framework.
Experimental Procedures
GTEx Data
We downloaded the GTEx version 6.0 RNA-seq and genotype data (phs000424.v6.p1, 2015-10-05 released) from database of Genotypes and Phenotypes (dbGaP; approved protocol 9112). GTEx release version 6.0 sampled 551 donors with phenotypic information and included 9,590 RNA-seq assays (Consortium, 2015).
RNA-Seq Normalization
We used YARN (https://bioconductor.org/packages/release/bioc/html/yarn.html) to perform quality control, gene filtering, and normalization preprocessing on the GTEx RNA-seq data, as described in (Paulson et al., 2017). Briefly, this pipeline tested for sample sex-misidentification, merged related sub-tissues, performed tissue-aware normalization using qsmooth (Hicks et al., 2017), and resulted in a dataset of 9,435 gene expression profiles assaying 30,333 genes in 38 tissues from 549 individuals.
eQTL Identification
19 of the 38 tissues contained gene expression samples from at least 150 distinct individuals with imputed genetic data. We identified tissue-specific, cis-acting eQTLs for these tissues, as described in Fagny et al. (2017). Briefly, for each tissue, we identified SNPs that had a minor allele frequency greater than 0.05. We then used Matrix eQTL (Shabalin, 2012) to quantify the statistical association of the expression of 29,155 autosomal genes with these genetic variants based on a cis-acting window of 1 Mb, and we adjusted for sex, age, and the three first principal components obtained using the genotyping data.
Transcription Factor Motif Information
We downloaded Homo sapiens transcription factor motifs with direct/inferred evidence from the Catalog of Inferred Sequence Binding Preferences (http://cisbp.ccbr.utoronto.ca/, accessed July 7, 2015). For each transcription factor, we selected the motif with the highest information content, and we mapped its position weight matrix to the human genome (hg19) using the Find Individual Motif Occurrences program (Grant et al., 2011). We retained significant hits (p < 10−5) that occurred within the promoter ([−750, +250] around the transcriptional start site) of Ensembl genes (GRCh37.p13; annotations from https://genome.ucsc.edu/cgi-bin/hgTables, accessed September 3, 2015). We intersected this map with the expression data, resulting in a set of canonical regulatory interactions from 644 transcription factors to 30,243 genes, which we used to construct our regulatory network models.
Prior Protein-Protein Interaction Data
A protein-protein interaction network between transcription factors in our motif prior was constructed based on interaction scores from StringDb version (v.)10 (https://string-db.org, accessed October 27, 2015).
PANDA
We used PANDA (Glass et al., 2013) to combine information from gene expression, protein-protein interaction, and transcription factor regulatory data and to estimate gene regulatory networks in each of the 38 GTEx tissues. PANDA returns a complete, bipartite network with edge weights similar to Z scores. To avoid issues related to calculating centrality measures on graphs with negative edge weights, we created a transformed version of these Z scores:
| Equation (1) |
where is the edge weight calculated by PANDA between a transcription factor (i) and gene (j) in a particular tissue (t).
Tissue-Specific Edges
To identify tissue-specific network edges, we compared the weight of an edge between a transcription factor (i) and a gene (j) in a particular tissue (t) to the median and interquartile range (IQR) of its weight across all 38 tissues:
| Equation (2) |
We defined an edge with a specificity score as specific to tissue t and the multiplicity of an edge as:
| Equation (3) |
Tissue-Specific Nodes
To identify tissue-specific network nodes, we compared the median expression level ( ) of a gene (j) in a particular tissue (t) to the median and IQR of its expression across all samples:
| Equation (4) |
We defined a gene with a specificity score as specific to tissue t and the multiplicity of a gene as:
| Equation (5) |
Gene Set Enrichment Analysis
We quantified each transcription factor's (i) targeting profile in a given tissue (t) as (see Equation 2), and we ran a pre-ranked gene set enrichment analysis (Subramanian et al., 2005) on this profile to test for enrichment in GO terms. We selected highly significant, positively enriched associations (FDR < 1 × 10⁻³ and ES > 0.65) from these analyses, and we used a community structure detection algorithm (Clauset et al., 2004) to cluster these data and identify 48 communities or sets of GO terms associated with transcription factor-tissue pairs.
Network Centralities
We used the igraph v.1.0.0 package in R to calculate the degree (using the graph.strength() function) and betweenness centrality (using the betweenness() function) of genes in the 38 complete, weighted PANDA tissue networks (based on transformed edge weights, see Equation 1). For the betweenness centrality, we used as the cost and treated edges as undirected.
Data and Software Availability
Data and code to reconstruct the networks can be found at https://sites.google.com/a/channing.harvard.edu/kimberlyglass/tools/gtex-networks. The reconstructed networks are also available on Zenodo https://zenodo.org/record/838734 (Sonawane et al., 2017).
Supplementary Material
Highlights.
Regulatory network connections are more tissue specific than nodes (genes and transcription factors)
Tissue-specific function is not solely regulated by transcription factor expression
Tissue-specific genes assume bottleneck positions in their corresponding networks
Tissue specificity is driven by context-dependent, non-canonical regulatory paths
Acknowledgments
This work was supported by grants from the National Institutes of Health, including grants from the National Heart, Lung, and Blood Institute (5P01HL105339, 5R01HL111759, 5P01HL114501, and K25HL133599), the National Cancer Institute (5P50CA127003, 1R35CA197449, 1U01CA190234, 5P30CA006516, and P50CA165962), and the National Institute of Allergy and Infectious Diseases (5R01AI099204) and from the Charles A. King Trust Postdoctoral Research Fellowship Program, Sara Elizabeth O'Brien Trust, Bank of America, N.A., Co-Trustees. Additional funding was provided by grant No.2014-133322 (3953) from the NVIDIA Foundation. This work was conducted under dbGaP-approved protocol 9112 (accession phs000424.v6.p1).
Footnotes
Author Contributions: Conceptualization, J.Q., K.G., and M.L.K.; Methodology, A.R.S., J.N.P., K.G., and M.L.K.; Formal Analysis, A.R.S., K.G., and M.L.K.; Investigation, A.R.S., K.G., and M.L.K.; Resources, J.Q. and K.G.; Data Curation, J.N.P. and J.Q.; Writing – Original Draft, A.R.S., K.G., and M.L.K.; Writing – Review & Editing, A.R.S., J.P., M.F., C.-Y.C., J.N.P., C.M.L.-R., D.L.D., J.Q., K.G., and M.L.K; Visualization, A.R.S., K.G., and M.L.K.; Supervision, J.Q., K.G., and M.L.K.; Funding Acquisition, J.Q., K.G., and M.L.K.
Supplemental Information: Supplemental Information includes Supplemental Experimental Procedures, seven figures, and seven tables and can be found with this article online at https://doi.org/10.1016/j.celrep.2017.10.001.
References
- Barabási AL, Oltvai ZN. Network biology: understanding the cell's functional organization. Nat Rev Genet. 2004;5:101–113. doi: 10.1038/nrg1272. [DOI] [PubMed] [Google Scholar]
- Boyle EA, Li YI, Pritchard JK. An Expanded View of Complex Traits: From Polygenic to Omnigenic. Cell. 2017;169:1177–1186. doi: 10.1016/j.cell.2017.05.038. [DOI] [PMC free article] [PubMed] [Google Scholar]
- Clauset A, Newman MEJ, Moore C. Finding community structure in very large networks. Phys Rev E. 2004;70:066111. doi: 10.1103/PhysRevE.70.066111. [DOI] [PubMed] [Google Scholar]
- Consortium, G.T.; GTEx Consortium. Human genomics The Genotype-Tissue Expression (GTEx) pilot analysis:multitissue gene regulation in humans. Science. 2015;348:648–660. doi: 10.1126/science.1262110. [DOI] [PMC free article] [PubMed] [Google Scholar]
- Dixit AB, Banerjee J, Srivastava A, Tripathi M, Sarkar C, Kakkar A, Jain M, Chandra PS. RNA-seq analysis of hippocampal tissues reveals novel candidate genes for drug refractory epilepsy in patients with MTLE-HS. Genomics. 2016;107:178–188. doi: 10.1016/j.ygeno.2016.04.001. [DOI] [PubMed] [Google Scholar]
- Djureinovic D, Fagerberg L, Hallström B, Danielsson A, Lindskog C, Uhlén M, Pontén F. The human testis-specific proteome defined by transcriptomics and antibody-based profiling. Mol Hum Reprod. 2014;20:476–488. doi: 10.1093/molehr/gau018. [DOI] [PubMed] [Google Scholar]
- Fabian J, Lodrini M, Oehme I, Schier MC, Thole TM, Hielscher T, Kopp-Schneider A, Opitz L, Capper D, von Deimling A, et al. GRHL1 acts as tumor suppressor in neuroblastoma and is negatively regulated by MYCN and HDAC3. Cancer Res. 2014;74:2604–2616. doi: 10.1158/0008-5472.CAN-13-1904. [DOI] [PubMed] [Google Scholar]
- Fagny M, Paulson JN, Kuijjer ML, Sonawane AR, Chen CY, Lopes-Ramos CM, Glass K, Quackenbush J, Platig J. Exploring regulation in tissues with eQTL networks. Proc Natl Acad Sci USA. 2017;114:E7841–E7850. doi: 10.1073/pnas.1707375114. [DOI] [PMC free article] [PubMed] [Google Scholar]
- Fedorova E, Zink D. Nuclear architecture and gene regulation. Biochim Biophys Acta. 2008;1783:2174–2184. doi: 10.1016/j.bbamcr.2008.07.018. [DOI] [PubMed] [Google Scholar]
- Gerstein MB, Kundaje A, Hariharan M, Landt SG, Yan KK, Cheng C, Mu XJ, Khurana E, Rozowsky J, Alexander R, et al. Architecture of the human regulatory network derived from ENCODE data. Nature. 2012;489:91–100. doi: 10.1038/nature11245. [DOI] [PMC free article] [PubMed] [Google Scholar]
- Girvan M, Newman ME. Community structure in social and biological networks. Proc Natl Acad Sci USA. 2002;99:7821–7826. doi: 10.1073/pnas.122653799. [DOI] [PMC free article] [PubMed] [Google Scholar]
- Glass K, Huttenhower C, Quackenbush J, Yuan GC. Passing messages between biological networks to refine predicted interactions. PLoS ONE. 2013;8:e64832. doi: 10.1371/journal.pone.0064832. [DOI] [PMC free article] [PubMed] [Google Scholar]
- Glass K, Quackenbush J, Silverman EK, Celli B, Rennard SI, Yuan GC, DeMeo DL. Sexually-dimorphic targeting of functionally-related genes in COPD. BMC Syst Biol. 2014;8:118. doi: 10.1186/s12918-014-0118-y. [DOI] [PMC free article] [PubMed] [Google Scholar]
- Glass K, Quackenbush J, Spentzos D, Haibe-Kains B, Yuan GC. A network model for angiogenesis in ovarian cancer. BMC Bioinformatics. 2015;16:115. doi: 10.1186/s12859-015-0551-y. [DOI] [PMC free article] [PubMed] [Google Scholar]
- Granovetter MS. The Strength of Weak Ties. Am J Sociol. 1973;78:1360–1380. [Google Scholar]
- Grant CE, Bailey TL, Noble WS. FIMO: scanning for occurrences of a given motif. Bioinformatics. 2011;27:1017–1018. doi: 10.1093/bioinformatics/btr064. [DOI] [PMC free article] [PubMed] [Google Scholar]
- Greene CS, Krishnan A, Wong AK, Ricciotti E, Zelaya RA, Himmel-stein DS, Zhang R, Hartmann BM, Zaslavsky E, Sealfon SC, et al. Understanding multicellular function and disease with human tissue-specific networks. Nat Genet. 2015;47:569–576. doi: 10.1038/ng.3259. [DOI] [PMC free article] [PubMed] [Google Scholar]
- Hammer S, Toenjes M, Lange M, Fischer JJ, Dunkel I, Mebus S, Grimm CH, Hetzer R, Berger F, Sperling S. Characterization of TBX20 in human hearts and its regulation by TFAP2. J Cell Biochem. 2008;104:1022–1033. doi: 10.1002/jcb.21686. [DOI] [PubMed] [Google Scholar]
- Hicks SC, Okrah K, Paulson JN, Quackenbush J, Irizarry RA, Bravo HC. Smooth quantile normalization. bioRxiv. 2017 doi: 10.1093/biostatistics/kxx028. https://doi.org/10.1101/085175. [DOI] [PMC free article] [PubMed]
- Hwang SS, Jang SW, Kim MK, Kim LK, Kim BS, Kim HS, Kim K, Lee W, Flavell RA, Lee GR. YY1 inhibits differentiation and function of regulatory T cells by blocking Foxp3 expression and activity. Nat Commun. 2016;7:10789. doi: 10.1038/ncomms10789. [DOI] [PMC free article] [PubMed] [Google Scholar]
- Ma T, Wang C, Wang L, Zhou X, Tian M, Zhang Q, Zhang Y, Li J, Liu Z, Cai Y, et al. Subcortical origins of human and monkey neocortical interneurons. Nat Neurosci. 2013;16:1588–1597. doi: 10.1038/nn.3536. [DOI] [PubMed] [Google Scholar]
- Mansouri A, Pla P, Larue L, Gruss P. Pax3 acts cell autonomously in the neural tube and somites by controlling cell surface properties. Development. 2001;128:1995–2005. doi: 10.1242/dev.128.11.1995. [DOI] [PubMed] [Google Scholar]
- Melé M, Ferreira PG, Reverter F, DeLuca DS, Monlong J, Sammeth M, Young TR, Goldmann JM, Pervouchine DD, Sullivan TJ, et al. GTEx Consortium. Human genomics The human transcriptome across tissues and individuals. Science. 2015;348:660–665. doi: 10.1126/science.aaa0355. [DOI] [PMC free article] [PubMed] [Google Scholar]
- Neph S, Stergachis AB, Reynolds A, Sandstrom R, Borenstein E, Stamatoyannopoulos JA. Circuitry and dynamics of human transcription factor regulatory networks. Cell. 2012;150:1274–1286. doi: 10.1016/j.cell.2012.04.040. [DOI] [PMC free article] [PubMed] [Google Scholar]
- Ohtsuka T, Shimojo H, Matsunaga M, Watanabe N, Kometani K, Minato N, Kageyama R. Gene expression profiling of neural stem cells and identification of regulators of neural differentiation during cortical development. Stem Cells. 2011;29:1817–1828. doi: 10.1002/stem.731. [DOI] [PubMed] [Google Scholar]
- Olson JM, Asakura A, Snider L, Hawkes R, Strand A, Stoeck J, Hallahan A, Pritchard J, Tapscott SJ. NeuroD2 is necessary for development and survival of central nervous system neurons. Dev Biol. 2001;234:174–187. doi: 10.1006/dbio.2001.0245. [DOI] [PubMed] [Google Scholar]
- Paulson JN, Chen CY, Lopes-Ramos CM, Kuijjer ML, Platig J, Sonawane AR, Fagny M, Glass K, Quackenbush J. Tissue-aware RNA-Seq processing and normalization for heterogeneous and sparse data. BMC Bioinformatics. 2017;18:437. doi: 10.1186/s12859-017-1847-x. [DOI] [PMC free article] [PubMed] [Google Scholar]
- Peijnenburg A, Van Eggermond MC, Van den Berg R, Sanal O, Vossen JM, Van den Elsen PJ. Molecular analysis of an MHC class II deficiency patient reveals a novel mutation in the RFX5 gene. Immunogenetics. 1999;49:338–345. doi: 10.1007/s002510050501. [DOI] [PubMed] [Google Scholar]
- Pierson E, Koller D, Battle A, Mostafavi S, Ardlie KG, Getz G, Wright FA, Kellis M, Volpi S, Dermitzakis ET GTEx Consortium. Sharing and Specificity of Co-expression Networks across 35 Human Tissues. PLoS Comput Biol. 2015;11:e1004220. doi: 10.1371/journal.pcbi.1004220. [DOI] [PMC free article] [PubMed] [Google Scholar]
- Schultz N, Hamra FK, Garbers DL. A multitude of genes expressed solely in meiotic or postmeiotic spermatogenic cells offers a myriad of contraceptive targets. Proc Natl Acad Sci USA. 2003;100:12201–12206. doi: 10.1073/pnas.1635054100. [DOI] [PMC free article] [PubMed] [Google Scholar]
- Shabalin AA. Matrix eQTL: ultra fast eQTL analysis via large matrix operations. Bioinformatics. 2012;28:1353–1358. doi: 10.1093/bioinformatics/bts163. [DOI] [PMC free article] [PubMed] [Google Scholar]
- Shen T, Yang C, Ding L, Zhu Y, Ruan Y, Cheng H, Qin W, Huang X, Zhang H, Man Y, et al. Tbx20 functions as an important regulator of estrogen-mediated cardiomyocyte protection during oxidative stress. Int J Cardiol. 2013;168:3704–3714. doi: 10.1016/j.ijcard.2013.06.018. [DOI] [PubMed] [Google Scholar]
- Sonawane AR, Platig J, Fagny M, Chen CY, Paulson JN, Lopes-Ramos CM, DeMeo DL, Quackenbush J, Glass K, Kuijjer ML. Gene regulatory networks for 38 human tissues. Zenodo. 2017 doi: 10.1016/j.celrep.2020.107795. https://doi.org/10.5281/zenodo.838734. [DOI] [PMC free article] [PubMed]
- Subramanian A, Tamayo P, Mootha VK, Mukherjee S, Ebert BL, Gillette MA, Paulovich A, Pomeroy SL, Golub TR, Lander ES, Mesirov JP. Gene set enrichment analysis: a knowledge-based approach for interpreting genome-wide expression profiles. Proc Natl Acad Sci USA. 2005;102:15545–15550. doi: 10.1073/pnas.0506580102. [DOI] [PMC free article] [PubMed] [Google Scholar]
- Szklarczyk D, Franceschini A, Wyder S, Forslund K, Heller D, Huerta-Cepas J, Simonovic M, Roth A, Santos A, Tsafou KP, et al. STRING v10: protein-protein interaction networks, integrated over the tree of life. Nucleic Acids Res. 2015;43:D447–D452. doi: 10.1093/nar/gku1003. [DOI] [PMC free article] [PubMed] [Google Scholar]
- Vaquerizas JM, Kummerfeld SK, Teichmann SA, Luscombe NM. A census of human transcription factors: function, expression and evolution. Nat Rev Genet. 2009;10:252–263. doi: 10.1038/nrg2538. [DOI] [PubMed] [Google Scholar]
- Vargas AJ, Quackenbush J, Glass K. Diet-induced weight loss leads to a switch in gene regulatory network control in the rectal mucosa. Genomics. 2016;108:126–133. doi: 10.1016/j.ygeno.2016.08.001. [DOI] [PMC free article] [PubMed] [Google Scholar]
- Weirauch MT, Yang A, Albu M, Cote AG, Montenegro-Montero A, Drewe P, Najafabadi HS, Lambert SA, Mann I, Cook K, et al. Determination and inference of eukaryotic transcription factor sequence specificity. Cell. 2014;158:1431–1443. doi: 10.1016/j.cell.2014.08.009. [DOI] [PMC free article] [PubMed] [Google Scholar]
- Yang Y, Han L, Yuan Y, Li J, Hei N, Liang H. Gene co-expression network analysis reveals common system-level properties of prognostic genes across cancer types. Nat Commun. 2014;5:3231. doi: 10.1038/ncomms4231. [DOI] [PMC free article] [PubMed] [Google Scholar]
- Yu H, Kim PM, Sprecher E, Trifonov V, Gerstein M. The importance of bottlenecks in protein networks: correlation with gene essentiality and expression dynamics. PLoS Comput Biol. 2007;3:e59. doi: 10.1371/journal.pcbi.0030059. [DOI] [PMC free article] [PubMed] [Google Scholar]
- Zhang B, Horvath S. A general framework for weighted gene co-expression network analysis. Stat Appl Genet Mol Biol. 2005;4 doi: 10.2202/1544-6115.1128. Article 17. [DOI] [PubMed] [Google Scholar]
- Zhang J, Lu K, Xiang Y, Islam M, Kotian S, Kais Z, Lee C, Arora M, Liu HW, Parvin JD, Huang K. Weighted frequent gene co-expression network mining to identify genes involved in genome stability. PLoS Comput Biol. 2012;8:e1002656. doi: 10.1371/journal.pcbi.1002656. [DOI] [PMC free article] [PubMed] [Google Scholar]
- Zhang RR, Cui QY, Murai K, Lim YC, Smith ZD, Jin S, Ye P, Rosa L, Lee YK, Wu HP, et al. Tet1 regulates adult hippocampal neurogenesis and cognition. Cell Stem Cell. 2013;13:237–245. doi: 10.1016/j.stem.2013.05.006. [DOI] [PMC free article] [PubMed] [Google Scholar]
Associated Data
This section collects any data citations, data availability statements, or supplementary materials included in this article.