Abstract
Diabetic retinopathy is an important cause of blindness in the adult population1,2 and is characterized by a progressive loss of vascular cells and slow dissolution of inter-vascular junctions resulting in vascular leak and retinal edema3. Later stages of the disease are characterized by inflammatory cell infiltration, tissue destruction and neovascularization4,5. Here we identify the soluble epoxide hydrolase (sEH) as a key enzyme that initiates the pericyte “drop off” and loss of endothelial barrier function by generating a diol from docosahexaenoic acid (DHA) i.e. 19,20-dihydroxydocosapentaenoic acid (19,20-DHDP). The expression of the sEH and the accumulation of 19,20-DHDP were elevated in diabetic murine and human retinas as well as in human vitreous. Mechanistically, the diol targeted the cell membrane to alter the localisation of cholesterol-binding proteins, and interfered with the association of presenilin 1 (PS1) with N-cadherin and VE-cadherin to compromise pericyte-endothelial cell as well as inter-endothelial cell junctions. Treating diabetic mice with a specific sEH inhibitor prevented the pericyte loss and vascular permeability that are characteristic of non-proliferative diabetic retinopathy. Overexpression of the sEH in the retinal Müller glial cells of non-diabetic mice, on the other hand, resulted in vessel abnormalities similar to those seen in diabetic animals with retinopathy. Thus, increased expression of the sEH is a determinant event in the pathogenesis of diabetic retinopathy and sEH inhibition can prevent the progression of the disease.
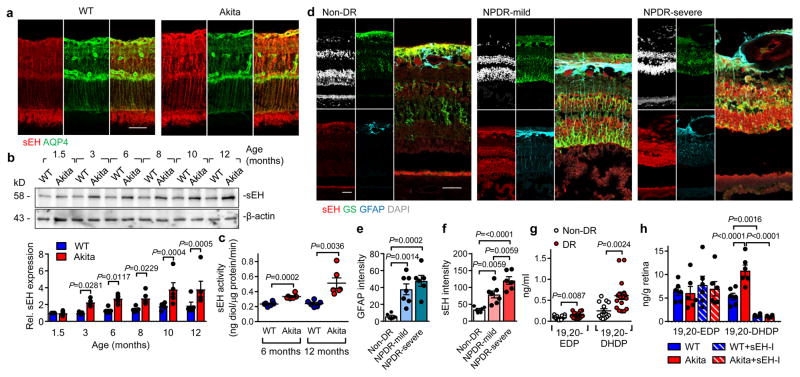
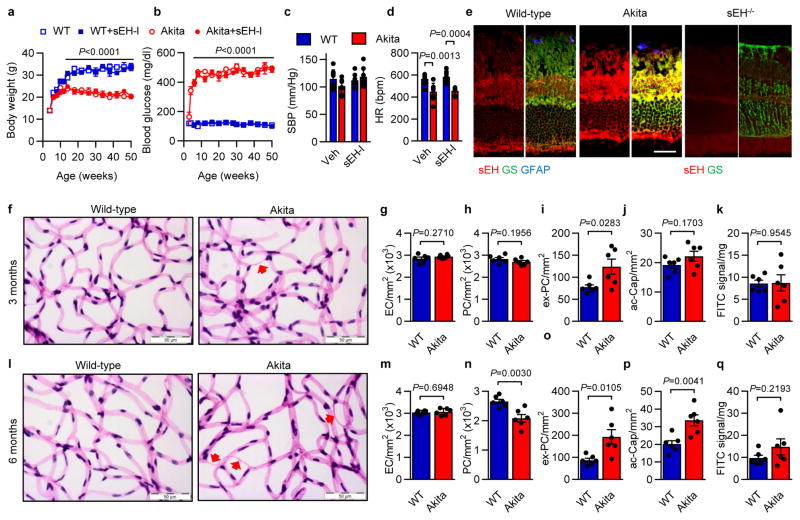
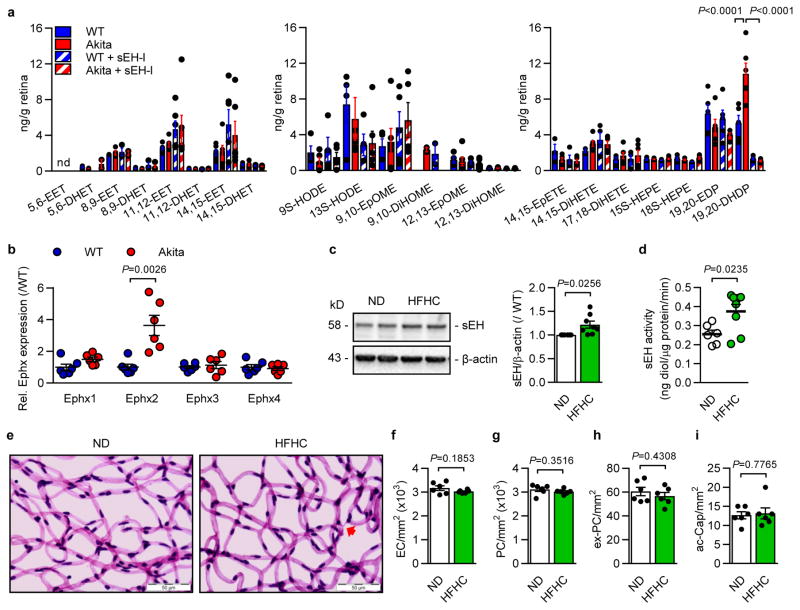
Diabetic retinopathy was studied in male Ins2Akita mice6, and develop significant hyperglycemia within 4 weeks (Extended Data Fig. 1a–d). The sEH was expressed in the adult murine retinas from wild-type and Ins2Akita mice and largely colocalized with aquaporin 4 and glutamine synthetase, indicating expression in Müller glia cells7 (Fig. 1a, Extended Data Fig. 1e). There was a time-dependent increase in retinal sEH expression in Ins2Akita mice that became significant by 3 months (Fig 1b), at which point migrating or extravascular pericytes, but only a few acellular capillaries, could be detected (Extended Data Fig. 1d–i). At 6 months, sEH activity was significantly increased in retinas that had developed modest diabetic retinopathy (decreased total numbers of pericytes, increased extravascular pericytes and acellular capillaries) together with a slight increase in vascular permeability (Fig. 1c, Extended Data Fig. 1j–o). sEH expression and activity were further increased at 12 months (Fig. 1b–c), and levels of the sEH product, 19,20-DHDP, were significantly elevated in eyes from Ins2Akita mice, while other sEH substrates and products were unaffected (Extended Data Fig. 2a). Of the epoxide hydrolases, only Ephx2 (=sEH) expression was significantly increased in retinas from Ins2Akita mice (Extended Data Fig. 2b) and sEH expression and activity also increased in retinas from wild-type animals fed a high fat, high carbohydrate diet for 20 weeks that displayed hyperglycemia but no clear signs of retinopathy (Extended Data Fig. 2c–i). Importantly, the expression of sEH increased with disease severity in retinas from patients with non-proliferative diabetic retinopathy versus those without diabetes (Fig. 1d–f, Extended data Table 1). It was only possible to obtain samples of vitreous humor from patients with proliferative diabetic retinopathy and at this later stage of the disease, levels of the sEH substrate; epoxydocosapentaenoic acid (19,20-EDP), and the sEH product; 19,20-DHDP, were significantly higher in samples from patients with diabetic retinopathy than with idiopathic macular hole but without diabetes (Fig. 1g, Extended data Table 2).
Fig. 1. sEH expression in retinas from diabetic mice and humans.
(a) sEH (red) and aquaporin 4 (green) in retinas from 12 month old mice. (b) Time course of retinal sEH expression. For gel source data, see Supplementary Fig. 1. (c) sEH activity in murine retinas. (d) sEH (red), glutamine synthetase (green), glial fibrillary acidic protein (blue) and DAPI (white) in retinas from patients with no diabetic retinopathy (non-DR, n = 6), mild non proliferative diabetic retinopathy (NPDR, n = 7) or severe NPDR (n = 6). (e–f) Quantification of GFAP and sEH from sections shown in d. (g) 19,20-EDP/DHDP in vitreous humor from individuals with non-diabetic retinopathy (Non-DR, n = 14) or diabetic retinopathy (DR, n = 17). (h) Retinal levels of 19,20-EDP/DHDP in 12 month old mice treated with vehicle or sEH inhibitor (sEH-I). Scale bar 50μm. n = 5 (b) or 6 (a, c, h) biologically independent samples per group. Data are mean ± s.e.m. P values determined by 2way ANOVA (b), Student’s two-tailed t-test (c, g) or 1way ANOVA (e–f, h).
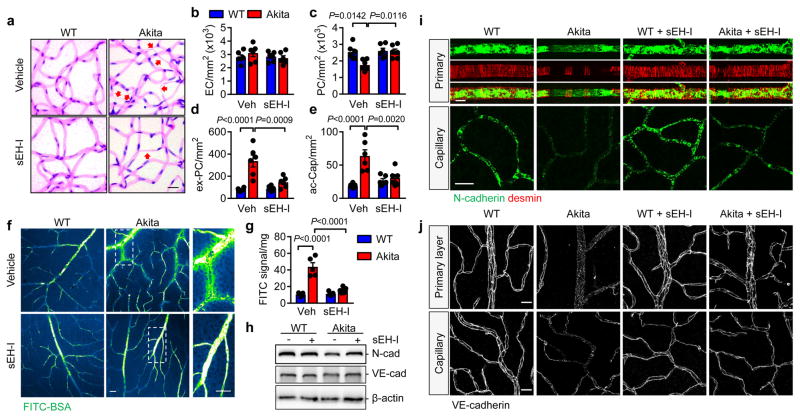
To assess the contribution of the sEH to disease progression, studies were performed using the sEH inhibitor; trans-4-[4-(3-adamantan-1-ylureido)cyclohexyloxy]-benzoic acid (t-AUCB),8 which was able to cross the blood-retinal barrier and could be detected in the retina (4.56 ± 0.86 ng/g retina) after one week of treatment. t-AUCB (given from 6 weeks to 12 months) did not affect body weight, fasting blood glucose, blood pressure or heart rate (Extended Data Fig. 1a–d), but significantly attenuated the production of 19,20-DHDP (Fig. 1h). All of the characteristic changes associated with non-proliferative diabetic retinopathy (decreased pericyte numbers, increased extravascular pericytes, acellular capillaries and permeability) were evident in 12 month old Ins2Akita animals and were clearly attenuated by sEH inhibitor treatment (Fig. 2a–g).
Fig. 2. Consequences of sEH inhibitor treatment on diabetic retinopathy in 12 month old mice.
(a) Retinal digest preparations; acellular capillaries are marked by arrows. (b–e) Quantitative retinal morphometry of images in a; i.e., endothelial cells (EC, b), pericytes (PC, c), extravascular pericytes (Ev-PC, d), and acellular capillaries (ac-Cap, e). (f) Fluorescent images of FITC-BSA 1 hour after injection. (g) Quantification of leaked FITC-BSA. (h) N- and VE-cadherin expression in retinas from wild-type and Ins2Akita littermates treated with or without sEH inhibitor (sEH-I). For gel source data, see Supplementary Fig. 1. (i) N-cadherin (green) and desmin (red) in the primary vascular layer and second capillary layer. (j) VE-cadherin in the retinal vasculature. Scale bar 20μm. n = 5 (f–h) or 6 (a–e, i, j) mice per group. Data are mean ± s.e.m. P values determined by 2way ANOVA.
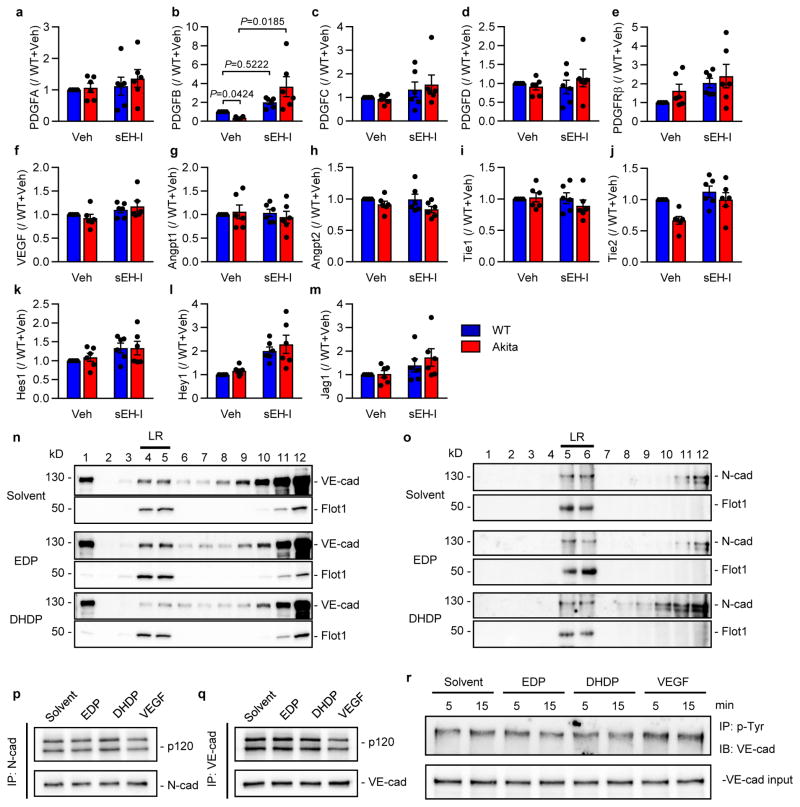
Pericytes are the first vascular cells affected by diabetes and pericyte “drop off” leads to secondary changes in endothelial cells9,10. A reduction in platelet-derived growth factor (PDGF) expression leads to a pericyte deficiency that is independent of diabetes10,11. In the Ins2Akita mice, retinal levels of PDGFB were decreased (Extended Data Fig. 3a–e) and expression of the PDGFRβ tended to increase. sEH inhibition increased PDGFB expression in retinas from wild-type and Ins2Akita mice but failed to alter PDGFRβ levels. No reproducible alterations in vascular endothelial cell growth factor (VEGF), angiopoietins or their receptors, or in Notch signalling were detected between ins2Akita mice and their wild-type littermates (Extended Data Fig. 3f–m). Thus, the ins2Akita model reproduces important features of early (non-proliferative) diabetic retinopathy and not the proliferative stage of the disease, characterized by elevated growth factor expression and angiogenesis3,4.
Neural (N)-cadherin is enriched at contacts between pericytes and endothelial cells9,12, and a reduced N-cadherin expression (Fig. 2h) as well as a loss of retinal vascular mural cells was apparent in retinas from Ins2Akita mice (Extended Data Fig. 4a). The loss of desmin positive mural cells coincided with the altered patterning of the underlying N-cadherin (Fig. 2i). Inter endothelial cell contacts were also affected and while vascular endothelial (VE)-cadherin staining clearly demarcated lateral membranes of endothelial cells in the primary and capillary layers of retinas from wild-type mice (Fig. 2j), the continuity of the signal was disrupted in retinas from Ins2Akita mice. While the effect was patchy, discrete areas of the retina demonstrated only a weak punctate VE-cadherin staining, an effect regularly observed in diabetic retinopathy13. In diabetic mice the apparent dissolution of pericyte-endothelial and inter-endothelial adherens junctions was largely normalized by sEH inhibitor treatment.
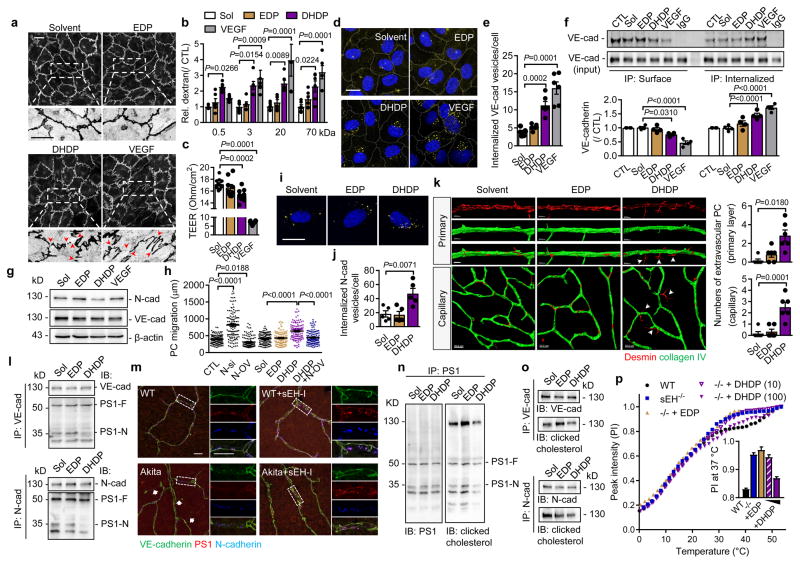
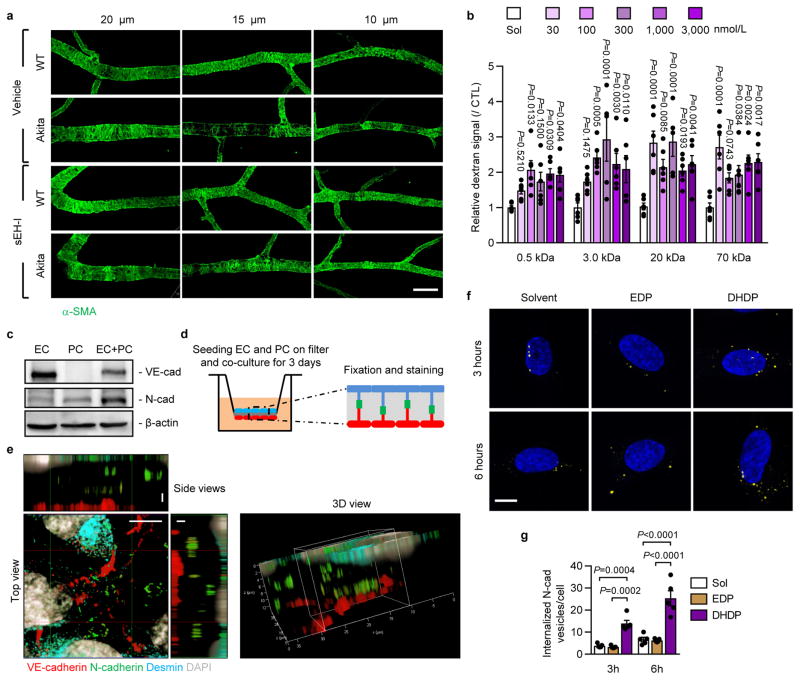
The significant changes in 19,20-DHDP levels in Ins2Akita mice before and after sEH inhibitor treatment, led us to hypothesize that 19,20-DHDP contributed to the progression of retinopathy by affecting cadherin localization. Indeed, 19,20-DHDP (but not 19,20-EDP), disrupted VE-cadherin continuity in cultured endothelial cells (Fig. 3a) and increased endothelial cell permeability to dextran (Fig. 3b, Extended Data Fig. 4b). 19,20-DHDP also decreased transendothelial electrical resistance in cultured murine brain microvascular endothelial cells (Fig. 3c) that develop junctions more similar to those normally found in the retina. 19,20-DHDP also induced VE-cadherin internalization, assessed using antibodies that recognized the extracellular domain of the protein (Fig. 3d–e), and by immunoprecipitation of internalized versus surface VE-cadherin (Fig. 3f). The effect of 19,20-DHDP was less pronounced than that of VEGF which is reported to induce the internalization of VE-cadherin14. In endothelial cell monolayers N-cadherin expression was low but it was clearly detectable in endothelial cell pericyte co-cultures and enriched at contact points between the two cell types (Extended Data Fig. 4c–e). In co-cultured cells, 19,20-DHDP decreased N-cadherin expression while 19,20-EDP and VEGF were without effect (Fig. 3g). 19,20-DHDP also increased pericyte motility on endothelial cells, an effect mimicked by the siRNA-mediated downregulation of N-cadherin and reversed by its overexpression (Fig. 3h). Moreover, in an ex vivo whole mount retina model, 19,20-DHDP induced the migration of vascular pericytes into the extravascular space (Fig. 3k). 19,20-DHDP elicited also the internalization of N-cadherin in pericytes (Fig. 3i–j, Extended Data Fig. 3f–g) indicating that the diol may target VE- and N- cadherins via a common mechanism.
Fig. 3. Effect of 19,20-DHDP on endothelial cell permeability and pericyte migration.
(a) VE-cadherin in endothelial cells treated with solvent, 19,20-EDP/DHDP or VEGF. Arrowheads indicate the discontinuous VE-cadherin pattern. (b) Permeability of human endothelial cells to dextran with different molecular masses. (c) Transendothelial electrical resistance (TEER) in murine brain endothelial cells. (d–e) Internalized VE-cadherin (yellow) in endothelial cells. (f) Surface and internalised VE-cadherin in endothelial cells. (g) N- and VE-cadherin expression in endothelial-pericyte co-cultures. (h) Pericyte mobility on endothelial cells after N-cadherin downregulation (N-si), N-cadherin overexpression (N-OV), or treatment with EDP/DHDP; n = 120 cells per group. (i–j) Internalized N-cadherin (yellow) in human pericytes. (k) Migrating pericytes (arrowheads) in ex vivo retinal whole mounts. (l) Association of PS1 (PS1-F: full length; PS1-N: N-terminal fragment) with VE- and N-cadherin immunoprecipitated from endothelial cell-pericyte co-cultures. (m) VE-cadherin (green), PS1 (red) and N-cadherin (blue) in retinas from 12 month old mice treated with vehicle or sEH inhibitor (sEH-I). Arrows indicate disrupted VE-cadherin pattern. (n) Co-precipitation of PS1 with cholesterol from endothelial cell-pericyte co-cultures. (o) Co-precipitation of VE- and N-cadherins with cholesterol from endothelial cell-pericyte co-cultures. (p) CH2 resonance centerband intensities of 1H MAS NMR temperature scans of isolated brain plasma membranes from wild-type and sEH−/− mice exposed to 19,20-EDP (100 μmol/L) or 19,20-DHDP (10 or 100 μmol/L). For gel source data, see Supplementary Fig. 1. Scale bars 20μm. n = 4 (a, f–h, l, n–o), 5 (i–j), 6 (b, d–e), 8 (c) independent experiments, or 6 retinas (k, m) per group. Data are mean ± s.e.m. P values determined by 2way ANOVA (b) or 1way ANOVA (c, e–f, h, j–k).
Mechanistically, DHA and 19,20-DHDP are thought to exert their effects independently of a receptor by means of insertion into the lipid bilayer, a phenomenon previously linked with the redistribution of membrane cholesterol and proteins from lipid raft to non-lipid raft fractions of the membrane15,16. Indeed, 19,20-DHDP inhibits the γ-secretase and interferes with Notch signalling by eliciting the redistribution of PS17. Given that PS1 interacts with VE-cadherin17 as well as N-cadherin18–20, we determined whether 19,20-DHDP disrupted the membrane localization of the cadherins. Both proteins were partially localized in lipid raft fractions and 19,20-DHDP, but not 19,20-EDP, was able to disrupt the lipid raft association and membrane presentation of cadherins in endothelial cell-pericyte cocultures (Extended Data Fig. 3n–o). PS1 co-precipitated with VE- and N-cadherin from endothelial cell-pericyte co-cultures and treatment with 19,20-DHDP markedly attenuated the binding of cadherins to the N-terminal fragment of PS1 (Fig. 3l), while 19,20-EDP was without effect. 19,20-DHDP did not influence the association of either N- or VE-cadherin with p120 catenin which was proposed to act as a molecular bridge between γ-secretase and cadherin-catenin complexes21. VEGF, on the other hand, elicited the phosphorylation of VE-cadherin and attenuated its association with p120 catenin, indicating a distinct mechanism of action (Extended Data Fig. 3p–r). The co-localization of PS1 with VE-cadherin and N-cadherin could be visualized in retinas from wild-type mice (Fig. 3m), but was disrupted in the areas from diabetic Ins2Akita retinas that displayed the hallmarks of retinopathy. sEH inhibitor treatment maintained the co-localization of VE- and N-cadherin with PS1.
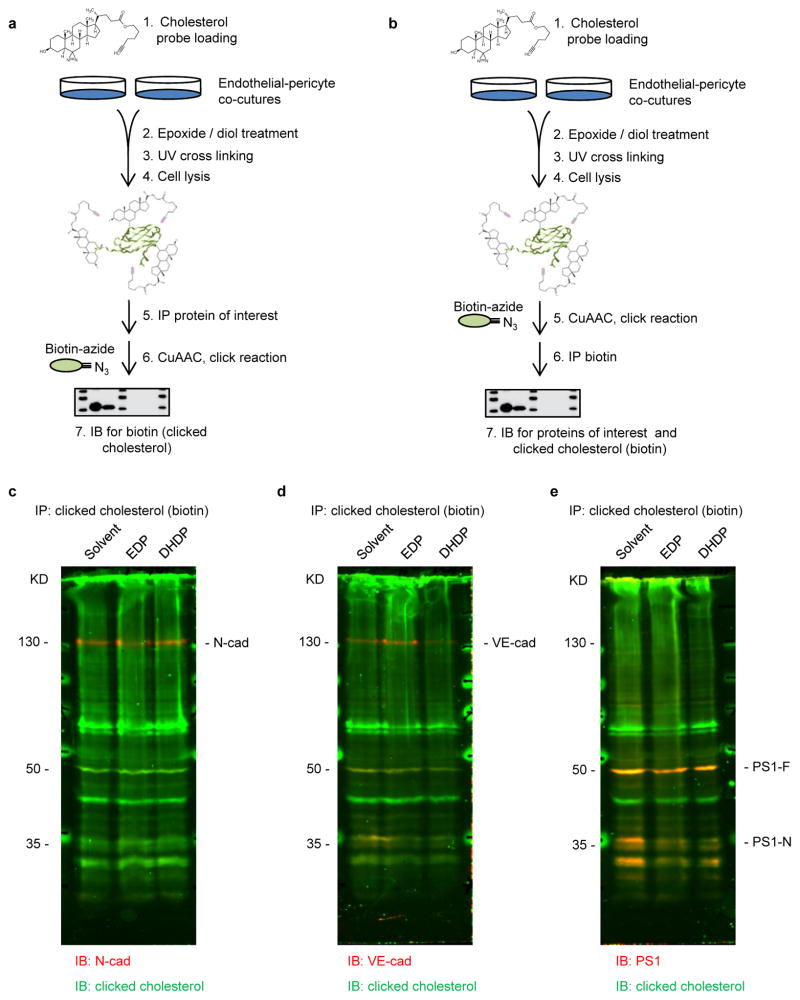
Protein complex assembly-disassembly is regulated by the cholesterol content of membrane microdomains22. A photoclick cholesterol probe was used to demonstrate the association of PS1 with cholesterol in endothelial-pericyte cocultures (Fig. 3n, Extended Data Fig. 5a). It was possible to confirm a previous report that PS1 and N-cadherin interact with cholesterol23, and to demonstrate the binding of VE-cadherin to cholesterol (Fig. 3o and Extended Data Fig. 5b–e). Also, treating cells with 19,20-DHDP reduced the association of cholesterol with PS1/VE-cadherin and PS1/N-cadherin complexes (Fig. 3n–o). To better characterise effects on membranes, 1H magic angle spinning NMR spectroscopy was performed and revealed a higher bulk lipid dynamic and accordingly lower lipid order in native membranes derived from brains of sEH−/− mice compared with their wild-type littermates. Changes that were only detected in the physiological temperature range. Treatment with 19,20-DHDP, but not 19,20-EDP, normalized the abnormal dynamic in membranes from sEH−/− mice (Fig. 3p and Extended Data Fig. 6a).
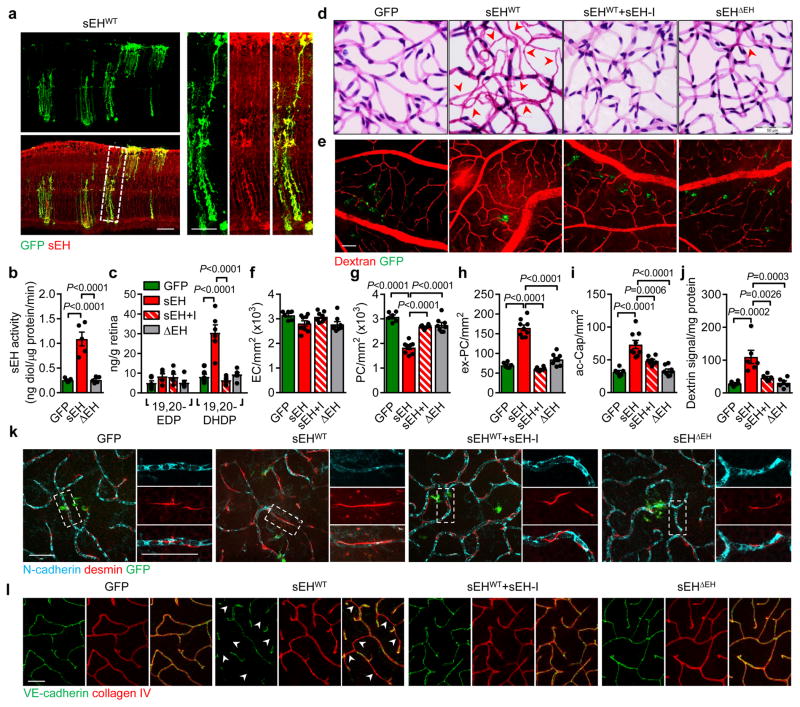
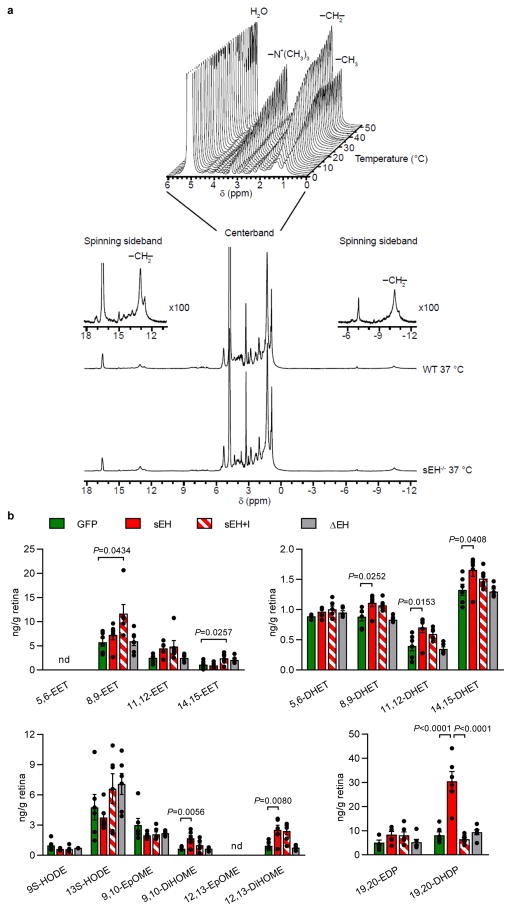
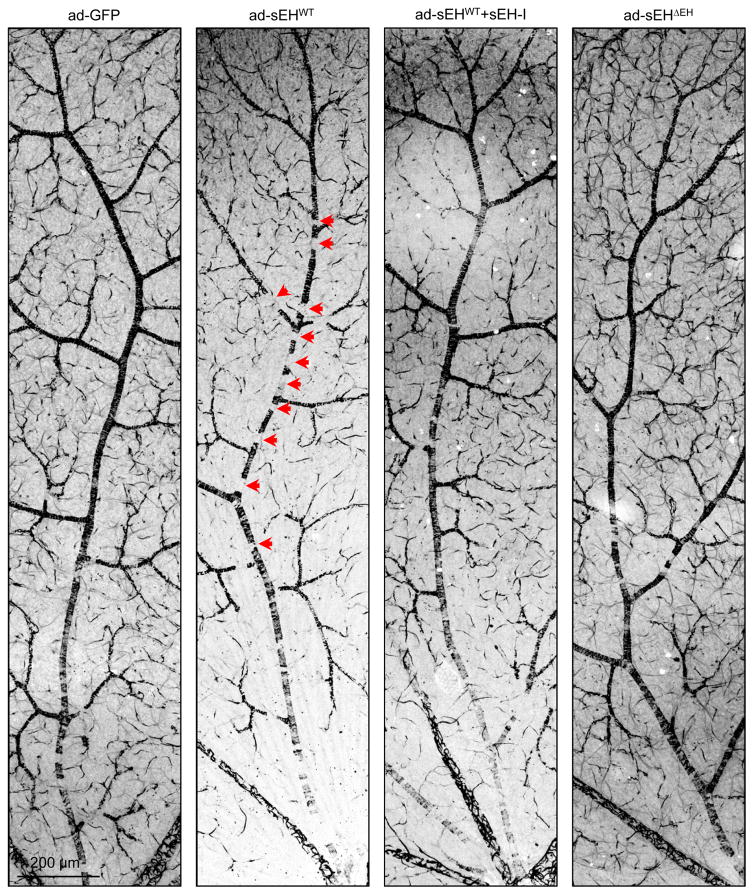
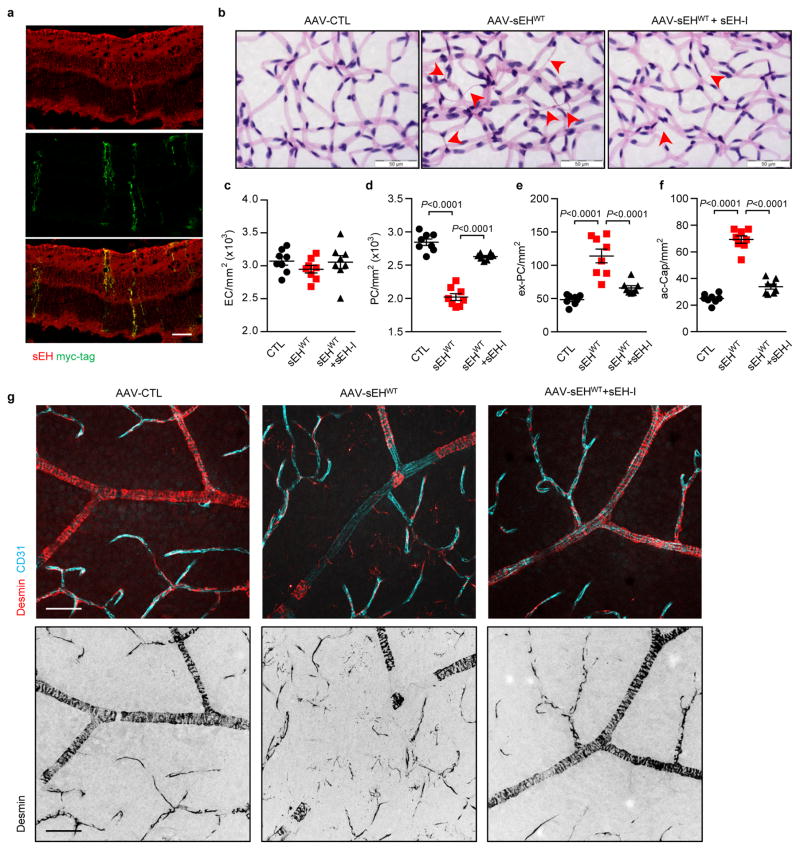
To determine whether increased sEH expression causes retinopathy, an adenoviral approach was used to overexpress the sEH in retinas of non-diabetic wild-type mice. A strong and selective overexpression of the sEH in Müller glial cells was achieved with intravitreal injection of the adenoviruses (Fig. 4a) and resulted in an increase in sEH activity (Fig. 4b) as well as fatty acid diol production (Extended Data Fig. 6b) with the most prominent effects on 19,20-DHDP (Fig. 4c). These changes were not observed in retinas overexpressing GFP or an enzymatically inactive sEH mutant (sEHΔEH), or in retinas expressing the wild-type sEH but treated with the inhibitor. Within 14 days of sEH virus administration there was a dramatic increase in vascular abnormalities, including decreased numbers of vascular-associated pericytes, increased numbers of extravascular pericytes and acellular capillaries, as well as vascular leak (Fig. 4d–j, Extended Data Fig. 7). The increase in extravascular (migrating) pericytes induced by sEH overexpression coincided with a reduction in N-cadherin expression (Fig. 4k) and disrupted VE-cadherin patterning (Fig. 4l). All of these changes were abrogated in animals given a sEH inhibitor. An adeno-associated virus used to specifically target Müller cells using the retinaldehyde binding protein 1 promoter resulted in a slower and more modest increase in retinal sEH expression. However, changes in the retinal vasculature 3 months after virus administration to non-diabetic mice phenocopied that of non-proliferative diabetic retinopathy (compare Extended Data Fig. 8 with Fig. 2a).
Fig. 4. sEH-induced retinopathy in non-diabetic mice.
(a) sEH (red) in wild-type mice retinas 7 days after intravitreal injection of GFP track adenoviral-sEH (sEHWT). (b) Retinal sEH activity 14 days after intravitreal injection of adenoviruses encoding GFP, sEHWT or the sEHΔEH mutant. (c) 19,20-EDP/DHDP levels in retinas 14 days after adenoviral injection to animals receiving vehicle or the sEH inhibitor (sEH-I). (d) Retinal digest preparations 14 days after adenovirus injection with or without sEH inhibitor (+I) treatment. Acellular capillaries are marked by arrowheads. (e) Vascular permeability (titrc-dextrin; red) 14 days after virus administration. (f–i) Quantitative retinal morphometry of images in d; i.e., endothelial cells (EC, f), pericytes (PC, g), extravascular pericytes (Ev-PC, h), and acellular capillaries (ac-Cap, i); n = 6 (GFP), 9 (sEHWT) or 8 (sEHWT+I, sEHΔEH) mice per group. (j) Quantification of leaked Titrc-dextrin. (k) N-cadherin (cyan) and desmin (red) in retinas treated with adenoviruses. Note the perivascular desmin positive protrusions that mark extravascular pericytes in sEHWT treated retinas. (l) VE-cadherin (green) and collagen IV (red) in retinas 14 days after adenovirus injection. Capillaries with abnormal VE-cadherin indicated with arrowheads. Scale bars 50μm. n = 5 (b), 6 (e, j–l) mice or 6 biologically independent samples per group (c). Data are mean ± s.e.m. P values determined by 1way ANOVA.
Taken together, our results link early (non-proliferative) diabetic retinopathy with an increase in sEH expression and elevated retinal levels of its product 19,20-DHDP. Moreover, the observations suggest that targeting the sEH is an attractive novel therapeutic approach to delay the development and progression of diabetic retinopathy.
Methods
Materials
The sEH inhibitor trans-4-[4-(3-adamantan-1-ylureido)cyclohexyloxy]-benzoic acid (t-AUCB) was synthesised as described24. Cell culture media were purchased from Gibco (Invitrogen, Karlsruhe, Germany), 19,20-epoxydocosapentaenoic acid and 19,20-dihydroxydocosapentaenoic acid were obtained from Cayman Europe (Tallinn, Estonia).
Animals and in vivo treatment
Ins2Akita (C57BL/6-Ins2Akita/J) mice carrying a mutation in the insulin 2 gene were obtained from The Jackson Laboratory (Bar Harbor, Maine). The colony was generated by breeding a C57BL/6J inbred female with a heterozygous male. In the present study exclusively male animals were studied. At the age of 6–8 weeks animals were randomly allocated into two groups and treated with either vehicle (0.3% ethanol) or the sEH inhibitor (t-AUCB, 2 mg/L) in the drinking water for a further 10 months. All animals were housed in conditions that conform to the Guide for the Care and Use of Laboratory Animals published by the U.S. National Institutes of Health (NIH publication no. 85-23). Both the University Animal Care Committee and the Federal Authority for Animal Research at the Regierungspräsidium Darmstadt (Hessen, Germany) approved the study protocol (#F28/38, #FU1012 and #FU1153). For the isolation of organs, mice were sacrificed using 4% isoflurane in air and subsequent exsanguination.
For the viral-mediated overexpression of the sEH in the retina, 6–8 week old male C57BL/6J mice (Charles River, Sulzfeld, Germany), were anesthetized with 2% isoflurane and 1 drop of 0.5% proxymetacainhydrochlorid (Ursapharm, Saarbrüchen, Germany) was applied on top of the cornea. The iris was dilated using 5% phenylephrine hydrochloride (Ursapharm, Saarbrüchen, Germany) and mice were intravitreally injected with the appropriate adenoviruses (1.5 × 10⁷ plaque forming units in 1 μL) or adeno-associated viruses (1010 genomic copies in 1 μL). Mice were randomly allocated to the different adenovirus groups and injections were performed by ultramicropump III injector (World precision instruments, Berlin, Germany) with self-pulled glass pipettes at 10 nL/second.
Generation of adenoviruses and adeno-associated viruses
The adenovirus encoding the human sEH under the control of a CMV promoter was generated as previously reported7. To generate the sEH mutant deficient in epoxide hydrolase activity (sEHΔEH) the tyrosine residues Tyr383 and Tyr466 were mutated to phenylalanine in the pAd-shuttle sEH vector using the following primers (Biospring GmbH, Frankfurt, Germany: Y381F: 5′-gccaacccagtatttgatttccagctctacttccaagaaccagg-3′, Y465F: 5′-gtcctctaaactggttccgaaacatggaaaggaactggaagtgg-3′). After DpnI restriction enzyme digestion the DNA was transformed in E. coli and the mutations were confirmed by sequencing (Eurofins MWG Operon, Ebersberg, Germany). Then adenoviruses were then generated as described.
The AAV6-derived capsid variant ShH10 and the AAV 2 RLBP1 GFP WPRE bGHpolyA vector with a Müller cell specific retinaldehyde binding protein 1 promoter25 (kindly provided by Dr. Jan Wijnholds, Leiden University, The Netherlands) were used to overexpress the human sEH in murine Müller glial cells. Briefly, the myc- and His-tagged sEH used for the adenovirus was subcloned from the pcDNA3.1/myc-His vector (Thermo Fisher Scientific, Karslruhe, Germany) via EcoRI and AflII after T4 polymerase treatment in the AgeI digested and T4 polymerase blunted AAV 2 RLBP1 GFP WPRE bGHpolyA vector. The orientation of the insert was confirmed by control digestion with XbaI and BamHI (NEB, Frankfurt, Germany), as well as by sequencing. Ligation reaction was performed with the T4 ligase (NEB, Frankfurt, Germany).
Cell culture
Murine brain endothelial cells were isolated and cultured as previously described26,27 and human brain vascular pericytes were purchased from ScienCell research laboratories (Berlin, Germany). Human umbilical vein endothelial cells were isolated and purified using VE-cadherin (CD144) antibody-coated magnetic beads (Dynal Biotech, Hamburg, Germany) and cultured as described28. The human umbilical cords were obtained from local hospitals in Frankfurt am Main, and the use of human material in this study conforms to the principles outlined in the Declaration of Helsinki. The isolation of human cells was approved by the ethics committee at the Goethe-University, Frankfurt, Germany.
Endothelial cell-pericyte co-culture
Human umbilical vein endothelial cells were cultured on fibronectin coated dishes until confluent. Then pericytes were seeded on top of the endothelial cells (PC:EC = 1:2) and co-cultured for an additional 24 hours. After starving with 0.1% BSA overnight, co-cultures were treated with solvent (0.03% DMSO), 19,20-EDP (3 μmol/L), 19,20-DHDP (3 μmol/L) or VEGF (30 ng/ml) in the presence of the sEH inhibitor (t-AUCB, 10 mmol/L) at 37°C for 4 hours.
Transwell-based co-culture
Polyester transwell inserts (0.4 μm pore diameter; Corning) were coated with fibronectin for 1 hour at room temperature. Human umbilical vein endothelial cells were seeded on the underside of the inserts. After 2 days, inserts were turned over and placed into the 12-well plate with EC monolayer facing down in the dish. Then, pericytes were seeded on the upper side of inserts and maintained for a further 3 days.
Human samples
Retina samples
Eyes were isolated during autopsy (with consent from a relative) and retinas embedded in paraffin were obtained from the Wilmer Eye Institute Ocular Pathology Archives; with approval from the Johns Hopkins School of Medicine Institutional Review Board (Study Number CR00014650), and the Eye Bank of the Center of Ophthalmology; with approval from the Ethics Committee of the University of Cologne (reference number 14–247), and followed the tenets of the Declaration of Helsinki. Tissues were rehydrated and embedded in paraffin. Sections (5 μm) were cut on the horizontal level of the optic nerve and mounted on coated microscopic slides.
Vitreous humor
Vitreous samples were obtained, with informed consent, from 17 patients undergoing vitrectomy for proliferative diabetic retinopathy and 14 patients with macula disease not related diabetes. All samples were collected by pars plana vitrectomy, were centrifuged at 13,000 rpm at 4°C for 15 minutes and archived at −80°C until further use. The study was approved by Henan Eye Institute Clinical Research Ethics committee under the approval number HNEECKY-2015(3). All studies involving the recovery of human material followed the tenets of the Declaration of Helsinki.
Immunohistochemistry and immunofluorescence
Retinal whole mount
Retinas for whole-mount were fixed in 4% PFA for 2 hours at room temperature, or overnight at 4 °C. After fixation, retinas were blocked and permeabilized in blocking buffer (1% BSA and 0.5% Triton X-100 in PBS) overnight at 4°C. For mouse antibodies, samples were washed and blocked with mouse IgG blocking reagent as suggested by the manufacturer (MKB-2213 Vector, CA, USA) for 1 hour at room temperature. Primary antibodies were diluted in blocking buffer and incubated overnight at 4°C. The following antibodies were used: VE-cadherin (1:200, AF1002 R&D systems, Abingdon, UK), α-smooth muscle actin-cy3 (1:500, C6198 Sigma, Taufkirchen, Germany), N-cadherin (1:200, 33-3900 lifetechnologies, CA, USA), collagen IV (1:500, 1340-01 southern biotech, AL, USA), presenilin 1 (1:200, MAB1563 Millipore, Darmstadt, Germany) and desmin (1:500, ab15200 abcam, Cambridge, UK). For secondary detection Alexa Fluor-coupled secondary antibodies (1:200) were used. Cell nuclei were visualized with DAPI (0.2 ug/mL, D9542 Sigma). After antibody staining retinas were post-fixed with 4% PFA for 10 minutes before flat-mounting in mounting medium (Dako).
Retinal cross sections
Immunofluorescent detection of the sEH was performed in cryopreserved mouse tissue sections (10 μm) and paraffin-embedded human tissue (5 μm). The antibody against sEH (rabbit polyclonal antibody, 1:250) was kindly provided by Michael Arand (University of Zurich, Zurich, Switzerland). Antibodies against GFAP (1:1000, AB5541), and GS (1:1000, MAB302) were from Millipore (Darmstadt, Germany) and the antibody against AQP4 (1:500, sc-9887) was from Santa Cruz (Darmstadt, Germany). For secondary detection Alexa Fluor-coupled secondary antibodies (1:200) were used. Fluorescent images were taken using a confocal microscope (Carl Zeiss LSM-780, Jena, Germany). Average signal intensity of sEH and GFAP on human retinal sections (ganglion cell layer was excluded) were quantified by ImageJ software (NIH).
Cultured cells
Cells or cells on transwell filters were fixed with 4% PFA for 10 minutes at room temperature. After washing with PBS, samples were blocked and permeabilized with 1% BSA, 5% horse serum, 0.5% Triton X-100 at room temperature for 2 hours or at 4°C overnight before being exposed to primary antibody (4°C, overnight). After extensive washing and exposure to Alexa Fluor-coupled secondary antibodies (1:200, 2 hours, room temperature) samples were mounted in fluorescent mounting medium and analysed with a confocal microscope (Leica SP8 confocal microscope and LASX software; Wetzlar, Germany, or Carl Zeiss LSM-780 and ZEN software) as described7,29.
Retinal digest preparation
Retinal vascular preparations were performed using a pepsin-trypsin digestion method as described30. Briefly, eyes were enucleated and immediately fixed in 4% PFA (PBS buffered, pH 7.4) for two days and washed in distilled water for 1 hour at 37°C. A combined pepsin (5% pepsin in 0.2% HCl for 1 hour)-trypsin (2.5% in 0.2 mol/L Tris/pH7.4 for 30 minutes) digestion was used to isolate the retinal vasculature. The samples were air-dried and stained with periodic acid Schiff and haematoxylin to highlight basement membranes and nuclei of capillaries. The total numbers of endothelial cells, pericytes and migrating pericytes were counted in 10 randomly selected fields (x400 magnification) per retina using a CellF image system with a morphometric analysing software (XC10 Peltier-cooled digital camera, Olympus Europa, Hamburg, Germany), and the numbers were normalized to the relative capillary density (number of cells per mm2 capillary area). Subsequently, according to their localization within the capillary tree and their position relative to adjacent endothelial cells, pericytes with triangular nuclei in which at least one lateral side of the triangular nuclei projecting into the extravascular interstitium was longer than the base in contact with the capillary, were defined as migrating pericytes. Acellular capillary segments were quantified using an integration ocular with 100 grids (Olympus, 400x magnification) and the total numbers were normalized to mm2 of retinal area. All samples were evaluated in a blinded fashion.
sEH activity assay
Retinas were homogenized in RIPA lysis buffer (50 mmol/L Tris/HCL pH 7.5, 150 mmol/L NaCl, 10 mmol/L NaPPi, 20 mmol/L NaF, 1% sodium deoxycholate. 1% Triton X-100 and 0.1% SDS) and the homogenate was used to determine the sEH activity. Briefly, reactions were performed with 5 μg protein at 37°C for 10 minutes in 100 μL of potassium phosphate buffer (100 mmol/L, pH 7.2). Reactions were started by the addition of 14,15-EET (10 μmol/L), stopped on ice and immediately extracted twice with ethyl acetate (0.7 mL). For LC-MS/MS analysis one tenth of the sample was spiked with a deuterated internal standard (14,15-EET-d8). After evaporation of the solvent in a vacuum block under a gentle stream of nitrogen the residues were reconstituted with 50 μL of methanol/water (1:1, v/v) and determined with a Sciex API4000 mass spectrometer operating in multiple reaction monitoring (MRM) mode as described31. Chromatographic separation was performed on a Gemini C18 column (150 × 2 mm I.D., 5 μm particle size; Phenomenex, Aschaffenburg, Germany).
Epoxide/diol profiling
Human vitreous (200 μL) or mouse retina lysates were mixed with 500 μL methanol and 300 μL of 10 mol/L sodium hydroxide and deuterated internal standards. The samples were hydrolyzed for 30 minutes at 60°C and then neutralized with acetic acid and adjusted to pH 6.2. A solid phase extraction procedure using Agilent Bond-Elut-Certify II (Santa Clara, CA, USA) was performed as described32. The measurements were performed by LIPIDOMIX GmbH (Berlin, Germany) with a Triplequad LC-MS/MS (Agilent 6460/1200SL, Agilent Technologies, Waldbronn, Germany) equipped with a Phenomenex Kinetex Column (150 mm × 2.1 mm, 2.6 μm, Phenomenex, Aschaffenburg, Germany). Chromatography was achieved under gradient conditions with acetonitrile/0.1% formic acid in water as the mobile phase, a flow rate of 0.3 mL/min and a run time of 16 minutes. The injection volume was 7.5 μL. After optimization the following MS/MS conditions were used: electrospray ionization (ESI) in negative mode, capillary voltage 3500 V, nozzle voltage 1500 V, drying gas 210 °C/7 L/min, sheath gas 350 °C/11 L/min and nebulizer pressure 30 psi. Standard curves containing the following standards: 5,6-EET, 5,6-DHET, 8,9-EET, 8,9-DHET, 11,12-EET, 11,12-DHET, 14,15-EET, 14,15-DHET, 9S-HODE, 13S-HODE, 9,10-EpOME, 9,10-DiHOME, 12,13-EpOME, 12,13-DiHOME, 14,15-EpETE, 18S-HEPE, 19,20-EDP, and 19,20-DHDP (Cayman Europe, Tallinn, Estonia) were used for quantification. Concentrations of the standards ranged from 0.1 ng/ml to 500 ng/ml for all the lipids. All samples and dilutions of the standards were spiked with internal deuterated standards: Metabolite concentrations were determined by reference to the standards. Signal-to-noise ratios ≥ 3 were required for a peak to be considered identifiable and ≥ 10 to be quantifiable.
Pericyte migration assays
In vitro migration
Human umbilical vein endothelial cells were isolated and cultured as described33, seeded on μ-slides (ibidi, Martinsried, Germany) and grown to confluence. Pericytes were labelled with cell tracker green (Invitrogen) and added to the endothelial cell monolayer and co-cultured for 24 hours. Cells were then treated with either solvent (0.03% DMSO), 19,20-EDP (3 μmol/L), 19,20-DHDP (3 μmol/L) in the present of t-AUCB (10 μmol/L). Cells were incubated in an IncuCyte imaging system (Essen Bioscience, Hertfordshire, UK) that took photographs automatically every 15 minutes for 24 hours. Pericyte movement on top of the endothelial cell monolayer were tracked manually and analysed with Image J (NIH, Bethesda, MD, USA). Cells with total migration distance less than 150 μm in 24 hours were excluded and in total 120 cells were tracked. In some experiments pericytes were treated with small interfering RNA directed against N-cadherin (sc-29403, Santa Cruz) or an N-cadherin overexpression plasmid (addgene #18870). Transfection was performed with lipofectamine 2000 (Invitrogen) following the manufacturer’s instructions and a scrambled control siRNA was used as control. Experiments were performed 4 times independently and 4 different cell batches were used.
Retinal explants
Eyes from 7 month old animals were enucleated and immersed in ice-cold HBSS containing penicillin (100 U/mL) and streptomycin (100 μg/mL). Retinas were carefully dissected under a stereomicroscope and divided into four quadrants with four deep radial incisions. The explants were transferred onto tissue culture inserts (0.4 μm pore, Millipore; Cork, Ireland) with the retinal ganglion cell side facing up. The inserts were placed into the wells of a 6-well plate. A serum free retinal explant media (Neurobasal A, Invitrogen) supplemented with 2% B27 (Invitrogen), 1% N2 (Invitrogen), L-glutamine (0.8 mmol/L), penicillin (100 U/mL), and streptomycin (100 μg/mL) were added to the bottom of the wells and 3 μL of media was dropped on top of the retina to keep it moist. Retinal explant cultures were maintained in humidified incubators (37°C, 5% CO2) and treated with either solvent (0.03% DMSO), 19,20-EDP (3 μmol/L) or 19,20-DHDP (3 μmol/L) in the presence of sEH inhibitor (t-AUCB, 10 μmol/L). After 4 days, retinas were fixed and processed as described above.
Permeability assays
Retinal barrier function
Animals were anesthetized (Ketamine 100 mg/kg and Xylazine 10 mg/kg body weight) and injected (i.v.) with FITC-BSA (Sigma). After 1 hour, animals were killed and eyes were enucleated. After fixing with 4% PFA for 2 hours, retinas were dissected and flat mounted and analysed with confocal microscopy. To quantify FITC-BSA leakage in the retina, some animals were perfused with pre-warmed PBS to remove vascular FITC-BSA before the retinas were isolated. Thereafter, the FITC-BSA fluorescence signal in retinal homogenates was assessed (excitation λ 485nm, emission λ 530nm) using a plate reader (PerkinElmer, Hamburg, Germany). To study permeability in retinas from mice treated with adenoviruses, tetramethylrhodamine isothiocyanate conjugated dextran (average molecular weight 65–85 kD, Sigma) was used. Fluorescence images were taken 5 minutes after tracer injection and the dextran remaining in retinal tissues after perfusion with PBS was assessed (excitation λ 550nm, emission λ 580nm) using a plate reader (PerkinElmer, Hamburg, Germany). Blood was taken immediately before perfusion with PBS, and fluorescence intensity in the plasma was used for normalization.
Transendothelial electrical resistance (TEER)
Impedance measurements were performed using isolated murine brain microvascular endothelial cells with a cellZscope device (nanoAnalytics) as described34. After reaching confluence, indicated by a plateau in the TEER, cells were treated with either solvent (0.025% DMSO), 19,20-EDP (3 μmol/L) or 19,20-DHDP (3 μmol/L). Measurements were performed four times in quadruplicate with endothelial cells from 8 different cell preparations.
Dextran permeability
Permeability through the mouse brain endothelial cell monolayer was measured as described35. Briefly, primary endothelial cells were plated (105 cells/cm2) onto fibronectin-coated 24 well polyethylene terephthalate Transwell inserts (Greiner Bio-One, Frickenhausen, Germany) and cultured to confluency. Cells were treated with solvent, 19,20-EDP or 19,20-DHDP and after 24 hours dextrans of defined molecular mass and fluorescence i.e. 0.45 kDa Lucifer yellow-dextran (5 μmol/L, Sigma, excitation λ 425 nm, emission λ 525 nm), 3 kDa dextran TXR (2.5 μmol/L, Invitrogen, excitation λ 595 nm, emission λ 625 nm), 20 kDa dextran TMR (5 μmol/L, Sigma, excitation λ 550 nm, emission λ 580 nm) and 70kDa dextran FITC (2.5 μmol/L, Sigma, excitation λ 490 nm, emission λ 520 nm) were added to the apical compartment. After 1 hour the transfer of dextrans to the lower compartment was assessed by a fluorescence reader (Tecan, Männedorf, Switzerland). The data are expressed as the percentage of permeability normalized to the permeability coefficient for the control conditions of untreated cells.
VE- and N-cadherin internalization assays
VE-cadherin internalization was determined as described36. Endothelial cells were cultured on culture slides (BD, Heidelberg, Germany) coated with crosslinked gelatine until confluent and starved with 2% FCS overnight. Cells were then incubated with antibody against extracellular domain of human VE-cadherin (clone BV6, ALX-803-305 Enzo Life Sciences, Lörrach, Germany) at 4°C for 1 hour in MCDB 131 with 1% BSA medium. Unbound antibody was removed by rinsing cells with ice-cold MCDB 131 medium. After washing, cells were treated with solvent (0.03% DMSO), 19,20-EDP (3 μmol/L), 19,20-DHDP (3 μmol/L) or recombinant human VEGFA (30 ng/ml) in the present of the sEH inhibitor (t-AUCB, 10 mmol/L) and maintained at 37°C for 3 hours. To block the degradation of internalized VE-cadherin chloroquine (300 μmol/L) was be added to the incubation medium. To assess internalized endogenous VE-cadherin, cells were washed with ice-cold acid wash buffer (Hanks buffer, pH=2.7, containing 25 mmol/L glycine and 1% BSA). Cells were fixed with 4% PFA for 15 minutes at 4°C and then processed for immunofluorescence.
To assess N-cadherin internalization, pericytes were incubated with an mouse monoclonal antibody against the extracellular domain of human N-cadherin (clone 8C11, 350802 BioLegend, CA. USA) at 4°C for 1 hour in DMEM containing 1% BSA. After removing unbound antibodies with ice-cold DMEM medium, cells were treated with solvent (0.03% DMSO), 19,20-EDP (3 μmol/L) or 19,20-DHDP (3 μmol/L) in the present of the sEH inhibitor (t-AUCB, 10 mmol/L) and leupeptin (100 μg/ml) at 37°C for 3, 6 or 10 hours. After rinsing with PBS, cells were fixed with 4% PFA for 15 minutes. Antibodies remaining on the cell surface were blocked with an excess of anti-mouse IgG Alexa 633-conjugated antibody (Life Technologies, 1:100) for 2 hours. Thereafter, samples were washed with PBS and permeabilized with 0.5% Triton X-100. Endocytosed N-cadherin was visualized with anti-mouse IgG Alexa 488-conjugated antibody (Life Technologies, 1:400). Samples were imaged with a SP8 confocal microscope (Leica) and internalized particles were quantified using ImageJ software (NIH).
Surface and internalized VE-cadherin immunoprecipitation
Confluent cultures of human endothelial cells were incubated with antibodies recognizing the extracellular domains of human VE-cadherin (BV6 antibody) at 4°C (1 hour) and then treated with solvent (0.03% DMSO), 19,20-EDP (3 μmol/L) or 19,20-DHDP (3 μmol/L) at 37°C for 3 hours. After an acid wash to remove the surface bound antibody, cells were homogenized with lysis buffer (20 mmol/L HEPES pH 7.5, 1.5 mmol/L MgCl2, 5 mmol/L EGTA, 150 mmol/L NaCl, 1% Triton X-100, 0.5% glycerol). For surface VE-cadherin immunoprecipitation, endothelial cells were treated 19,20-EDP or 19,20-DHDP at 37°C for 3 hours, and then incubated with VE-cadherin BV6 antibodies at 4°C for 1 hour. After rinsing with ice-cold MCDB 131 medium to remove unbound antibody, cells were lysed with the same buffer as above. Following centrifugation at 17,000g for 10 minutes, supernatants were incubated with protein G agarose (Pierce, IL, USA) for 2 hours. Samples were washed with lysis buffer and analysed by SDS–PAGE.
Immunoprecipitation of VE- and N- cadherins in endothelial cell-pericyte co-cultures
Human umbilical vein endothelial cells were isolated and cultured to give confluent monolayers. Pericytes were trypsinised and seeded on top of the endothelial cell monolayer (PC:EC = 1:2) for additional 24 hours. After treated with solvent (0.03% DMSO), 19,20-EDP (3 μmol/L) or 19,20-DHDP (3 μmol/L) for 4 hours, cells were harvested and lysed in PBS by sonication. After centrifugation at 16 000 rpm for 15 minutes, membrane proteins were solubilized within lysis buffer (20 mmol/L HEPES pH 7.5, 1.5 mmol/L MgCl2, 5 mmol/L EGTA, 150 mmol/L NaCl, 1% digitonin, 0.5% glycerol) with protease inhibitor cocktail tablets (Roche, Mannheim, Germany). After pre-incubated with protein A&G agarose (Pierce, IL, USA) for 2 hours, supernatants were incubated with antibody against VE-cadherin (sc-28644 Santa Cruz, Darmstadt, Germany) or N-cadherin (33-3900 lifetechnologies, CA, USA) overnight at 4°C. Then samples were incubated with protein A&G agarose (Pierce, IL, USA) for 2 hours. Samples were washed with lysis buffer and analysed by SDS–PAGE.
Photoclickable cholesterol loading and click chemistry
A photoclickable cholesterol probe (hex-5′-ynyl 3β-hydroxy-6-diazirinyl-5α-cholan-24-oate; Avanti Polar Lipids, AL, USA) was used as described23. Briefly, a cholesterol probe stock solution was prepared (2 mmol/L in 50 mg/ml methyl-β-cyclodextrin) and rotated overnight. Endothelial cells and pericytes were co-cultured for 24 hours and treated with lovastatin (5 μg/ml, Merck, Darmstadt, Germany) and t-AUCB (10 μmol/L) for an additional 2 hours. Then cells were incubated with the cholesterol probe (10 μmol/L) for 30 minutes at 37°C. After removing the unbound probe, cells were treated with solvent (0.03% DMSO), 19,20-EDP (3 μmol/L) or 19,20-DHDP (3 μmol/L) in the presence of lovastatin and t-AUCB (10 μmol/L) for 4 hours. After exposure to UV light (λ365 nm) in a crosslinker (Vilber, Eberhardzell, Germany) for 5 minutes, cells were harvested and processed for immunoprecipitation as described above. After immunoprecipitation, the cholesterol probe crosslinked to the proteins of interest was labelled with biotin-azide (Sigma) using a CuAAC-based click chemistry reaction buffer kit according to the manufacturer’s instructions (Jena Bioscience, Jena, Germany).
1H MAS NMR temperature scans of mouse brain membranes
Mouse brains were harvested in ice-cold PBS and homogenized with a tissue homogenizer (Kinematica, Luzern, Switzerland) at 15,000 rpm for 1 minute on ice. After centrifugation at 1500g for 2 minutes, the pellet was resuspended and incubated with solvent (DMSO), 19,20-EDP (100 μmol/L) or 19,20-DHDP (10 or 100 μmol/L) for 1 hour at room temperature with gentle shaking. Thereafter, samples were pelleted at 30,000g for 30 minutes, washed with PBS and centrifuged again (30,000g for 30 minutes) before being transferred into 4 mm MAS rotors and immediately measured. Spectra were recorded at 10 kHz MAS at a 1H Larmor frequency of 850 MHz with 64 scans and water presaturation. Sample temperatures were calibrated via KBr T1 relaxation time measurements. Samples were equilibrated for 10 minutes once the sensor reached the target temperature.
RT-qPCR
Total RNA from retinas was extracted using an RNeasy kit (QIAGEN, Hilden, Germany), and equal amounts (1 μg) of total RNA was reverse transcribed (Superscript III; Invitrogen). Gene expression levels were detected using SYBR Green (Absolute QPCR SYBR Green Mix; Thermo Fisher Scientific). The relative expression levels of the different genes studied was calculated using the 2−ΔΔCt method with the 18S RNA as a reference. The primer sequences used were as follows:
| 18s | forward 5′-CTTTGGTCGCTCGCTCCTC-3′ reverse 5′-CTGACCGG-GTTGGTTTTGAT-3′ |
| PDGF A | forward 5′-CCT GTG CCC ATT CGC AGG AAG AGA-3′ reverse 5′-TTG GCC ACC TTG ACA CTG CGG TG-3′ |
| PDGF B | forward 5′-ATC GCC GAG TGC AAG ACG CG-3′ reverse 5′-AAG CAC CAT TGG CCG TCC GA-3′ |
| PDGF C | forward 5′-TGC AGC TCT CCA GCG ACA AGG-3′ reverse 5′-CGG GCT GTG GAT GCT CCC AT-3′ |
| PDGF D | forward 5′-CCG GAA GCA GCC TCA GAG ACC-3′ reverse 5′-AGC AGT GAG AGT GGG GTC CGT-3′ |
| VEGF | forward 5′-GCA CTG GAC CCT GGC TTT ACT GCT GTA-3′ reverse 5′-GAA CTT GAT CAC TTC ATG GGA CTT CTG CTC-3′ |
| Angpt1 | forward 5′-CGG TGC CGA TTT CAG CAC GAA-3′ reverse 5′-GGC CAC AGG CAT CGA ACC ACC-3′ |
| Angpt 2 | forward 5′-GGG AAG GCA ACG AGG CGC ATT-3′ reverse 5′-CGC GGT CCC CGT GAG TCC TG-3′ |
| Tie 1 | forward 5′-ACA GCC GGC GCT TCA AGG TC-3′ reverse 5′-AAG CTG ACG GCT CTG CTT GGC-3′ |
| Tie 2 | forward 5′-ATG GCT CAG GCA TTC CAG AAC AG-3′ reverse 5′-TGG CCT TCC TGT TAA GGG CCA GA-3′ |
| Hes1 | forward 5′-GAG GCG AAG GGC AAG AAT AAA -3′ reverse 5′-GTG GAC AGG AAG CGG GTC A-3′ |
| Hey1 | forward 5′-TGA GCT GAG AAG GCT GGT AC -3′ reverse 5′-ACC CCA AAC TCC GAT AGT C -3′ |
| Jag1 | forward 5′-TCT CTG ACC CCT GCC ATA AC-3′ reverse 5′-TTG AAT CCA TTC ACC AGA TCC-3′ |
Small interfering RNA
To knockdown N-cadherin in pericytes, small interfering (si) RNA directed against N-cadherin (sc-29403, Santa Cruz) was used. Transfection was performed with lipofectamine 2000 (Invitrogen) according to the manufacturer’s instructions and a scrambled control siRNA was used as control.
Immunoblotting
Retinas or cells were lysed in RIPA lysis buffer (50 mmol/L Tris/HCL pH 7.5, 150 mmol/L NaCl, 10 mmol/L NaPPi, 20 mmol/L NaF, 1% sodium deoxycholate. 1% Triton and 0,1% SDS) and detergent-soluble proteins were resuspended in SDS-PAGE sample buffer. Samples were separated by SDS-PAGE and subjected to Western blotting as described37. Membranes were blocked in 3% BSA in PBS, incubated with primary and horseradish peroxidase-conjugated secondary antibodies in blocking solution, and detection was performed with a Lumi-Light plus western blotting substrate (Roche, Mannheim, Germany). For detection using the LI-COR system, after incubating with primary antibodies, the membranes were incubated for 1 hour with IRDye800CW- and IRDye680-conjugated secondary antibodies (LI-COR Biosciences, Bad Homburg, Germany). The blots were then washed and visualized by scanning the membrane on an Odyssey Clx Imaging System (LI-COR Biosciences, Bad Homburg, Germany) with both 700 and 800 nm channels.
Lipid rafts
Lipid rafts were isolated as described, with modifications38. Briefly, cells were harvested by scraping and homogenized at 4°C in sodium carbonate (0.5 mol/L, pH11) using a glass homogenizer, followed by sonication. Then, equal amounts of protein were adjusted to a final sucrose concentration of 45% (final volume, 4 mL) and transferred to 12 mL ultracentrifuge tubes. A discontinuous sucrose gradient was then formed by sequentially overlaying 4 mL of 35% and 4 mL of 5% sucrose. Samples were subjected to ultracentrifugation (35,000 rpm, 4°C for 20 hours) using a Beckman SW 41 rotor (Krefeld, Germany). After centrifugation, twelve 1 mL fractions were collected using a capillary tube connected to a peristaltic pump, and equal volumes of each fraction were analysed by SDS-PAGE using antibodies against flotillin 1 (1: 2000, 610820 BD Biosciences, Heidelberg, Germany), VE-cadherin (1:1000, sc-28644 Santa Cruz, Darmstadt, Germany) and N-cadherin (1:1000, 33-3900 lifetechnologies, CA, USA).
Statistical analysis
Data are expressed as mean ± SEM. Statistical evaluation was performed using Student’s t test for unpaired data, one-way ANOVA followed by a Newman-Keuls test or ANOVA for repeated measures where appropriate. Values of P<0.05 were considered statistically significant.
Data availability
The authors declare that the data supporting the findings of this study are available within the paper and its supplementary information files.
Extended Data
Extended Data Figure 1. Characterization of Ins2Akita mice.
a–d, Wild-type and Ins2Akita littermates were treated with vehicle (Veh; 0.3% ethanol) or the sEH inhibitor (sEH-I) from the age of 6 weeks. (a) Body weight and (b) fasting blood glucose were recorded at monthly intervals. (c) Systolic blood pressure (SBP) and (d) heart rate (HR) were assessed at the age of 12 months. e, sEH (red) and glutamine synthetase (GS; green) in retinas from 12 month old Ins2Akita mice and their wild-type littermates. Glial fibrillary acidic protein (GFAP; blue). Retinas from sEH−/− mice were used to demonstrate the specificity of the sEH antibody used. f, Retinal digest preparations from 3 month old Ins2Akita mice and their non-diabetic wild-type littermates; Acellular capillaries are marked by arrows. g–j, Quantitative retinal morphometry images shown in f; i.e., endothelial cells (EC, g), pericytes (PC, h), extravascular pericytes (ev-PC, i) and acellular capillaries (ac-Cap, j). k, Quantification of leaked FITC-BSA. l, Retinal digest preparations from 6 month old Ins2Akita mice and their non-diabetic wild-type littermates. Acellular capillaries are marked by arrows. m–p, Quantitative retinal morphometry of images in l. q, Quantification of leaked FITC-BSA. Scale bars 50 μm. n = 4 (a–b), 6 (e–q) or 8 (c–d) mice per group. Data are mean ± s.e.m. P values determined by 2way ANOVA (a–d), or Student’s two-tailed t-test (g–k, m–q).
Extended Data Figure 2. Epoxide and diol profile in retinas from wild-type and Ins2Akita mice and sEH expression in high fat-fed mice.
a, Effect of diabetes and sEH inhibition on metabolites of polyunsaturated fatty acids in 12 month old wild-type (WT) and Ins2Akita (Akita) mice treated with either vehicle (Veh; 0.3% ethanol) or sEH inhibitor (sEH-I). EET, epoxyeicosatrienoic acid; DHET, dihydroxyeicosatrienoic acid; HODE, hydroxyoctadecadienoic acid; DiHOME, dihydroxyoctadecenoic acid; EpOME, epoxyoctadecenoic acid; EpETE, epoxyeicosatetraenoic acid; DiHETE, dihydroxyeicosatetraenoic acid; HEPE, hydroxyeicosapentaenoic acid; EDP, epoxydocosapentaenoic acid; DHDP, dihydroxydocosapentaenoic acid; nd = not detectable. n = 6 biologically independent samples per group. b, Expression of epoxide hydrolase (Ephx) genes in retinas from 12 month old wild-type (WT) and Ins2Akita (Akita) littermates. c, Retinal sEH expression in wild-type mice given a normal diet (ND, n = 6) or a high fat, high carbohydrate (HFHC, n = 8) diet for 20 weeks. For gel source data, see Supplementary Fig. 1. d, sEH activity in retinas from mice given a normal diet (ND, n = 6) or a high fat, high carbohydrate (HFHC, n = 8) diet. e, Retinal digest preparations from animals fed a normal diet (ND) or a high fat, high carbohydrate (HFHC) diet for 20 weeks. Acellular capillaries are marked by arrows. f–i, Quantitative retinal morphometry of the images shown in e; i.e., endothelial cells (EC, f), pericytes (PC, g), extravascular pericytes (ev-PC, h) and acellular capillaries (ac-Cap, i). n = 6 mice per group (b, e–i). Data expressed as mean ± s.e.m. P values determined by 1way ANOVA (a), or Student’s two-tailed t-test (b–d, f–i).
Extended Data Figure 3. Growth factor expression in the retina and lipid raft preparations.
a–m, Growth factor expression in retinas from wild-type (WT) and Ins2Akita (Akita) littermates treated with vehicle (Veh; 0.3% ethanol) or the sEH inhibitor (sEH-I). n = 6 biologically independent samples per group. n–o, Endothelial cells and pericytes were co-cultured and treated with solvent, 19,20-EDP or 19,20-DHDP in the presence of sEH inhibitor. Lipid rafts (LR) were isolated by gradient centrifugation (see Methods) and the distribution of (n) VE-cadherin and (o) N-cadherin assessed by Western blotting. Flotillin-1 (Flot1) was included as a marker of lipid raft enriched fractions. Similar results were obtained in 3 additional cell batches. p–q, Co-precipitation of p120 with (p) N-cadherin and (q) VE-cadherin in endothelial cell-pericyte co-cultures after treatment with solvent, 19,20-EDP or 19,20-DHDP. VEGF was included as a positive control. Similar results were obtained in 3 additional experiments. r, VE-cadherin phosphorylation in endothelial cells treated with solvent, 19,20-EDP, 19,20-DHDP or VEGF for 5 or 15 minutes. For gel source data, see Supplementary Fig. 1. Comparable results were obtained in 3 additional experiments. Data expressed as mean ± s.e.m. P values determined by 2way ANOVA.
Extended Data Figure 4. Mural cell coverage and N-cadherin localization in endothelial cell-pericyte co-cultures.
a, Smooth muscle actin (α-SMA) showing mural cell coverage of 20 μm, 15 μm and 10 μm diameter retinal vessels; bar = 50 mm. Comparable results were obtained in retinas from 5 additional animals in each group. b, Permeability of human endothelial cells to dextrans of different molecular mass; n = 6 independent cell preparations. c, VE-cadherin and N-cadherin expression in endothelial cells (EC), pericytes (PC) or endothelial-pericyte co-cultures (EC+PC). Similar results were obtained in 3 different cell batches. For gel source data, see Supplementary Fig. 1. d, Cartoon showing the filter-based co-culture system studied. e, VE-cadherin (red), N-cadherin (green), desmin (cyan) and DAPI (grey) on transwell membranes with endothelial-pericyte co-cultures; bar = 5 μm in top view and 2 μm in side views. Similar observations were made in 2 additional experiments. f–g, Internalized N-cadherin (yellow) in pericytes treated with solvent, 19,20-EDP or 19,20-DHDP in the presence of sEH inhibitor; n = 5 independent experiments; bar = 10 μm. Data expressed as mean ± s.e.m. P values determined by 1way ANOVA.
Extended Data Figure 5. Association of cholesterol with cadherins and PS1.
a, Experimental pipeline for studying the association of proteins with cholesterol in Fig. 3n–o. b, Reverse immunoprecipitation for studying the association of proteins with cholesterol. Note the difference in step 5 and 6 from experimental procedure in a. c–e, Representative Li-cor system images. Proteins clicked with cholesterol were visualized in green; i.e. (c) N-cadherin, (d) VE-cadherin and (e) presenilin1 (PS1-F: full length; PS1-N: N-terminal fragment) were detected on the same membrane and visualized in red. Comparable results were observed in 3 additional experiments.
Extended Data Figure 6. 1H MAS NMR spectra from native brain membranes and epoxide-diol profile of retinas 14 days after adenovirus injection.
a, 1H MAS NMR spectra of membranes from wild-type and a sEH−/− mouse brains. At low temperatures ordered phases are predominant. They are characterized by a high chemical shift anisotropy and strong dipolar couplings resulting in broad components with low spectral resolution and pronounced spinning sidebands. With increasing temperatures narrow components caused by fast axial motions and gauche-trans isomerization of the acyl chains dominate the centerband of the 1H MAS NMR spectrum. Therefore, the centerband CH2 resonance is a qualitative indicator of membrane dynamics and lipid order. b, Fatty acid epoxide and diol levels in retinas from wild-type animals 14 days after administration of adenovirus encoding GFP, wild-type sEH (sEH) or a sEH mutant without epoxide hydrolase activity (ΔEH), some of animals were treated with the sEH inhibitor (sEH+I) immediately after virus injection. EET, epoxyeicosatrienoic acid; DHET, dihydroxyeicosatrienoic acid; HODE, hydroxyoctadecadienoic acid; DiHOME, dihydroxyoctadecenoic acid; EpOME, epoxyoctadecenoic acid; EDP, epoxydocosapentaenoic acid; DHDP, dihydroxydocosapentaenoic acid. nd = not detectable; n = 6 biologically independent samples per group, Data expressed as mean ± s.e.m. P values determined by 1way ANOVA.
Extended Data Figure 7. sEH-induced retinopathy.
Desmin staining of non-diabetic wild-type retinas 14 days after administration of adenoviruses encoding GFP, wild-type sEH (sEHWT) or a sEH mutant without epoxide hydrolase activity (sEHΔEH). Some mice were treated with the sEH inhibitor (sEH-I). Arrows indicate desmin negative regions along a retinal artery. Comparable observations were made using 5 additional animals in each group.
Extended Data Figure 8. Retinopathy induced by AAV-mediated sEH overexpression in non-diabetic mice.
a, sEH (red) in retinas from wild-type mice 3 months after intravitreal injection of 1010 genomic copies of AAV-RLBP1-sEHWT (with myc-tag, green). b, Retinal digest preparations from wild-type mice 3 months after intravitreal injection of 1010 genomic copies of AAV-RLBP1-GFP (CTL) or AAV-BLBP1-sEHWT. sEH inhibitor (sEH-I) treatment began directly after AAV injection. Acellular capillaries are marked by arrows, Bar = 50 μm. c–f, Quantitative retinal morphometry of the images shown in b; i.e. endothelial cells (EC, c), pericytes (PC, d), extravascular pericytes (ev-PC, e) and acellular capillaries (ac-Cap, f). g, Desmin (red) and CD31 (cyan) in retinas from wild-type mice 3 months after intravitreal injection of AAVs. Scale bars = 50 μm. n = 6 (a, g) or 8 (b–f) mice per group. Data expressed as mean ± s.e.m. P values determined by 1way ANOVA.
Extended data Table 1.
Characteristics of retina donors; DR = diabetic retinopathy, NPDR = non-proliferative diabetic retinopathy, DM = diabetes mellitus.
| Pathology | n | Male | Female | Age | DM Type 1 | DM Type 2 |
|---|---|---|---|---|---|---|
| Non-DR | 6 | 4 | 2 | 75.7±3.1 | ||
| Mild NPDR | 7 | 4 | 3 | 57.2±13.0 | 2 | 5 |
| Severe NPDR | 6 | 4 | 2 | 62.2±11.8 | 2 | 4 |
Extended data Table 2.
Characteristics of vitreous humor donors with type 2 diabetes mellitus (DM); MEM = macular epiretinal membrane; IMH: Idiopathic macular hole.
| Pathology | n | Male | Female | Age | MEM | IMH | DM Type 2 |
|---|---|---|---|---|---|---|---|
| Non-DR | 14 | 6 | 8 | 58.9±8.0 | 7 | 7 | |
| DR | 17 | 8 | 9 | 57.0±9.9 | 17 |
Acknowledgments
The authors are indebted to Katharina Engel-Herbig, Katharina Bruch, Nadine Dietrich and Isabel Winter for expert technical assistance. This work was supported by the Deutsche Forschungsgemeinschaft (SFB-TR 23/A6 and B7, GRK 880 and Exzellenzcluster 147 “Cardio-Pulmonary Systems”) with partial support from NIEHS R01 ES002710. J.dM. was supported by the Deutsche Forschungsgemeinschaft Graduate School CLIC, and J.H. was the recipient of a research award from the Global Ophthalmology Awards Program from Bayer.
Footnotes
Author contributions
J.H. and I.F. designed the experiments and analysed the data. J.H., S.D., S.-I.B., K.D., S.L. and R.P. performed experiments, S.Z. and K.A. generated the epoxide and diol profiles. J.L. and H.-P.H generated and characterized the retinal digest preparations. Z.C., L.W., C.G.E., A.S., and S.F. characterized and provided human samples. J.dM. and C.G. performed the NMR studies using isolated membranes and T.F., A.J. and O.J.M. generated the adeno-associated viruses. B.D.H. provided advice, feedback and the sEH inhibitor. J.H. and I.F. wrote the manuscript.
Competing financial interests.
J.H., T.F., R.P. and I.F. are authors of patent applications for the use of sEH inhibitors for the treatment of non-proliferative diabetic retinopathy (German Patent Application No. 10 2016 109 709.8, International PCT Patent Application No. PCT/EP2017/062618). S.F. is an employee of F. Hoffmann-La Roche Ltd, Basel, Switzerland. B.D.H. is author of the University of California patents on sEH inhibitors licensed to EicOsis. None of the other authors have any disclosures to declare.
References
- 1.Yau JWY, et al. Global prevalence and major risk factors of diabetic retinopathy. Diabetes Care. 2012;35:556–564. doi: 10.2337/dc11-1909. [DOI] [PMC free article] [PubMed] [Google Scholar]
- 2.Bourne RRA, et al. Causes of vision loss worldwide, 1990–2010: a systematic analysis. Lancet Glob Health. 2013;1:e339–e349. doi: 10.1016/S2214-109X(13)70113-X. [DOI] [PubMed] [Google Scholar]
- 3.Antonetti DA, Klein R, Gardner TW. Diabetic retinopathy. New Engl J Med. 2012;366:1227–1239. doi: 10.1056/NEJMra1005073. [DOI] [PubMed] [Google Scholar]
- 4.Robinson R, et al. Update on animal models of diabetic retinopathy: from molecular approaches to mice and higher mammals. Dis Model Mech. 2012;5:444–456. doi: 10.1242/dmm.009597. [DOI] [PMC free article] [PubMed] [Google Scholar]
- 5.Klaassen I, Van Noorden CJF, Schlingemann RO. Molecular basis of the inner blood-retinal barrier and its breakdown in diabetic macular edema and other pathological conditions. Prog Retin Eye Res. 2013;34:19–48. doi: 10.1016/j.preteyeres.2013.02.001. [DOI] [PubMed] [Google Scholar]
- 6.Barber AJ, et al. The Ins2Akita mouse as a model of early retinal complications in diabetes. Inves Ophth Vis Sci. 2005;46:2210–2218. doi: 10.1167/iovs.04-1340. [DOI] [PubMed] [Google Scholar]
- 7.Hu J, et al. Müller glia cells regulate Notch signaling and retinal angiogenesis via the generation of 19,20-dihydroxydocosapentaenoic acid. J Exp Med. 2014;211:281–295. doi: 10.1084/jem.20131494. [DOI] [PMC free article] [PubMed] [Google Scholar]
- 8.Hwang SH, et al. Orally bioavailable potent soluble epoxide hydrolase inhibitors. J Med Chem. 2007;50:3825–3840. doi: 10.1021/jm070270t. [DOI] [PMC free article] [PubMed] [Google Scholar]
- 9.Gerhardt H, Betsholtz C. Endothelial-pericyte interactions in angiogenesis. Cell Tissue Res. 2003;314:15–23. doi: 10.1007/s00441-003-0745-x. [DOI] [PubMed] [Google Scholar]
- 10.Hammes HP, et al. Pericytes and the pathogenesis of diabetic retinopathy. Diabetes. 2002;51:3107–3112. doi: 10.2337/diabetes.51.10.3107. [DOI] [PubMed] [Google Scholar]
- 11.Enge M, et al. Endothelium-specific platelet-derived growth factor-B ablation mimics diabetic retinopathy. EMBO J. 2002;21:4307–4316. doi: 10.1093/emboj/cdf418. [DOI] [PMC free article] [PubMed] [Google Scholar]
- 12.Gerhardt H, Wolburg H, Redies C. N-cadherin mediates pericytic-endothelial interaction during brain angiogenesis in the chicken. Dev Dyn. 2000;218:472–479. doi: 10.1002/1097-0177(200007)218:3<472::AID-DVDY1008>3.0.CO;2-#. [DOI] [PubMed] [Google Scholar]
- 13.Navaratna D, McGuire PG, Menicucci G, Das A. Proteolytic degradation of VE-cadherin alters the blood-retinal barrier in diabetes. Diabetes. 2007;56:2380–2387. doi: 10.2337/db06-1694. [DOI] [PubMed] [Google Scholar]
- 14.Gavard J, Gutkind JS. VEGF controls endothelial-cell permeability by promoting the β-arrestin-dependent endocytosis of VE-cadherin. Nat Cell Biol. 2006;8:1223–1234. doi: 10.1038/ncb1486. [DOI] [PubMed] [Google Scholar]
- 15.Huster D, Arnold K, Gawrisch K. Influence of docosahexaenoic acid and cholesterol on lateral lipid organization in phospholipid mixtures. Biochemistry. 1998;37:17299–17308. doi: 10.1021/bi980078g. [DOI] [PubMed] [Google Scholar]
- 16.Wassall SR, Stillwell W. Polyunsaturated fatty acid-cholesterol interactions: domain formation in membranes. Biochim Biophys Acta. 2009;1788:24–32. doi: 10.1016/j.bbamem.2008.10.011. [DOI] [PubMed] [Google Scholar]
- 17.Cai J, et al. PEDF regulates vascular permeability by a γ-secretase-mediated pathway. PLoS ONE. 2011;6:e21164. doi: 10.1371/journal.pone.0021164. [DOI] [PMC free article] [PubMed] [Google Scholar]
- 18.Georgakopoulos A, et al. Presenilin-1 forms complexes with the cadherin/catenin cell-cell adhesion system and is recruited to intercellular and synaptic contacts. Mol Cell. 1999;4:893–902. doi: 10.1016/s1097-2765(00)80219-1. [DOI] [PubMed] [Google Scholar]
- 19.Baki L, et al. Presenilin-1 binds cytoplasmic epithelial cadherin, inhibits cadherin/p120 association, and regulates stability and function of the cadherin/catenin adhesion complex. Proc Natl Acad Sci USA. 2001;98:2381–2386. doi: 10.1073/pnas.041603398. [DOI] [PMC free article] [PubMed] [Google Scholar]
- 20.Serban G, et al. Cadherins mediate both the association between PS1 and β-catenin and the effects of PS1 on β-catenin stability. J Biol Chem. 2005;280:36007–36012. doi: 10.1074/jbc.M507503200. [DOI] [PMC free article] [PubMed] [Google Scholar]
- 21.Kouchi Z, et al. p120 catenin recruits cadherins to γ-secretase and inhibits production of Aβ peptide. J Biol Chem. 2009;284:1954–1961. doi: 10.1074/jbc.M806250200. [DOI] [PMC free article] [PubMed] [Google Scholar]
- 22.Saka SK, et al. Multi-protein assemblies underlie the mesoscale organization of the plasma membrane. Nat Commun. 2014;5:4509. doi: 10.1038/ncomms5509. [DOI] [PMC free article] [PubMed] [Google Scholar]
- 23.Hulce JJ, et al. Proteome-wide mapping of cholesterol-interacting proteins in mammalian cells. Nat Meth. 2013;10:259–264. doi: 10.1038/nmeth.2368. [DOI] [PMC free article] [PubMed] [Google Scholar]
- 24.Morisseau C, et al. Structural refinement of inhibitors of urea-based soluble epoxide hydrolases. Biochem Pharmacol. 2002;63:1599–1608. doi: 10.1016/s0006-2952(02)00952-8. [DOI] [PubMed] [Google Scholar]
- 25.Pellissier LP, et al. Specific tools for targeting and expression in Müller glial cells. Mol Ther -Meth Clin D. 2014;1:14009. doi: 10.1038/mtm.2014.9. [DOI] [PMC free article] [PubMed] [Google Scholar]
- 26.Calabria AR, et al. Puromycin-purified rat brain microvascular endothelial cell cultures exhibit improved barrier properties in response to glucocorticoid induction. J Neurochem. 2006;97:922–933. doi: 10.1111/j.1471-4159.2006.03793.x. [DOI] [PubMed] [Google Scholar]
- 27.Czupalla CJ, Liebner S, Devraj K. In vitro models of the blood-brain barrier. Methods Mol Biol. 2014;1135:415–437. doi: 10.1007/978-1-4939-0320-7_34. [DOI] [PubMed] [Google Scholar]
- 28.Bess E, Fisslthaler B, Frömel T, Fleming I. Nitric oxide-induced activation of the AMP-activated protein kinase α2 subunit attenuates IκB kinase activity and inflammatory responses in endothelial cells. PLoS ONE. 2011;6:e20848. doi: 10.1371/journal.pone.0020848. [DOI] [PMC free article] [PubMed] [Google Scholar]
- 29.Kovacevic I, et al. The F-BAR protein NOSTRIN participates in FGF signal transduction and vascular development. EMBO J. 2012;31:3309–3322. doi: 10.1038/emboj.2012.176. [DOI] [PMC free article] [PubMed] [Google Scholar]
- 30.Hammes HP, et al. Aminoguanidine treatment inhibits the development of experimental diabetic retinopathy. Proc Natl Acad Sci USA. 1991;88:11555–11558. doi: 10.1073/pnas.88.24.11555. [DOI] [PMC free article] [PubMed] [Google Scholar]
- 31.Barbosa-Sicard E, et al. Inhibition of the soluble epoxide hydrolase by tyrosine nitration. J Biol Chem. 2009;284:28156–28163. doi: 10.1074/jbc.M109.054759. [DOI] [PMC free article] [PubMed] [Google Scholar]
- 32.Rivera J, et al. Measurement of 20-hydroxyeicosatetraenoic acid in human urine by gas chromatography-mass spectrometry. Clin Chem. 2004;50:224–226. doi: 10.1373/clinchem.2003.025775. [DOI] [PubMed] [Google Scholar]
- 33.Busse R, Lamontagne D. Endothelium-derived bradykinin is responsible for the increase in calcium produced by angiotensin-converting enzyme inhibitors in human endothelial cells. Naunyn Schmiedebergs Arch Pharmacol. 1991;344:126–129. doi: 10.1007/BF00167392. [DOI] [PubMed] [Google Scholar]
- 34.Paolinelli R, et al. Wnt activation of immortalized brain endothelial cells as a tool for generating a standardized model of the blood brain barrier in vitro. PLoS ONE. 2013;8:e70233. doi: 10.1371/journal.pone.0070233. [DOI] [PMC free article] [PubMed] [Google Scholar]
- 35.Taddei A, et al. Endothelial adherens junctions control tight junctions by VE-cadherin-mediated upregulation of claudin-5. Nat Cell Biol. 2008;10:923–934. doi: 10.1038/ncb1752. [DOI] [PubMed] [Google Scholar]
- 36.Xiao K, et al. p120-Catenin regulates clathrin-dependent endocytosis of VE-cadherin. Mol Biol Cell. 2005;16:5141–5151. doi: 10.1091/mbc.E05-05-0440. [DOI] [PMC free article] [PubMed] [Google Scholar]
- 37.Fleming I, Fisslthaler B, Dixit M, Busse R. Role of PECAM-1 in the shear-stress-induced activation of Akt and the endothelial nitric oxide synthase (eNOS) in endothelial cells. J Cell Sci. 2005;118:4103–4111. doi: 10.1242/jcs.02541. [DOI] [PubMed] [Google Scholar]
- 38.Vetrivel KS, et al. Association of γ-secretase with lipid rafts in post-Golgi and endosome membranes. J Biol Chem. 2004;279:44945–44954. doi: 10.1074/jbc.M407986200. [DOI] [PMC free article] [PubMed] [Google Scholar]
Associated Data
This section collects any data citations, data availability statements, or supplementary materials included in this article.
Data Availability Statement
The authors declare that the data supporting the findings of this study are available within the paper and its supplementary information files.


