Abstract
The CLARITY technique enables 3-dimensional visualization of fluorescent-labeled biomolecules in clarified intact brain samples, affording a unique view of molecular neuroanatomy and neurocircuitry. It is therefore essential to find the ideal combination for clearing tissue and detecting the fluorescent-labeled signal. This method requires the formation of a formaldehyde-acrylamide fixative-generated hydrogel mesh through which cellular lipid is removed with sodium dodecyl sulfate. Several laboratories have used differential acrylamide and detergent concentrations to achieve better tissue clearing and antibody penetration, but the potential effects upon fluorescent signal retention is largely unknown. In an effort optimize CLARITY processing procedures we performed quantitative parvalbumin immunofluorescence and lectin-based vasculature staining using either 4 or 8% sodium dodecyl sulfate detergent in combination with different acrylamide formulas in mouse brain slices. Using both confocal and CLARITY optimized light-sheet microscope-acquired images, we demonstrate that 2% acrylamide monomer combined with 0.0125% bis-acrylamide and cleared with 4% sodium dodecyl sulfate generally provides the most optimal signal visualization amongst various hydrogel monomer concentrations, lipid removal times, and detergent concentrations.
Keywords: CLARITY, immunofluorescence, imaging, cortex, vasculature
Introduction
Over the last several years, innovative tissue transparency techniques have emerged that allow for microscopic 3-dimensional (3D) examination of endogenous fluorescent transgenic signals (e.g. yellow fluorescent protein-conjugated promotors) and immunofluorescence in large tissue volumes (reviewed by (Richardson and Lichtman 2015). Several methods using lipid removal with subsequent tissue refractive index matching have proved valuable tools for visualizing both local neuronal networks and long-range fiber tract systems, providing a greater understanding of uninterrupted brain interconnectivity.
The CLARITY (Chung et al. 2013; Tomer et al. 2014), iDISCO (Renier et al. 2014), and CUBIC (Susaki et al. 2015) techniques appear most ideal for visualizing immunofluorescent signal in thick tissue samples. Of these, CLARITY has been most often employed to elucidate circuitry related to normal behavior and human disease states. The CLARITY method has highlighted distinct mapping of dopaminergic projection neurons (Menegas et al. 2015), connections underlying information processing in the prefrontal cortex (Ye et al. 2016), the neuropathology of autism (Chung et al. 2013), hemimegalencephaly (Costantini et al. 2015), Alzheimer’s (Ando et al. 2014) and Parkinson’s disease (Liu et al. 2016) as well as animal models of schizophrenia (Bastrup and Larsen 2017).
Although CLARITY provides a strong platform for navigating biological systems in large transparent brain tissue samples, it has not been without its challenges and has been modified by numerous laboratories. The original CLARITY manuscript by Chung et al. (2013) describes three key steps prior to imaging: 1) hydrogel tissue embedding using a ratio of 4% acrylamide monomer to 0.05% bis-acrylamide followed by polymerization; 2) removal of lipids by way of 4% sodium dodecyl sulfate (SDS) detergent buffer within a custom built electrophoretic tissue clearing system (ETC); and 3) conducting immunostaining with ensuing tissue refractive index matching. Achieving and/or visualizing antibody penetration and target signal under the initial protocol can be quite challenging perhaps due to a number of factors including individual variability in ETC systems, the inherent variable evaluation of tissue clearing, and/or general laboratory procedures. As a result, several investigators have made efforts to optimize CLARITY ETC parameters including clearing temperature, paraformaldehyde concentration, and acrylamide content (Bastrup and Larsen 2017; Epp et al. 2015; Lee et al. 2014), or the implementation of stochastic electrotransport (Kim et al. 2015).
A number of publications also point to a major shift favoring “passive clearing” without the use of ETC as this technique may distort or induce oxidative tissue artifacts (Chung et al. 2013). Such methods have incorporated both the original acrylamide-based fixative formula (Magliaro et al. 2016; Poguzhelskaya et al. 2014; Stefaniuk et al. 2016; Zhang et al. 2014) or its reduction to accomplish more rapid lipid removal. Changing the ratio of acrylamide monomer to bis-acrylamide (Costantini et al. 2015; Epp et al. 2015; Lerner et al. 2015; Liu et al. 2016; Miller and Rothstein 2016; Phillips et al. 2016; Tomer et al. 2014; Treweek et al. 2015; Woo et al. 2016; Yang et al. 2014; Yu et al. 2017; Zheng and Rinaman 2016) has also been instituted concomitantly with standard or increased 8% SDS clearing buffer concentrations to expedite tissue transparency (Miller and Rothstein 2016; Woo et al. 2016; Yang et al. 2014; Yu et al. 2017).
Despite the success of these modified CLARITY procedures in brain tissue, questions still remain regarding their effects on antigen preservation using antibody-based detection methods or non-neuronal structural staining. Previous quantitative evaluation of CLARITY methods shows that the original ETC 4% SDS protocol by Chung et al. (2013) results in minimal overall protein loss (~8% total). Similarly, Yang et al. (2014) reported that passive clearing of 4% acrylamide monomer-infused tissue (in the absence of bis-acrylamide) using 8% SDS is also associated with marginal protein loss. Yet, the potential measurable effects of acrylamide and/or SDS manipulation on immunofluorescence and structural marker staining has been largely uninvestigated. To this end, the current study examines the potential quantitative effects of passive lipid removal using an array of novel acrylamide formulas using 4% or 8% SDS clearing buffer preceding parvalbumin (PV) immunofluorescence and vasculature staining. To achieve this, sample measurements were taken through Z-stacks captured by both standard confocal microscopy and the use of a CLARITY Optimized Lightsheet Microscope (COLM) system. The results of these experiments will further contribute to understanding the effects of SDS and alternative hydrogel mesh compositions on fluorescence-labeling using CLARITY-based techniques.
Methods
Animal care
Adult male C57BL/6J mice (n=34, Charles River Laboratories) were housed in a room with a light/dark schedule with lights on and off at 5:00 a.m. and 7:00p.m., respectively, and provided with food/water ad-libitum. Mice were acclimated to housing conditions for one week and then anesthetized with intraperitoneal injection of phenobarbital (10μl/g) prior to perfusion procedures. All animal experiments were performed according guidelines set forth by the National Institutes of Health guidelines for the care and use of animals in compliance with the Institutional Animal Care and Use Program at the University of Michigan.
Preliminary acrylamide polymerization experiments
Similar to previous methods (Chung et al., 2013), fixative concentrations were diluted from stock solutions of 40% acrylamide monomer (Bio-Rad Laboratories, Inc.), 2% bis-acrylamide (Bio-Rad Laboratories, Inc.) and 16% paraformaldehyde (PFA; Electron Microscopy Sciences). In an effort to increase hydrogel pore size (determined by gel viscosity) versus the original CLARITY acrylamide formula composed of 0.05% bis-acrylamide, 4% acrylamide monomer, 4% PFA, and 0.25% thermo VA-044 initiator (Wako Chemicals USA, Inc.) in 0.01M phosphate-buffered saline (PBS) (Chung et al., 2013), we incrementally reduced the bis-acrylamide concentrations to 0.0375%, 0.025%, 0.0125%, and 0.00625%. Following polymerization, visual inspection was used to observe the sequential transition from solid, viscous, and liquid phase (i.e., smaller to larger pore sizes, supplemental Fig. ESM_1).
Acrylamide perfusion, polymerization, and lipid removal
Based upon preliminary acrylamide polymerization experiments using a concentration of 0.0125% bis-acrylamide, either 1%, 2%, 3%, or 4% acrylamide monomer was combined with 4% PFA and 0.25% thermo VA-044 initiator enzyme in 0.01M PBS (n=5/group). Each mouse was perfused with room temperature 0.9% saline and then 20 ml of the appropriate ice-cold acrylamide/PFA/VA-044 enzyme fixative concentration. Surgically extracted brains were placed in 20 ml of the same perfusion solution for 18 hours at 4°C for further fixation before being degassed in a nitrogen-filled vacuum for 20 minutes and polymerized 3 hours at 37°C. Brains were removed from the acrylamide, extensively rinsed in PBS+ 0.1% Triton X-100, placed into a stainless steel brain matrix (Zivic Instruments), and sectioned into 2 mm slices. In the first experiment, striatal slices (~Bregma −0.60 to −2.60 mm) were hemisected (n=5 sections/acrylamide monomer concentration) with one side passively cleared in 40 ml of 4% SDS in 0.2M boric acid buffer and the other in 8% SDS using constant agitation at 37°C (for workflow, see Fig. 1). Sections were visually inspected daily and considered adequately cleared of lipid when completely transparent (including absence of corpus callosum) following placement upon a grid pattern positioned underneath Plexiglas®. In a second experiment carried out in parallel, bilateral 2 mm-thick sections were cleared in 4% SDS/boric acid for 14 days amongst all tested acrylamide concentrations. Both hemi- and bilateral cleared sections were rinsed overnight in 0.02M boric acid + 0.1% Triton X-100 and stored at 4°C until staining procedures were initiated. In order to assess tissue expansion during CLARITY processing, a separate set of similarly processed striatal sections were analyzed for possible volume changes. Following 4% SDS clearing times matching those for both confocal and COLM experiments as well as final incubation in 88% Histodenz refractive index-matching solution (n=3-4/group), individual tissue volume (length × width × thickness) was measured using electronic digital calipers (Kobalt 293883, Lowe’s, Mooresville, NC).
Figure 1. CLARITY processing workflow for 4%, 3%, 2%, and 1% acrylamide monomer + 0.0125% bis-acrylamide groups.
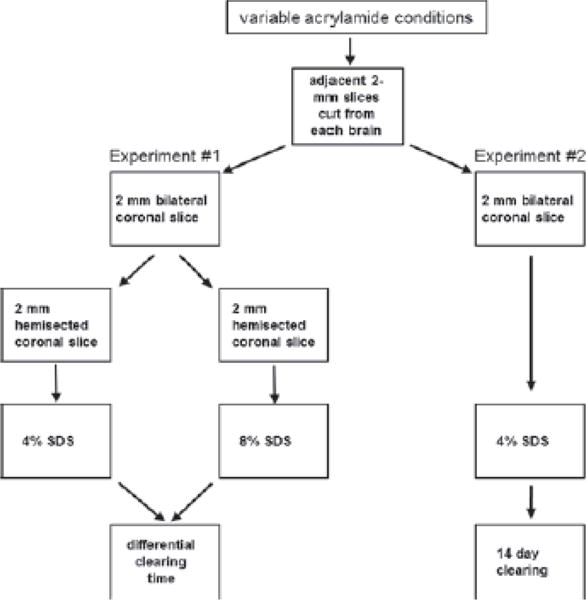
Experiment #1 utilizes hemisected slices for testing acrylamide-specific clearing times using 4% or 8% SDS. In Experiment #2, all sections are bilateral and rinsed in 4% SDS for 14 days.
Immunofluorescence and vasculature staining
Hemisected brain slices were incubated in 1 ml of 0.02M boric acid + 0.1% Triton X-100 containing mouse anti-PV primary antibody (1:200, Sigma) for 3 days at 37°C with gentle agitation. Following rinsing overnight in 0.02M boric acid + 0.1% Triton X-100, sections were placed in CF594 goat anti-mouse fab-fragment secondary antibody (1:200, Sigma) for 3 days and again rinsed overnight in 0.02M boric acid + 0.1% Triton X-100. Post-immunostaining, slices were incubated 48 hours in fluorescein-conjugated tomato lectin (1:100, Vector Laboratories) and DAPI (1:500, Vector Laboratories), for vasculature and nuclear staining, respectively, and placed in 88% Histodenz (Sigma) refractive index matching solution (RIMS; Yang et al., 2014) for 18 hours at 37°C. Similar procedures were used for 2 mm bilateral non-hemisected coronal sections, however, antibody and rinsing volumes were increased to 1.5 ml. In addition, a combination of rabbit anti-tyrosine hydroxylase (1:500, Watson laboratory) and CF647 goat anti-rabbit fab-fragment secondary antibody (1:200, Sigma) was applied for double-label immunofluorescence.
Confocal Microscopy
Image acquisition
Tissue slices were placed in an 88% Histodenz-filled chamber made with 3M™ mounting putty on a glass slide and coverslipped. Image stacks were acquired on an Olympus Fluoview 1000 confocal microscopy system using a 10x/0.4 NA objective (WD: 2.2 mm) at 405 nm (DAPI), 488 nm (Lectin), 594 nm (PV) excitation. Image resolution was 1024 × 1024 (1.24 μm/pixel × 1.24 μm/pixel) in the xy-plane with step size of 2.5μm/slice. Region of interest for the acquired image stacks was kept consistent for all the samples - motor (M1 and M2) and cingulate (cg1 and cg2) cortex on the rostral side (~Bregma-0.60 mm, Paxinos and Franklin, 2001); motor (M1 and M2) and retrosplenial cortex (RSA and RSG) on the caudal side (~Bregma-1.60 mm).
Image visualization and processing
Three-dimensional volume rendering and orthogonal slice mode visualization were performed using Amira software (FEI) and Imaris (Oxford Instruments Company). Acquired image stacks were processed to achieve optimum signal/background thresholding for PV+ neurons and lectin-stained vasculature. First, individual xy-planes were normalized for non-uniform illumination using a background detection-correction algorithm in Amira followed by the use of a local edge derived filter to smoothen the images. Images were then processed using an interactive thresholding algorithm to visually extract the PV+ neurons and lectin stained vasculature. Thresholding was blinded to avoid any bias, however, the extent of thresholding was validated manually and visually across the samples to make sure it included only neuronal cell bodies and vessels but not the artifacts resulting from background or fragmented objects.
COLM Imaging
Imaging of large intact samples was performed on the CLARITY-optimized lightsheet microscope (COLM) (Chung et al. 2013; Tomer et al. 2014). Two mm-thick clarified samples were mounted in a quartz cuvette containing 88% Histodenz. To keep the sample stationary and upright while imaging, we used polymerized 1% agarose gel of appropriate thickness stacked between the sample and cuvette side facing opposite to the camera objective. As opposed to single stacks acquired by confocal microscopy, the entire coronal slice was acquired in a series of tiles with a 10x/0.6 NA objective (WD: 3 mm). Image stacks had a pixel size of 0.585 μm/pixel × 0.585 μm/pixel in the xy-plane and a step size of 5 μm. Number of tiles was specified by defining the coordinates of the two opposing corners of the entire tissue slice and 15–20% tile overlap. Following the optimization of lightsheet and focal plane alignment parameters over the entire tissue area, final image acquisition was initiated. Tiles of acquired image stacks were stitched together using a script based on TeraStitcher (Integrated Research Centre of University Campus Bio-Medico of Rome, Italy).
Image visualization and processing
Stitched coronal image volumes were rendered and visualized in 3D using Amira and Imaris software. For the purpose of analysis, a small 3D volume which represents the barrel field of primary somatosensory cortex was cropped from the whole coronal volume and was kept consistent across all samples. Images were processed as described above for confocal microscopy.
Quantitative and statistical analysis
PV+ interneurons were analyzed in terms of mean neuron number, area, and intensity using Amira software. Quantified PV-labeled objects (neurons) were filtered by size and circularity to include only intact cell bodies. Total area, volume, perimeter, and length were quantified for lectin stained vessel analysis using Amira software. One-way ANOVA with post-hoc Tukey test was performed to compare the means amongst experimental groups. Data is represented as mean ± SD and considered significant at p<0.05.
Results
Polymerization and Clearing
Preliminary experiments to increase acrylamide matrix pore size showed that implementing 0.0375% bis-acrylamide (25% reduction) or 0.025% (50% reduction) did not appreciably alter the qualitative gel state after a 3-hour polymerization at 37°C as the gel remained relatively solid (supplemental Fig. ESM_1 a,b). However, the 0.0125% and 0.00625% bis-acrylamide formulas resulted in consecutively less viscous appearances (supplemental Fig. ESM_1 c,d). Therefore, four different acrylamide monomer solutions (1-4%) were further used in conjunction with 0.0125% bis-acrylamide as it represented the solid to viscous breaking-point (Table 1). Following polymerization of the varied acrylamide solutions, the 1% and 2% monomer solutions appears as liquid. By contrast, the 3% monomer looks only slightly more viscous but “clings” to the tissue sample upon removal. Comparatively, the 4% monomer group was more solid-like and required added effort to manually extract brain slices from that solution (data not shown).
Table 1. Time to complete transparency in 2 mm-thick hemisected brain slices.
Brains were perfused with 1, 2, 3, or 4% acrylamide monomer and 0.0125% bis-acrylamide passively cleared in 4 or 8% SDS buffer.
| Acrylamide monomer | Bis-acrylamide | Days in 4% SDS | Days in 8% SDS |
|---|---|---|---|
| 4% | 0.0125% | 12 | 9 |
| 3% | 0.0125% | 10 | 8 |
| 2% | 0.0125% | 8 | 7 |
| 1% | 0.0125% | 7 | 6 |
As expected, length of time required to achieve complete tissue transparency varied as a function of both total acrylamide concentration and utilization of 4% or 8% SDS buffer. Hemisected striatal brain slices incubated in 4% SDS were adequately cleared 7, 8, 10, and 12 days when perfused with 1, 2, 3, or 4% acrylamide monomer formulas, respectively (Table 1). Contralateral slices exposed to 8% SDS cleared somewhat more quickly, in 6, 7, 8, and 9 days for each consecutively increased monomer concentration (Table 1). In all cases, clearing of brain tissue was deemed sufficient when the corpus callosum and surrounding structures were completely transparent as determined by placement upon a printed grid following SDS treatment (Fig. 2). All bilateral coronal sections from each acrylamide group were incubated in 4% SDS for 14 days and, therefore, represented extended clearing of various time frames versus the hemisected slices from the same brains. During these experiments the 1% monomer treated slices, albeit intact, proved too difficult to manually handle and could not be sufficiently positioned inside the imaging cuvette required for COLM-based immunofluorescence analysis. Therefore, this particular acrylamide group was omitted from the experiment.
Figure 2. Tissue appearance during clearing with 4% SDS.
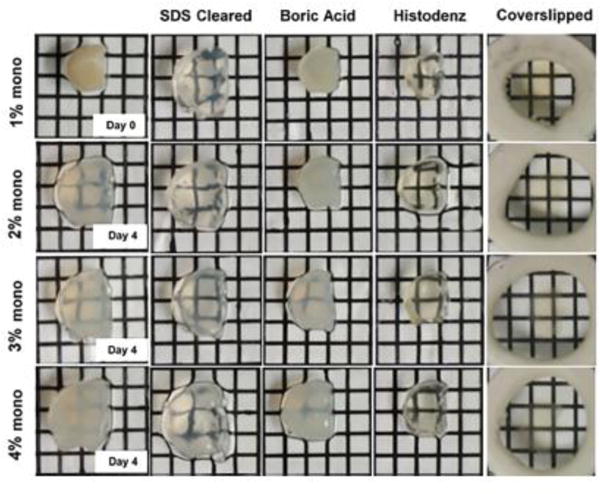
First column shows visual comparison between acrylamide concentrations at day 0 (1% monomer) and day 4 in either 2%, 3% and 4% monomer infused tissue (1% monomer at day 4 was not sufficiently cleared and appeared slightly more transparent than 2% monomer tissue, data not shown). Successive columns (left to right) demonstrate expected appearance of optically cleared slices following removal from SDS buffer, boric acid rinsing buffer, 88% Histodenz solution, and finally coverslipped in Histodenz. Abbreviations: mono; monomer, SDS; sodium dodecyl sulfate.
In a separate parallel analysis using striatal slices, we sought to determine potential acrylamide-dependent tissue expansion/contraction changes associated with the differential SDS clearing time frames encompassed by both confocal (7-12 days) and COLM (14 days) experiments. While each condition induced appreciable expansion in 4% SDS, our quantitative results showed no significant volume alterations between acrylamide groups when cleared in 4% SDS for up to 14 days (F (7, 27) =2.059, p>0.09); supplemental Fig. ESM_2). Conversely, continued processing of the same sections in 88% Histodenz revealed a trend for increasing acrylamide concentrations to retain tissue expansion and exhibit less shrinkage (F (3,10) =7.09, p<0.008). The volume of the 3% acrylamide group slices, albeit more variable, was significantly larger versus the 1% (p<0.005) and 2% (p<0.034) acrylamide formulations while insignificant from 4% (p=0.231; supplemental Fig. ESM_3). Although the latter results were also qualitatively corroborated by observation of tissue appearance following post-SDS rinsing in boric acid buffer with subsequent storage at 4°C (Fig. 2), brain slices will retain their respective expanded state (as in 37°C SDS buffer) when alternatively rinsed in boric acid buffer at 37°C prior to antibody incubation.
Quantitative immunofluorescence and lectin staining
Confocal images
To assess effects of acrylamide content and 4% vs. 8% SDS clearing buffer concentration on PV+ neuron detection and vasculature staining, confocal microscope-captured image stacks of 2 mm-thick hemisections were analyzed subsequent to Z-stack deconvolution. Measurements were limited to approximately 1.2 mm due to limited working distance between the confocal microscope objective and coverslipped tissue chamber (Fig. 3, supplemental movie ESM_4). Due to processing, regional staining artifacts prevented the quantification of a single 1% acrylamide monomer infused slice leading to a group size of n=4. Upon visual examination we noticed that the 1% and 4% acrylamide monomer groups generally had less uniform signal through the tissue extent, as well as brighter surface background, as compared to the 2% and 3% monomer slices. Evaluation of PV+ neuronal number showed a significant increase in the detection of neurons in the 2% monomer/4% SDS group vs. 4% monomer/8% SDS (F (7, 31) =2.510, p<0.02) with all other comparisons non-significant (Fig. 4). No significant difference was observed between acrylamide concentrations or their interactions with SDS buffer concentration for signal intensity (F (7, 31) =1.822, p>0.2, data not shown) or 3-dimensional surface area (F (7, 31) =0.173, p>0.9, data not shown).
Figure 3. Representative confocal images of PV immunofluorescence in the anterior cingulate cortex region.
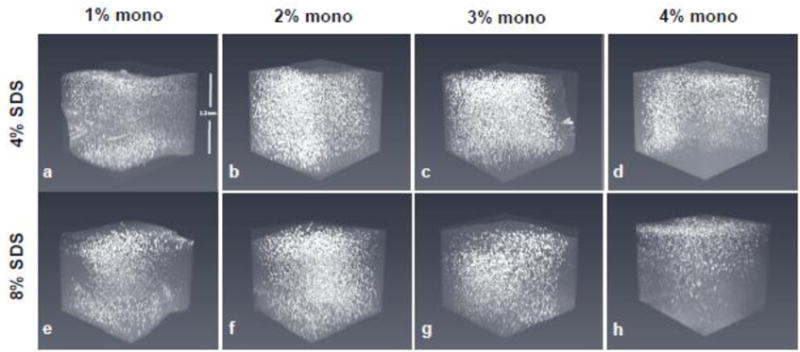
Comparison of positive signal through the top ~1.2 mm of 2 mm-thick tissue perfused slices with acrylamide monomer concentrations, by column, of 1% (A, E), 2% (B, F), 3% (C, G), and 4% (D, H) and cleared with either 4% (top row) or 8% SDS (bottom row). Note the most consistent z-plane staining is achieved using 2% and 3% monomer. Abbreviations: mono; monomer, SDS; sodium dodecyl sulfate.
Figure 4. Statistical analysis of PV+ neurons imaged using confocal microscopy.
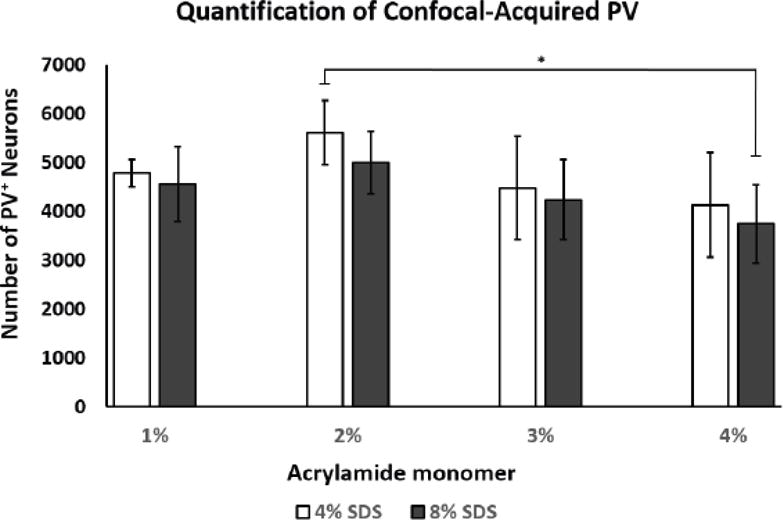
2% monomer/4% SDS showed a significantly higher number of detected PV+ neurons in vs. 4% monomer/8% SDS infused tissue (*p<0.02; 1M4S, n=4; all other groups, n=5, +/- SD). Abbreviations: PV; parvalbumin, SDS; sodium dodecyl sulfate.
Assessment of lectin-stained vasculature volume surface and area in the anterior cingulate region, double-labeled in the same sections analyzed for PV (Fig. 5,6, supplemental movie ESM_5), revealed numerous significant effects across different combinations of acrylamide/SDS concentrations. The following comparisons for lectin volume were statistically significant (F (7, 30) =17.402, p<0.05; Fig. 7, Table 2): 1M4S vs. 1M8S, 3M8S, 4M4S, 4M4S; 1M8S vs. 2M4S, 2M8S, 4M4S; 2M4S vs. 3M4S, 3M8S, 4M4S, 4M8S; 2M8S vs. 3M4S, 3M8S, 4M4S, 4M8S; 3M4S vs. 4M4S. Vasculature area, measured in the same Z-stacks, displayed comparable statistically significant changes (F (7, 30) =17.402, all p <0.04): 1M4S vs. 4M4S, 4M8S; 1M8S vs. 2M4S, 2M8S; 2M4S vs. 3M4S, 3M8S, 4M4S, 4M8S; 2M8S vs. 3M4S, 3M8S, 4M4S, 4M8S; 3M4S vs. 4M4S; 3M8S vs. 4M4S (data not shown). The 2% acrylamide formulations produced the highest mean values for both volume and area while a decreasing quantitative trend in lectin signal was associated with increased acrylamide concentration. The most appreciable change within an acrylamide monomer group was decreased lectin volume in the 1% acrylamide monomer solution cleared in 8% SDS (1M8S) vs 1% monomer solution cleared with 4% SDS (1M4S) indicating potential disadvantageous effects of using 8% SDS in 1% acrylamide tissue for lectin staining.
Figure 5. Confocal-captured PV and lectin double-label immunostaining.
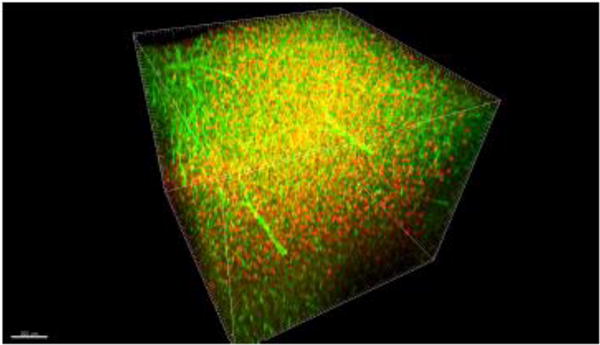
Dorsal ~1.2 mm of a 2 mm-thick brain slice fixed with 2% monomer acrylamide showing PV and lectin in red and green, respectively.
Figure 6. Representative confocal images of lectin-stained vasculature in the anterior cingulate cortex region.
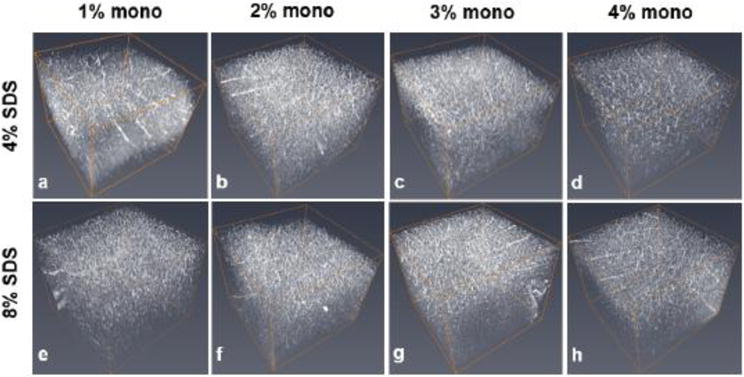
Comparison of positive signal through the top 1.2 mm of 2 mm-thick tissue slices infused with acrylamide monomer concentrations of 1% (A, E), 2% (B, F), 3% (C, G), and 4% (D, H) and cleared with either 4% (top row) or 8% SDS (bottom row). Abbreviations: mono; monomer, SDS; sodium dodecyl sulfate.
Figure 7. Quantitative analysis of vasculature volume acquired with confocal microscopy.
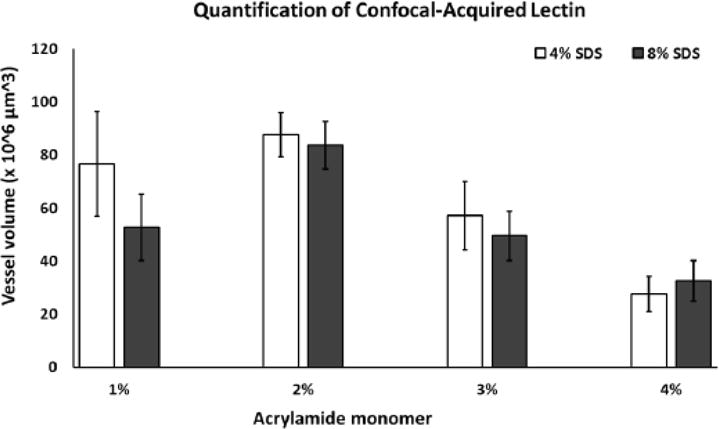
The following comparisons were statistically significant (p<0.05; n=5/group, +/- SD): 1M4S vs. 1M8S, 3M8S, 4M4S, 4M4S; 1M8S vs. 2M4S, 2M8S, 4M4S; 2M4S vs. 3M4S, 3M8S, 4M4S, 4M8S; 2M8S vs. 3M4S, 3M8S, 4M4S, 4M8S; 3M4S vs. 4M4S. Abbreviations: M; monomer SDS, sodium dodecyl sulfate.
Table 2. The effects of acrylamide and SDS content on lectin-stained vasculature volume.
P-values shown correspond to statistical comparisons between groups listed on the table perimeter with significant differences in bold. Arrows indicate the direction of change (increase or decrease) when comparing the row versus column condition. For example, 1M8S exhibits significantly less lectin volume compared to 1M4S, p=0.049.
| 1M4S | 1M8S | 2M4S | 2M8S | 3M4S | 3M8S | 4M4S | 4M8S | |
|---|---|---|---|---|---|---|---|---|
| 1M4S | 0.049 ↑ | 0.802 | 0.985 | 0.177 | 0.170 | <0.0001↑ | <0.0001↑ | |
| 1M8S | 0.049 ↓ | 0.001↓ | 0.009↓ | 0.999 | 1.000 | 0.350 | 0.197 | |
| 2M4S | 0.802 | 0.001 ↑ | 0.999 | 0.005↑ | <0.0001↑ | <0.0001↑ | <0.0001↑ | |
| 2M8S | 0.985 | 0.009 ↑ | 0.999 | 0.037 ↑ | 0.003 ↑ | <0.0001↑ | <0.0001↑ | |
| 3M4S | 0.177↓ | 0.999 | 0.005↓ | 0.037↓ | 0.964 | 0.008↑ | 0.061 | |
| 3M8S | 0.017↓ | 1.000 | <0.0001↓ | 0.003↓ | 0.964 | 0.940 | 0.390 | |
| 4M4S | <0.0001↓ | <0.035↓ | <0.0001↓ | <0.0001↓ | 0.008 ↓ | 0.094 | 0.998 | |
| 4M8S | <0.0001↓ | 0.197 | <0.0001↓ | <0.0001↓ | 0.061 | 0.390 | 0.988 |
COLM images
For comparison of PV+ signal and vasculature staining across acrylamide concentrations with a constant clearing time of 14 days in 4% SDS buffer, COLM-acquired images were processed and quantified in bilateral coronal slices (PV; Fig. 8; lectin; Fig. 10, PV+lectin, Fig. 11; supplemental movie ESM_6; supplemental movie ESM_7; supplemental movie ESM_8). Tyrosine hydroxylase-labeled neurons of the paraventricular hypothalamus and midbrain along with the medial forebrain bundle and nigrostriatal fibers were well visualized (supplemental movie ESM_6; supplemental movie ESM_9). Technical difficulties in obtaining accurate measurements post-processing due to tissue distortion/folding within the imaging cuvette reduced sample sizes from n=5/group to n=4-5 for lectin staining. In addition, a short-term malfunction of the COLM system 594 nm filter further reduced sample sizes by one per group yielding final sample sizes of n=3, 4, and 4 for 2%, 3%, and 4% acrylamide monomer, respectively. Quantitative results showed that the 3% monomer tissue exhibited a greater number of detectable cortical PV+ neurons compared to the 4% monomer infused slices (F (2, 6) =11.436, p=0.004; Fig. 9). Although the difference did not reach significance, the 2% acrylamide monomer tissue exhibited an increase in the mean number of detectable PV+ neurons compared to the 4% acrylamide monomer group (F (2, 6) =11.436, p=0.08). In contrast, there were no significant differences in lectin staining when comparing 2%, 3%, and 4% acrylamide when examining volume (F (2, 10) =1.833, all p>0.13; Fig. 12) or area (F (2, 10) =2.059, all p>0.16; data not shown).
Figure 8. Representative COLM images of 2 mm-thick PV immunofluorescence in the motor cortex region.
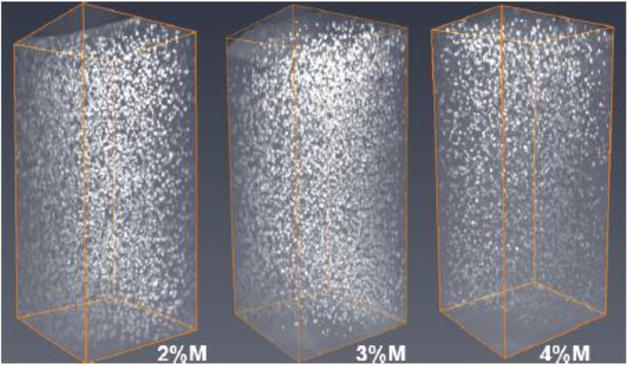
Comparison of lectin signal in tissue perfused with acrylamide monomer concentrations of 2%, 3% and 4% (left to right). Abbreviations: M; monomer.
Figure 10. Representative COLM images of 2 mm-thick lectin-stained vasculature in the motor cortex region.
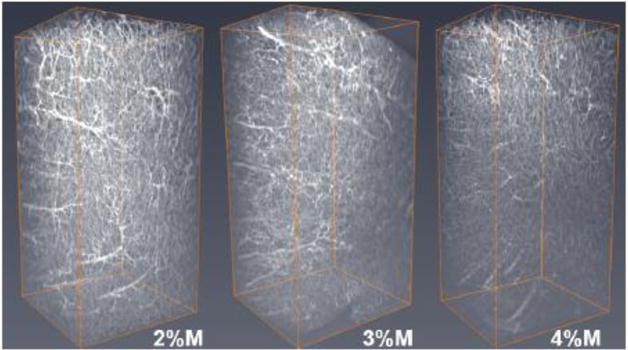
Comparison of lectin signal in tissue perfused with acrylamide monomer concentrations of 2%, 3% and 4% (left to right). Abbreviations: M; monomer.
Figure 11. COLM-acquired image of triple-labeling.
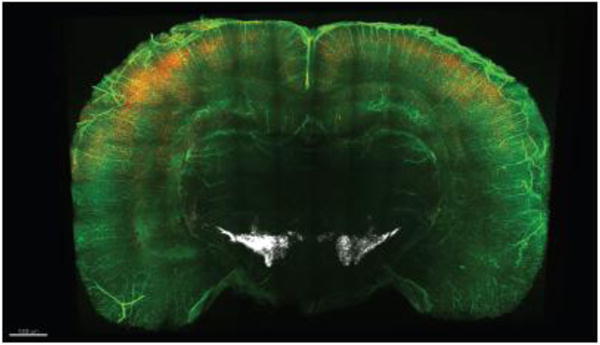
Screen shot of a representative volume-rendered 2 mm-thick mouse brain slice fixed with 2% monomer acrylamide showing PV (red) and tyrosine hydroxylase (white) immunostaining with lectin staining (green).
Figure 9. Quantitative analysis of COLM-acquired cortical PV+ neurons.
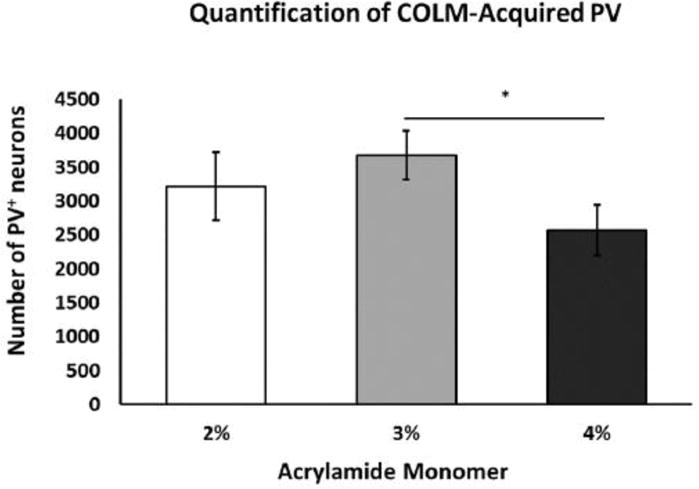
Immunofluorescence in 3% monomer tissue exhibits significantly greater number of PV+ cells vs. 4% monomer, *p=0.004). 2% monomer tissue also exhibited an increase in the number of PV+ cells, although this difference did not reach significance (vs. 4% monomer, p=0.08). 2%, n=3; 3%, n=4; 4%, n=5. Abbreviations: PV; parvalbumin.
Figure 12. Quantitative analysis of COLM-acquired lectin-stained vasculature volume.
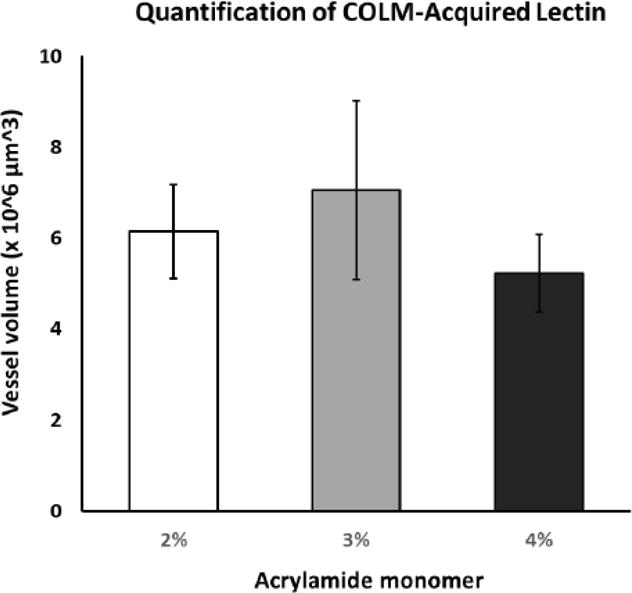
Although immunofluorescence measures in the 2% and 3% acrylamide monomer tissue showed a higher mean signal vs. 4% monomer, all comparisons were statistically insignificant (p>0.13). 2%, n=3; 3%, n=5; 4%, n=5.
Discussion
In an attempt to construct an optimal passive CLARITY protocol that provides ideal fluorescent signal visualization in 2 mm-thick brain tissue samples, we performed quantitative immunofluorescence and vasculature staining experiments using novel acrylamide formulas and variable SDS clearing buffer concentrations and incubation times. Our findings indicate that, amongst conditions tested, the 2% acrylamide monomer-based fixative offers ample room for error regarding clearing conditions and may be most ideal considering antibody penetration and antigenicity. Moreover, this formulation also appears to offer some degree of SDS buffer resiliency with respect to vasculature visualization when utilizing lectin staining. However, albeit potentially somewhat more tedious, we also note that comparable results can be obtained using 1% acrylamide monomer.
In order to specifically assess the effects of alternative CLARITY procedures on immunofluorescence, we examined the cortical expression of PV, an EF-hand family calcium-binding protein and interneuron marker (reviewed by (DeFelipe 1997) which represents a popular choice for determining the effectiveness of CLARITY procedures (Bastrup and Larsen 2017; Costantini et al. 2015; Phillips et al. 2016; Tomer et al. 2014; Treweek et al. 2015; Yu et al. 2017). Given the dysregulation of cortical PV-expressing interneurons in human schizophrenia (Gonzalez-Burgos et al. 2015; Lewis et al. 2012), CLARITY may serve as a powerful tool for better understanding psychiatric disorders as previously highlighted by a mouse model (Bastrup and Larsen 2017). Data from the present work establishes a quantitatively consistent ability to distinguish PV immunoreactivity across a variety of passive clearing conditions which differs from the somewhat more variable vasculature staining. These observations were determined using two separate paradigms both incorporating either 1, 2, 3, or 4% acrylamide monomer fixative combined with a 0.0125% bis-acrylamide constant. In the first experiment, tissue slices of each acrylamide composition were cleared in either 4 or 8% SDS and differentially determined to be sufficiently cleared when achieving transparency following placement on a grid pattern. Under these conditions, we found 8% SDS clearing buffer to be modestly quicker (by one day) in achieving transparency versus 4% SDS when processing the 1% and 2% acrylamide monomer-fixed tissue while being somewhat more effective for the 3% and 4% acrylamide solutions (2-3 days quicker for equivalent transparency). In a second experiment, adjacent slices representing each acrylamide condition were similarly processed with the exception that all samples were cleared for 14 days in 4% SDS. The latter paradigm was designed to test the retention and accessibility of antigen/lectin binding sites following SDS buffer incubation times that would surpass that to achieve suitable visual optical transparency as represented in experiment #1. Clearing time points during these extended clearing times exceeded those for all 4% SDS groups in experiment #1 ranging from 7, 6, 4, and 2 days longer for 1, 2, 3, and 4% acrylamide samples, respectively. Therefore, we also interpret 14-day lipid removal as a way to examine molecule labeling in tissue that has undergone extended clearing of varying lengths of time with resilience more challenged with decreasing acrylamide content.
Upon examining the potential effects of SDS and acrylamide concentration as well as clearing time on antigenicity, we found that the number of PV+ neurons was remarkably similar between samples differentially cleared in 4% and 8% SDS. Our data showed a single difference with 2% monomer/4% SDS samples having a significantly greater number of PV+ neurons versus 4% monomer/4% SDS. For sections cleared 14 days in 4% SDS, the 3% acrylamide group displayed a greater number of PV+ neurons versus the 4% monomer group. However, it is notable that both 2% and 3% acrylamide groups were not significantly different from each other even though each was cleared 6 and 4 days longer than necessary to achieve visual transparency (as determined by customized clearing times in experiment #1), respectively. Furthermore, the staining appeared to be routinely more uniform throughout the tissue suggesting that, compared to the confocal images, even when the sample looks clear “by eye,” that additional time in SDS is likely capable of enhancing antibody penetration. These findings point to the 2% monomer antigenicity as being adequately resilient to prolonged 4% SDS treatment and is in line with our analysis of subjective clearing combining 2% monomer and 8% SDS. Though we did not test different antibody incubation times, it is plausible that the lower neuron counts and less uniform signal obtained from the 4% monomer groups in both experiments reflect a need for longer antibody incubation due to the positive relationship between acrylamide concentration and hydrogel pore size. On the other hand, when considering pore size, it is also possible that the 1% monomer slices cleared for 14 days in 4% SDS may have exhibited suitable signal. However, unlike the 2% formulation, the tissue could not be analyzed as it was especially fragile, difficult to handle without damage, and could not maintain suitable rigidity in the COLM imaging cuvette. This outcome validates the compromise in using a 2% monomer solution to achieve efficient clearing with optimal antibody penetration and still maintain the solidity required for mechanical manipulation associated with imaging. Nonetheless, it is remarkable that we also found no significant changes in tissue volume between brain samples across acrylamide concentrations when paired with variable 4% SDS clearing regimens. These data suggest that tissue expansion and any potential correlative changes in antibody permeability did not seem to quantitatively affect PV+ neuron counts. Furthermore, the trend for brain slice volume to shrink upon placement in 88% Histodenz, with 3% acrylamide slices ultimately being slightly larger than those of 1% and 2% but not significantly different than the 4% samples, similarly does not seem to have influenced the current results.
In addition to using immunofluorescence, we also analyzed fluorescein-labeled lycopersicon esculentum (tomato) lectin staining following a 2-day incubation. Lycopersicon esculentum is a glycoprotein (~ 70kD) that binds to N-acetyl-D-glucosamine and N-acetyl-polyactosamine associated with endothelial cells (Kawashima et al. 1990; Porter et al. 1990). In contrast to PV signal, tomato lectin was quantitatively affected by SDS concentration as evidenced by a reduction in detected vasculature volume in 1% monomer/8% SDS versus 1% monomer/4% SDS groups. This would imply such low acrylamide may not be optimal for retaining lectin-binding targets when using 8% SDS, albeit higher acrylamide formulations diminish these effects within monomer groups. In general, the 1% monomer/4% SDS and both 2% monomer groups (4 and 8% SDS) displayed the largest magnitude of vasculature measurements which then sequentially declined in 3% and 4% monomer infused tissues. Lectin signal was visualized throughout the depth of the tissue but it is unclear whether a longer incubation may have attributed to the enhanced vasculature volume measures at higher acrylamide concentrations. In contrast to differential clearance (7 days for each hemi-slice), 1% monomer/4% SDS bilateral slices cleared 14 days were too fragile to analyze while there was no significant difference between 2, 3, and 4% monomer groups. It is interesting to speculate that the lack of statistical significance between acrylamide groups stems from a loss in lectin binding sites, versus 4% monomer through extensive SDS rinsing, however, further studies would be needed to confirm this. Lastly, in agreement with the PV+ neuron analysis discussed above, the tissue slice volume changes following incubation in Histodenz refractive index matching solution are not in line with corresponding quantitative changes in lectin staining.
Notwithstanding our implementation of a set of novel acrylamide solutions, it is essential to compare and contrast similar methods carried out by other investigators. The laboratory of Dr. Karl Deisseroth provided the first published passive CLARITY protocols utilizing the original (Zhang et al. 2014) and manipulated acrylamide monomer and bis-acrylamide ratios (Tomer et al. 2014). Non-quantitative demonstrations show that PV signal can be achieved using concentrations ranging from 4% monomer/0.05% bis-acrylamide (Chung et al. 2013) down to 0.5% monomer/0.0125% bis-acrylamide in 1 mm brain slices (Tomer et al. 2014). However, in the latter study, no specific formulas were given or comparatively analyzed using monomer/bis-acrylamide ratios utilizing 1, 2, or 3% monomer solutions. Nevertheless, passive CLARITY in brain tissue constituting 1% monomer/0.0125% bis-acrylamide, identical to the present study, has been previously applied to successfully visualize tyrosine hydroxylase and GFP antibodies in whole mouse brain (Lerner et al. 2015). Similarly, 1.75% monomer/0.01875% bis-acrylamide was also effectively used to detect myelin basic protein (Chang et al. 2017). Whereas it is clear that lower acrylamide ratios using 1% acrylamide monomer can be linked to suitable immunofluorescence, the current lectin and PV staining data advise that clearing time and SDS concentration should be carefully considered when using 1% monomer solutions, as staining quality and structural integrity may be more compromised over the course of SDS detergent processing.
Several passive CLARITY studies validate the practice of tissue immersion in 4% monomer without bis-acrylamide (A4P0) following paraformaldehyde perfusion as first characterized by the laboratory of Dr. Viviana Gradinaru (Treweek et al. 2015; Yang et al. 2014). Immunofluorescence using A4P0 has been largely gauged in 1-2 mm thick brain slices thus far (Miller and Rothstein 2016; Yu et al. 2017; Zheng and Rinaman 2016). While we did not quantitatively compare the presently reported acrylamide configurations with A4P0, the relative viscosity seems most qualitatively analogous to our 3% monomer formula (unpublished observation). Whether this visual similarity translates into equivalent staining and lipid removal outcomes remains uncertain. The antibody (IgG) penetration rate using A4P0 was formerly estimated to be between 500-600 μM over 72 hours when tested on 3 mm-thick brain sections (Yang et al. 2014). In line with this finding, Treweek et al. (2015) showed uniform PV signal in 1 mm-thick slices when incubated in primary and fab-fragment secondary (also used in the current study) over 2 days. Although we observed good antibody penetration in 2 mm-thick tissue using our 2% and 3% monomer solutions over 3-day antibody incubation, with more uniform presentation in more extensively cleared tissue, we cannot draw strong conclusions between different paradigms. For example, Bastrup and Larsen (2017) demonstrated that 7-day PV antibody incubation in ETC-cleared 2 mm sections leads to only partial penetration when employing a low acrylamide fixative (2% PFA, 2% monomer, no bis-acrylamide). Hence, in addition to acrylamide pore size, differential penetrance/staining, in part, will likely involve protocol-based variation in the duration of antibody incubation and a number of clearing process variables including determination of when adequate lipid removal is accomplished.
In conclusion, the present work reveals a novel set of acrylamide CLARITY fixatives and clearing conditions that generate consistent immunofluorescence and lectin visualization in 2 mm-thick mouse brain slices. Our results suggest that our 2% hydrogel solution (2% acrylamide monomer + 0.0125% bis-acrylamide + 4% PFA) generally provides the most optimal preservation of antigenicity and structural integrity along with antibody penetration and lectin binding site access when cleared with 4% SDS. However, a 1% acrylamide monomer fixative may also be implemented to yield satisfactory immunofluorescence with well-timed clearing in either 4 or 8% SDS. Defining such conditions that are ideal for antibody penetration and fluorescence visualization should enable a range of studies to visualize protein expression and regulation in 3D across a range of conditions.
Supplementary Material
ESM_1: Relative viscosity of 4% acrylamide monomer solution combined with variable bis-acrylamide content. Post-polymerization of solutions containing 0.0375% (A), 0.025% (B), 0.0125% (C), or 0.00625% (D) bis-acrylamide. Note the transition from solid (A, B) to decreased viscosity (C, D).
ESM_2: The effect of 4% SDS clearing time on tissue volume. Volume measurements (length × width × thickness) were obtained for 1-4% acrylamide monomer formulas following 37°C SDS clearing times matching both confocal and COLM experiments. Tissue volumes associated with acrylamide concentrations of 1% (n=4/group, 7 and 14 days), 2% (n=4/group, 8 and 14 days), 3% (n=3/group, 10 and 14 days), and 4% (n=3/group, 12 and 14 days) were not significantly different (p>0.09).
ESM_3: The effect 88% Histodenz refractive index matching solution on tissue volume. Volume measurements (length × width × thickness) were obtained following 14 day SDS clearing, rinsing in boric acid buffer, and overnight incubation in 88% Histodenz. Analysis was performed on Histodenz-equilibrated samples at room temperature to mimic conditions during image acquisition. 3% acrylamide monomer (n=3/group) was significantly expanded vs. 1% (**p<0.005, n=4/group) and 2% (*p<0.034, n=4/group) acrylamide formulas but not compared to that of 4% (p>0.2, n=3/group).
ESM_4: 3D visualization of PV+ interneurons after surface rendering using Amira. Color coding represents segmented individual neurons immunostained for PV (white) with signal above threshold and assigned automatically in Amira software during quantitation. Video can be viewed using QuickTime or VLC media player.
ESM_5: 3D visualization of cortical PV+ interneurons and lectin stained vasculature. Mouse brains were perfused with 2% acrylamide and cleared with 4% SDS. This movie first shows a series of xy-plane images acquired on a confocal microscope followed by a maximum intensity projection 3D volume rendering of PV cells (red) and vasculature (green) in Imaris software. Video can be viewed using QuickTime or VLC media player.
ESM_6: Maximum intensity projected 3D visualization of coronal slice images acquired with a COLM system. Imaris rendering shows neurons immunostained for PV (red) and tyrosine hydroxylase (white) with lectin-stained vasculature (green) in brain perfused with 2% acrylamide and cleared with 4% SDS. Fly through cortical area represents the region of interest considered for quantitation which was kept consistent across samples and groups. TH+ fibers represent nigrostriatal efferents. Video can be viewed using QuickTime or VLC media player.
ESM_7: Magnified right hemisphere view of raw images acquired using a COLM system. Dorsal half of the right hemisphere from a coronal brain slice is visualized in a series of xy-plane images recorded in Amira. PV+ neurons and vasculature are in red and green, respectively. Video can be viewed using QuickTime or VLC media player.
ESM_8: Surface-rendered post-quantification animation in Amira. Color coded individual PV+ neurons and lectin stained vasculature (blue) within the quantified region of interest captured with a COLM system. Video can be viewed using QuickTime or VLC media player.
ESM_9: Tyrosine hydroxylase (TH) expressing neuronal cell bodies and fibers. A series of xy-plane images show TH positive cell bodies in substantia nigra pars compacta (SNc) and ventral tegmental area (VTA). Projections from SNc can be seen innervating striatum via nigrostriatal pathway whereas projections from VTA are directed towards cortex. TH positive cell bodies can also be seen around paraventricular nucleus and zona incerta regions in hypothalamus. Movie derived from brain perfused with 2% acrylamide monomer, cleared with 4% SDS and imaged using a COLM with 10x objective.
Acknowledgments
We would like to thank Drs. Maria Waselus and Aram Parsegian in reviewing the present manuscript. We also greatly appreciate the efforts of Mr. James Stewart and Drs. Qiang Wei and Elaine Hebda-Bauer for assistance with animal care and obtaining animals for preliminary experiments. For technical advice regarding CLARITY procedures we wish to thank Drs. Robert Thompson and Hui Li as well as Mr. Tom Dixon. This work was supported by NIH: R01MH104261, ONR N00014-12-1-0366, Hope for Depression Research Foundation, and Pritzker Neuropsychiatric Research Consortium.
References
- Ando K, Laborde Q, Lazar A, Godefroy D, Youssef I, Amar M, Pooler A, Potier MC, Delatour B, Duyckaerts C. Inside Alzheimer brain with CLARITY: senile plaques, neurofibrillary tangles and axons in 3-D. Acta Neuropathol. 2014;128(3):457–459. doi: 10.1007/s00401-014-1322-y. [DOI] [PMC free article] [PubMed] [Google Scholar]
- Bastrup J, Larsen PH. Optimized CLARITY technique detects reduced parvalbumin density in a genetic model of schizophrenia. J Neurosci Methods. 2017;283:23–32. doi: 10.1016/j.jneumeth.2017.03.011. [DOI] [PubMed] [Google Scholar]
- Chang EH, Argyelan M, Aggarwal M, Chandon TS, Karlsgodt KH, Mori S, Malhotra AK. The role of myelination in measures of white matter integrity: Combination of diffusion tensor imaging and two-photon microscopy of CLARITY intact brains. Neuroimage. 2017;147:253–261. doi: 10.1016/j.neuroimage.2016.11.068. [DOI] [PMC free article] [PubMed] [Google Scholar]
- Chung K, Wallace J, Kim SY, Kalyanasundaram S, Andalman AS, Davidson TJ, Mirzabekov JJ, Zalocusky KA, Mattis J, Denisin AK, Pak S, Bernstein H, Ramakrishnan C, Grosenick L, Gradinaru V, Deisseroth K. Structural and molecular interrogation of intact biological systems. Nature. 2013;497(7449):332–337. doi: 10.1038/nature12107. [DOI] [PMC free article] [PubMed] [Google Scholar]
- Costantini I, Ghobril JP, Di Giovanna AP, Allegra Mascaro AL, Silvestri L, Mullenbroich MC, Onofri L, Conti V, Vanzi F, Sacconi L, Guerrini R, Markram H, Iannello G, Pavone FS. A versatile clearing agent for multi-modal brain imaging. Sci Rep. 2015;5:9808. doi: 10.1038/srep09808. [DOI] [PMC free article] [PubMed] [Google Scholar]
- DeFelipe J. Types of neurons, synaptic connections and chemical characteristics of cells immunoreactive for calbindin-D28K, parvalbumin and calretinin in the neocortex. J Chem Neuroanat. 1997;14(1):1–19. doi: 10.1016/s0891-0618(97)10013-8. [DOI] [PubMed] [Google Scholar]
- Epp JR, Niibori Y, Liz Hsiang HL, Mercaldo V, Deisseroth K, Josselyn SA, Frankland PW. Optimization of CLARITY for Clearing Whole-Brain and Other Intact Organs(1,2,3) eNeuro. 2015;2(3) doi: 10.1523/ENEURO.0022-15.2015. [DOI] [PMC free article] [PubMed] [Google Scholar]
- Gonzalez-Burgos G, Cho RY, Lewis DA. Alterations in cortical network oscillations and parvalbumin neurons in schizophrenia. Biol Psychiatry. 2015;77(12):1031–1040. doi: 10.1016/j.biopsych.2015.03.010. [DOI] [PMC free article] [PubMed] [Google Scholar]
- Kawashima H, Sueyoshi S, Li H, Yamamoto K, Osawa T. Carbohydrate binding specificities of several poly-N-acetyllactosamine-binding lectins. Glycoconj J. 1990;7(4):323–334. doi: 10.1007/BF01073376. [DOI] [PubMed] [Google Scholar]
- Kim SY, Cho JH, Murray E, Bakh N, Choi H, Ohn K, Ruelas L, Hubbert A, McCue M, Vassallo SL, Keller PJ, Chung K. Stochastic electrotransport selectively enhances the transport of highly electromobile molecules. Proc Natl Acad Sci U S A. 2015;112(46):E6274–6283. doi: 10.1073/pnas.1510133112. [DOI] [PMC free article] [PubMed] [Google Scholar]
- Lee H, Park JH, Seo I, Park SH, Kim S. Improved application of the electrophoretic tissue clearing technology, CLARITY, to intact solid organs including brain, pancreas, liver, kidney, lung, and intestine. BMC Dev Biol. 2014;14:48. doi: 10.1186/s12861-014-0048-3. [DOI] [PMC free article] [PubMed] [Google Scholar]
- Lerner TN, Shilyansky C, Davidson TJ, Evans KE, Beier KT, Zalocusky KA, Crow AK, Malenka RC, Luo L, Tomer R, Deisseroth K. Intact-Brain Analyses Reveal Distinct Information Carried by SNc Dopamine Subcircuits. Cell. 2015;162(3):635–647. doi: 10.1016/j.cell.2015.07.014. [DOI] [PMC free article] [PubMed] [Google Scholar]
- Lewis DA, Curley AA, Glausier JR, Volk DW. Cortical parvalbumin interneurons and cognitive dysfunction in schizophrenia. Trends Neurosci. 2012;35(1):57–67. doi: 10.1016/j.tins.2011.10.004. [DOI] [PMC free article] [PubMed] [Google Scholar]
- Liu AK, Hurry ME, Ng OT, DeFelice J, Lai HM, Pearce RK, Wong GT, Chang RC, Gentleman SM. Bringing CLARITY to the human brain: visualization of Lewy pathology in three dimensions. Neuropathol Appl Neurobiol. 2016;42(6):573–587. doi: 10.1111/nan.12293. [DOI] [PMC free article] [PubMed] [Google Scholar]
- Magliaro C, Callara AL, Mattei G, Morcinelli M, Viaggi C, Vaglini F, Ahluwalia A. Clarifying CLARITY: Quantitative Optimization of the Diffusion Based Delipidation Protocol for Genetically Labeled Tissue. Front Neurosci. 2016;10:179. doi: 10.3389/fnins.2016.00179. [DOI] [PMC free article] [PubMed] [Google Scholar]
- Menegas W, Bergan JF, Ogawa SK, Isogai Y, Umadevi Venkataraju K, Osten P, Uchida N, Watabe-Uchida M. Dopamine neurons projecting to the posterior striatum form an anatomically distinct subclass. Elife. 2015;4:e10032. doi: 10.7554/eLife.10032. [DOI] [PMC free article] [PubMed] [Google Scholar]
- Miller SJ, Rothstein JD. Astroglia in Thick Tissue with Super Resolution and Cellular Reconstruction. PLoS One. 2016;11(8):e0160391. doi: 10.1371/journal.pone.0160391. [DOI] [PMC free article] [PubMed] [Google Scholar]
- Phillips J, Laude A, Lightowlers R, Morris CM, Turnbull DM, Lax NZ. Development of passive CLARITY and immunofluorescent labelling of multiple proteins in human cerebellum: understanding mechanisms of neurodegeneration in mitochondrial disease. Sci Rep. 2016;6:26013. doi: 10.1038/srep26013. [DOI] [PMC free article] [PubMed] [Google Scholar]
- Poguzhelskaya E, Artamonov D, Bolshakova A, Vlasova O, Bezprozvanny I. Simplified method to perform CLARITY imaging. Mol Neurodegener. 2014;9:19. doi: 10.1186/1750-1326-9-19. [DOI] [PMC free article] [PubMed] [Google Scholar]
- Porter GA, Palade GE, Milici AJ. Differential binding of the lectins Griffonia simplicifolia I and Lycopersicon esculentum to microvascular endothelium: organ-specific localization and partial glycoprotein characterization. Eur J Cell Biol. 1990;51(1):85–95. [PubMed] [Google Scholar]
- Renier N, Wu Z, Simon DJ, Yang J, Ariel P, Tessier-Lavigne M. iDISCO: a simple, rapid method to immunolabel large tissue samples for volume imaging. Cell. 2014;159(4):896–910. doi: 10.1016/j.cell.2014.10.010. [DOI] [PubMed] [Google Scholar]
- Richardson DS, Lichtman JW. Clarifying Tissue Clearing. Cell. 2015;162(2):246–257. doi: 10.1016/j.cell.2015.06.067. [DOI] [PMC free article] [PubMed] [Google Scholar]
- Stefaniuk M, Gualda EJ, Pawlowska M, Legutko D, Matryba P, Koza P, Konopka W, Owczarek D, Wawrzyniak M, Loza-Alvarez P, Kaczmarek L. Light-sheet microscopy imaging of a whole cleared rat brain with Thy1-GFP transgene. Sci Rep. 2016;6:28209. doi: 10.1038/srep28209. [DOI] [PMC free article] [PubMed] [Google Scholar]
- Susaki EA, Tainaka K, Perrin D, Yukinaga H, Kuno A, Ueda HR. Advanced CUBIC protocols for whole-brain and whole-body clearing and imaging. Nat Protoc. 2015;10(11):1709–1727. doi: 10.1038/nprot.2015.085. [DOI] [PubMed] [Google Scholar]
- Tomer R, Ye L, Hsueh B, Deisseroth K. Advanced CLARITY for rapid and high-resolution imaging of intact tissues. Nat Protoc. 2014;9(7):1682–1697. doi: 10.1038/nprot.2014.123. [DOI] [PMC free article] [PubMed] [Google Scholar]
- Treweek JB, Chan KY, Flytzanis NC, Yang B, Deverman BE, Greenbaum A, Lignell A, Xiao C, Cai L, Ladinsky MS, Bjorkman PJ, Fowlkes CC, Gradinaru V. Whole-body tissue stabilization and selective extractions via tissue-hydrogel hybrids for high-resolution intact circuit mapping and phenotyping. Nat Protoc. 2015;10(11):1860–1896. doi: 10.1038/nprot.2015.122. [DOI] [PMC free article] [PubMed] [Google Scholar]
- Woo J, Lee M, Seo JM, Park HS, Cho YE. Optimization of the optical transparency of rodent tissues by modified PACT-based passive clearing. Exp Mol Med. 2016;48(12):e274. doi: 10.1038/emm.2016.105. [DOI] [PMC free article] [PubMed] [Google Scholar]
- Yang B, Treweek JB, Kulkarni RP, Deverman BE, Chen CK, Lubeck E, Shah S, Cai L, Gradinaru V. Single-cell phenotyping within transparent intact tissue through whole-body clearing. Cell. 2014;158(4):945–958. doi: 10.1016/j.cell.2014.07.017. [DOI] [PMC free article] [PubMed] [Google Scholar]
- Ye L, Allen WE, Thompson KR, Tian Q, Hsueh B, Ramakrishnan C, Wang AC, Jennings JH, Adhikari A, Halpern CH, Witten IB, Barth AL, Luo L, McNab JA, Deisseroth K. Wiring and Molecular Features of Prefrontal Ensembles Representing Distinct Experiences. Cell. 2016;165(7):1776–1788. doi: 10.1016/j.cell.2016.05.010. [DOI] [PMC free article] [PubMed] [Google Scholar]
- Yu T, Qi Y, Zhu J, Xu J, Gong H, Luo Q, Zhu D. Elevated-temperature-induced acceleration of PACT clearing process of mouse brain tissue. Sci Rep. 2017;7:38848. doi: 10.1038/srep38848. [DOI] [PMC free article] [PubMed] [Google Scholar]
- Zhang MD, Tortoriello G, Hsueh B, Tomer R, Ye L, Mitsios N, Borgius L, Grant G, Kiehn O, Watanabe M, Uhlen M, Mulder J, Deisseroth K, Harkany T, Hokfelt TG. Neuronal calcium-binding proteins 1/2 localize to dorsal root ganglia and excitatory spinal neurons and are regulated by nerve injury. Proc Natl Acad Sci U S A. 2014;111(12):E1149–1158. doi: 10.1073/pnas.1402318111. [DOI] [PMC free article] [PubMed] [Google Scholar]
- Zheng H, Rinaman L. Simplified CLARITY for visualizing immunofluorescence labeling in the developing rat brain. Brain Struct Funct. 2016;221(4):2375–2383. doi: 10.1007/s00429-015-1020-0. [DOI] [PMC free article] [PubMed] [Google Scholar]
Associated Data
This section collects any data citations, data availability statements, or supplementary materials included in this article.
Supplementary Materials
ESM_1: Relative viscosity of 4% acrylamide monomer solution combined with variable bis-acrylamide content. Post-polymerization of solutions containing 0.0375% (A), 0.025% (B), 0.0125% (C), or 0.00625% (D) bis-acrylamide. Note the transition from solid (A, B) to decreased viscosity (C, D).
ESM_2: The effect of 4% SDS clearing time on tissue volume. Volume measurements (length × width × thickness) were obtained for 1-4% acrylamide monomer formulas following 37°C SDS clearing times matching both confocal and COLM experiments. Tissue volumes associated with acrylamide concentrations of 1% (n=4/group, 7 and 14 days), 2% (n=4/group, 8 and 14 days), 3% (n=3/group, 10 and 14 days), and 4% (n=3/group, 12 and 14 days) were not significantly different (p>0.09).
ESM_3: The effect 88% Histodenz refractive index matching solution on tissue volume. Volume measurements (length × width × thickness) were obtained following 14 day SDS clearing, rinsing in boric acid buffer, and overnight incubation in 88% Histodenz. Analysis was performed on Histodenz-equilibrated samples at room temperature to mimic conditions during image acquisition. 3% acrylamide monomer (n=3/group) was significantly expanded vs. 1% (**p<0.005, n=4/group) and 2% (*p<0.034, n=4/group) acrylamide formulas but not compared to that of 4% (p>0.2, n=3/group).
ESM_4: 3D visualization of PV+ interneurons after surface rendering using Amira. Color coding represents segmented individual neurons immunostained for PV (white) with signal above threshold and assigned automatically in Amira software during quantitation. Video can be viewed using QuickTime or VLC media player.
ESM_5: 3D visualization of cortical PV+ interneurons and lectin stained vasculature. Mouse brains were perfused with 2% acrylamide and cleared with 4% SDS. This movie first shows a series of xy-plane images acquired on a confocal microscope followed by a maximum intensity projection 3D volume rendering of PV cells (red) and vasculature (green) in Imaris software. Video can be viewed using QuickTime or VLC media player.
ESM_6: Maximum intensity projected 3D visualization of coronal slice images acquired with a COLM system. Imaris rendering shows neurons immunostained for PV (red) and tyrosine hydroxylase (white) with lectin-stained vasculature (green) in brain perfused with 2% acrylamide and cleared with 4% SDS. Fly through cortical area represents the region of interest considered for quantitation which was kept consistent across samples and groups. TH+ fibers represent nigrostriatal efferents. Video can be viewed using QuickTime or VLC media player.
ESM_7: Magnified right hemisphere view of raw images acquired using a COLM system. Dorsal half of the right hemisphere from a coronal brain slice is visualized in a series of xy-plane images recorded in Amira. PV+ neurons and vasculature are in red and green, respectively. Video can be viewed using QuickTime or VLC media player.
ESM_8: Surface-rendered post-quantification animation in Amira. Color coded individual PV+ neurons and lectin stained vasculature (blue) within the quantified region of interest captured with a COLM system. Video can be viewed using QuickTime or VLC media player.
ESM_9: Tyrosine hydroxylase (TH) expressing neuronal cell bodies and fibers. A series of xy-plane images show TH positive cell bodies in substantia nigra pars compacta (SNc) and ventral tegmental area (VTA). Projections from SNc can be seen innervating striatum via nigrostriatal pathway whereas projections from VTA are directed towards cortex. TH positive cell bodies can also be seen around paraventricular nucleus and zona incerta regions in hypothalamus. Movie derived from brain perfused with 2% acrylamide monomer, cleared with 4% SDS and imaged using a COLM with 10x objective.


